Figure 3.
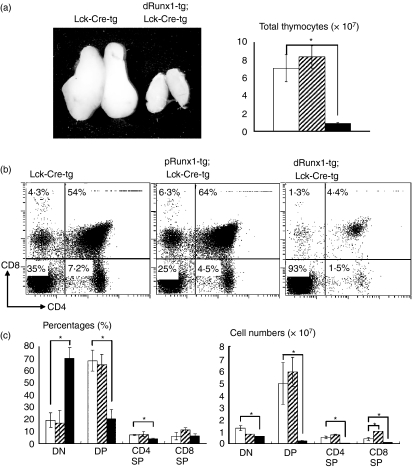
Effects of Lck-driven Runx1 over-expression on thymocyte differentiation. (a) Gross appearance of thymuses and total numbers of thymocytes. (b) Thymocytes were isolated from the transgenic mice indicated and processed for the flow cytometric analysis of CD4 and CD8 expression. Numbers given in each quadrant indicate the percentages of cells in each subset. Representative profiles are shown here. (c) Comparison of the percentages and cell numbers of double-negative (DN), double-positive (DP), CD4 single-positive (SP) and CD8 SP subset. In (a) and (c), the genotypes of mice were Lck-Cre-tg (open bars), proximal Runx1-tg;Lck-Cre-tg (shaded bars) and distal Runx1-tg;Lck-Cre-tg (closed bars), respectively. Mean ± SD (n = 3) are shown for each thymocyte subset and each transgenic mouse. Significances of difference were statistically tested by Student’s t-test, and if detected between the compared genotypes, they are indicated by brackets with *(P < 0·05). (b) CD4 repression by Runx1 over-expression was not observed in the present study, unlike the case of Runx1 introduction into a thymocyte culture by retrovirus.37 (c) The number of CD8 SP cells was significantly increased in proximal Runx1-tg;Lck-Cre-tg compared with Lck-Cre-tg thymuses (P < 0·05). This observation supports our previous report of CD2-driven, proximal Runx1-tg thymuses.5

