

Abstract
Metabolic cofactors such as NADH and ATP play important roles in a large number of cellular reactions, and it is of great interest to dissect the role of these cofactors in different aspects of metabolism. Toward this goal, we overexpressed NADH oxidase and the soluble F1-ATPase in Escherichia coli to lower the level of NADH and ATP, respectively. We used a global interaction network, comprising of protein interactions, transcriptional regulation, and metabolic networks, to integrate data from transcription profiles, metabolic fluxes, and the metabolite levels. We identified high-scoring networks for the two strains. The results revealed a smaller, but denser network for perturbations of ATP level, compared with that of NADH level. The action of many global transcription factors such as ArcA, Fnr, CRP, and IHF commonly involved both NADH and ATP, whereas others responded to either ATP or NADH. Overexpressing NADH oxidase invokes response in widespread aspects of metabolism involving the redox cofactors (NADH and NADPH), whereas ATPase has a more focused response to restore ATP level by enhancing proton translocation mechanisms and repressing biosynthesis. Interestingly, NADPH played a key role in restoring redox homeostasis through the concerted activity of isocitrate dehydrogenase and UdhA transhydrogenase. We present a reconciled network of regulation that illustrates the overlapping and distinct aspects of metabolism controlled by NADH and ATP. Our study contributes to the general understanding of redox and energy metabolism and should help in developing metabolic engineering strategies in E. coli.
Keywords: F1Fo ATPase, Glycolysis, Metabolic Regulation, Transcription Regulation, Tricarboxylic Acid (TCA) Cycle, Cofactor Perturbation, Escherichia coli, NADH Oxidase, Soluble ATPase, Systems Biology
Introduction
Microbial metabolic networks function in a coherent fashion to convert the available substrates into biomass and products. Often, intermediates of metabolism are not balanced with respect to their redox and/or energy content. Metabolic cofactors such as NADH and ATP serve in overcoming these constraints. Indeed, these cofactors rank among the most highly connected metabolites in the metabolic networks of most microorganisms (1). A direct consequence of this metabolic structure is that a small change in the concentration of these cofactors is likely to propagate to widespread aspects of metabolism. For example, the synthesis of proteins, lipids, and nucleotides is energetically expensive and would drain cellular ATP and also require NADPH (2). ATP is primarily produced in the electron transport chain, which is fueled by NADH. NADH is produced in the catabolism, relating substrate utilization to biosynthesis and product formation. Therefore, these cofactors hold the potential to serve as targets for altering cellular metabolism.
To achieve the desired metabolic changes, it is important to understand the metabolic processes that are specifically controlled by cofactors. NADPH primarily drives anabolic reactions, whereas NADH is the result of catabolism. To fulfill their distinct roles, these two redox couples are generally not in thermodynamic equilibrium. NADPH is primarily produced in the oxidative branch of the pentose phosphate pathway or by the isocitrate dehydrogenase in the tricarboxylic acid (TCA)2 cycle. Many organisms also have a transhydrogenase that can interconvert NADH and NADPH, and some bacteria such as Escherichia coli rely more heavily than others on transhydrogenases for NADPH (3).
Because the cofactors are intimately connected with one another via the transhydrogenases or the oxidative phosphorylation, there is no clear distinction on the role of NADH and ATP in regulating metabolism. Increasing the intracellular level of NADH in E. coli increased acetate excretion accompanied with a shift in metabolism to produce typically fermentative products such as lactate and succinate even in the presence of ample oxygen (4, 5). The converse approach of lowering NADH level decreased acetate overflow (6). On the contrary, acetate overflow increased when ATP level was lowered in E. coli (7). These two approaches are of particular interest because they involve introducing heterologous enzymes that specifically decrease NADH or ATP concentrations. This is likely to invoke an unbiased response as opposed to affecting a specific metabolic reaction, which will have localized network effects around the altered reaction. Water-forming NADH oxidase from Streptococcus pneumonia was used to lower cellular NADH concentrations (6), while the soluble F1 part of the F0F1-ATP synthase was used to specifically hydrolyze ATP (7).
The predominant phenotype of E. coli harboring these enzymes shows an increased glycolytic flux at the expense of biomass production. Overexpression of NADH oxidase decreased acetate overflow whereas overexpression of the soluble ATPase increased acetate excretion. Transcription analysis in NADH oxidase overexpressed E. coli revealed elegant regulation governed by ArcA that brought about these changes (6). Many global transcription factors and two-component signal transduction systems in E. coli are triggered by redox or energy cofactors (8) and yet, only few of these global transcription factors affect metabolic fluxes (9). From a basic research point of view, there is a gap in our understanding of the influence of these transcriptional regulators on metabolism.
The objective of this research is to determine the role of NADH and ATP in regulating metabolism. More specifically, we aim to map the overlap in the regulation and identify aspects of metabolism that are specifically controlled by NADH or ATP. Toward this goal, we quantified changes in metabolic fluxes in central carbon metabolism, the level of central carbon metabolites and cofactors and genome-wide transcription changes in response to overexpressing NADH oxidase or the soluble F1-ATPase subunit. We analyzed the response in the context of a global interaction map and identified metabolic modules that responded to the perturbations.
EXPERIMENTAL PROCEDURES
Construction of Strains and Plasmids
The E. coli K12 strain, MG1655, was used as the reference strain in this study. All the strains and plasmids used in this study are listed in Table 1. In this strain, NADH oxidase or the soluble ATPase were overexpressed using the nox gene from Streptococcus pneumoniae (GenBankTM entry AF014458) or the native atpAGD operon (encoding the α-, β-, and γ-subunits of the ATPase). The nox gene was amplified from the pTrc99A-nox plasmid (6) using the forward primer containing the restriction site for XhoI (underlined), AGTTGGCTCGAGATGCNNNNNAGTTTATTCNTGACANNNNNNNNNNNNNNTGRTATAATNNNNCTGAAACAAACTGGAGACTGTCATGAGTAAAATCGTTGTAGTCGGTGC and the reverse primer containing the restriction site for XmaI (underlined), GTCAGTCCCGGGTTATTTTTCAGCCGTAAGGGCAG. The annealing portion of the gene is italicized. The forward primer consisted of varying spacer regions surrounding the consensus −35 and −10 regions of the promoter to vary the promoter strength (10–12). A library of promoters with varying strengths was constructed. These fragments were digested with XhoI and XmaI restriction enzymes and ligated into the pAK80 vector (13), which was also subjected to restriction digest with the same enzymes. The pCP41 plasmid containing the atpAGD operon (7), which resulted in a moderate level of ATPase activity was used. The PCR was performed using Phusion polymerase (Finnzymes, Espoo, Finland). The plasmids were introduced into E. coli MC1000 for screening. The plasmid that resulted in approximately the same reduction in growth rate as the pCP41 was selected for this study (pAC06). The presence of the genes was verified by an enzymatic assay as previously described (6, 7). The MG1655 strain was transformed with pAK80, pCP41 and pAC06 plasmids and the resulting strains are designated REF (containing empty vector), ATPase, and NOX, respectively.
TABLE 1.
List of plasmids and strains used in this study
| Plasmid/strain | Description | Source/Ref. |
|---|---|---|
| Plasmids | ||
| pAK80 | Promoterless vector carrying the lacLM genes, ErmR | (13) |
| pAC06 | pAK80::nox (synthetic promoter), ErmR | This study |
| pCP41::atpAGD | ATPase activity, pCP41::atpAGD, ErmR | (7) |
| Strains | ||
| MC1000 | Wild-type reference for expression analysis | (35) |
| MG1655 | Wild-type for growth experiments | Lab stock |
| BK1032 | BOE270 with pCP41 plasmid | (7) |
| REF | MG1655 transformed with pAK80 | This study |
| NOX | MG1655 transformed with pAC06 | This study |
| ATPase | MG1655 transformed with pCP41::atpAGD | This study |
Media and Growth Conditions
Strains were maintained on LB agar plates with 200 μg/ml of erythromycin when required. Growth experiments were carried out in 500-ml baffled shakeflasks with a working volume of 100 ml at 37 °C in defined MOPS medium (14) supplemented with 0.1% glucose and 200 μg/ml erythromycin. The flasks were agitated at 150 rpm to ensure aerobic conditions. Optical density was measured at 600 nm on a Shimadzu UV mini 1240 spectrophotometer. Promoters of different strengths were selected based on the extent of blue coloration on X-gal plates and quantified by a subsequent assay for β-galactosidase activity, as described previously (12). From this promoter library, a clone showing a similar decrease in the growth rate as the pCP41::atpAGD was selected for all further studies. The cultivations for quantification of intracellular fluxes were performed under identical conditions as described above using a mixture of 20% (wt/wt) [U-13C]glucose (>99% pure, Martek Biosciences, Columbia, MD) and 80% naturally labeled glucose. Samples from different stages of exponential growth were filtered through 0.2-μm filters and analyzed by HPLC (Shimadzu, Kyoto, Japan) containing a Bio-Rad HPX-87H column (Phenomenex, Torrence, CA). The mobile phase consisted of 5 mm H2SO4 at a flow rate of 0.5 ml/min, and glucose, lactate, formate, and acetate were detected on the refractive index detector, RID-10A.
Sample Extraction and Processing
Biomass samples for RNA extraction were taken from mid-exponential growth phase. An aliquot of 25 ml was chilled on ice, centrifuged at 5000 × g at 4 °C and stored at −80 °C until subsequent analysis. Total RNA was purified using the RNeasy Mini kit (Qiagen, Carlsbad, CA) and quantified using a Thermo Scientific NanoDrop (NanoDrop products, Wilmington, DE). RNA quality was determined using an Agilent 2100 Bioanalyzer (Agilent, Santa Clara, CA). Gene expression was analyzed using the Affymetrix platform with Affymetrix E. coli genome 2.0 chips according to the manufacturer's specification.
Biomass samples for determining the fluxes were centrifuged (5000 × g, 10 min at 4 °C) and harvested in 150 μl of 6 m HCl and hydrolyzed at 105 °C for 24 h before drying at 85 °C. The hydrolyzate was dissolved in 50 μl of dimethyl formamide and derivatized using 30 μl of N-methyl-N-(tert-butyldimethylsilyl)-trifluoroacetamide. The mixture was incubated at 85 °C with shaking at 550 rpm for 60 min (Orbital Shaker CSA, Thermo Scientific) before GC-MS analysis, using previously described protocols (15, 16). From the mass isotope distribution patterns of the proteinogenic amino acids, relative pathway contributions (metabolic flux ratios) were computed that were used as constraints to infer metabolic activity (15, 16). An aliquot of 5 ml of the culture from mid-exponential phase was quenched in hot phenol (80 °C) and subsequently frozen at −20 °C for measuring the concentration of intracellular metabolites. The samples were processed as described previously (17) and analyzed using LC-MS/MS for quantitative determination of central carbon metabolites and cofactors. The values were normalized with biomass concentrations at the time of sampling.
Microarray Data Analysis
All the transcriptome data used in this study can be obtained in the form of CEL files from the NCBI Gene Expression Omnibus using the accession number GSE 20374. The raw data obtained in the form of the CEL files were subjected to preprocessing using median polish summarization. Background correction was performed using GCRMA (18), and the data were normalized by non-linear, quantile normalization using qspline (19). The data obtained after preliminary processing were assessed for good reproducibility. Genes with log fold-changes for the expression of NOX and ATPase, which differed by a factor of two, relative to REF, were considered significantly changed (increased or decreased). The p value of their significance was calculated using Student's t test. The biological role of the significantly altered gene expressions was determined by using the biological process semantics maintained by the Gene Ontology Consortium. A hypergeometric distribution was used to determine the significant biological processes in different sets of genes. We also used datasets available in public repositories to validate our observations. The context of the datasets and their accession numbers is presented in the S6 section of the supplemental text.
Integrated Data Analysis
The transcriptional regulatory network of E. coli was constructed using information from the RegulonDB database (20), which documents the known regulatory interactions between transcription factors (TFs) and sigma factors (SFs) with genes. The amount of regulation exerted by each TF or SF was quantified as a p value that was calculated as described (21). These algorithms take into account the significance of the expression of genes regulated by the different TFs and SFs. The regulators are scored after normalizing with the background (rest of the genes), and the probability that their influence is different from the background is calculated. Those TFs and SFs whose p value is less than 0.05 in either NOX or ATPase are considered in this study. To identify the most affected nodes in the metabolic network, we used the genome-scale metabolic network of E. coli (22) and overlaid the p values of the genes which encode for the enzymes that catalyze the different reactions in the model. Using a similar algorithm (23), metabolites around which significant transcriptional activity in their network neighborhood were identified. A protein interaction network of E. coli was constructed by combining data from high throughput TAP-tag pull-down experiments (24, 25) by computational curation (26, 27). A global interaction map in E. coli was constructed by overlaying the transcriptional regulatory network and the protein interaction network on the genome-scale metabolic network. This network resulted in 4936 cellular components with 18943 interactions, and is available in mark-up language format as a supplemental file. High-scoring networks (HSNs) within the global interaction map were identified using simulated annealing by invoking the jactivemodules algorithm (28) using the default parameters in a Cytoscape environment (29), which was also used for visualization.
RESULTS
We decreased the level of NADH or ATP in E. coli to dissect the regulatory effects of these cofactors on metabolism. We used water-forming NADH oxidase and the soluble F1-ATPase to effect the perturbation. The net reactions mediated by these enzymes are given in Reaction 1.
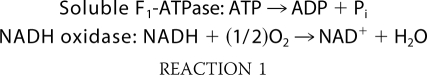 |
This strategy is expected to invoke an unbiased response, in contrast to deleting or overexpressing metabolic pathways directly involved in cofactor utilization, which may result in localized changes in fluxes surrounding the reaction. The strains of E. coli in which the heterologous genes are expressed are referred to as ATPase or NOX for convenience.
Physiological Response to Cofactor Perturbations
The physiological changes we observed in response to overexpressing NADH oxidase or the soluble ATPase appeared to be geared to restoring the redox or energy balance, respectively. The dominant phenotype that was common to NOX and ATPase strains was increased glucose uptake by 27 and 70%, respectively (Table 2). The specific growth rate decreased in NOX and ATPase strains by 10 and 20%, respectively. The biomass yield also decreased substantially in the NOX strain (33%) and ATPase (49%) strains relative to the reference strain (see section S1 in supplemental text for growth profiles). This interesting behavior of consuming glucose faster, but channeling it away from biomass was shared by both NOX and ATPase strains. Acetate production rate increased 3-fold in ATPase, relative to the reference strain, whereas it decreased by 40% in NOX compared with the reference strain (Table 2).
TABLE 2.
Growth and physiological parameters of the three strains used in this study
| Strain | μa | YSXb | rSc | rAd |
|---|---|---|---|---|
| REF | 0.72 ± 0.01 | 0.43 ± 0.02 | 9.2 ± 0.11 | 5.52 ± 0.86 |
| NOX | 0.65 ± 0.02 | 0.29 ± 0.03 | 11.7 ± 0.21 | 3.28 ± 0.33 |
| ATPase | 0.58 ± 0.01 | 0.22 ± 0.00 | 15.6 ± 0.19 | 16.69 ± 1.01 |
a Maximum specific growth rate (h−1).
b Biomass yield from glucose (g dry cell weight/g glucose).
c Specific glucose uptake rate (mmol/g dry cell weight (DCW) h).
d Specific acetate production rate (mmol/d DCW h).
Metabolic Flux Redistribution
To elucidate the impact of decreasing NADH or ATP level, we obtained flux distribution in the central carbon metabolism in the reference, NOX and ATPase strains. We normalized the fluxes to the specific rate of glucose uptake and present relative flux values (Fig. 1). The values of absolute and relative fluxes are provided in section S2 in the supplemental text.
FIGURE 1.

Metabolic flux redistribution in the central carbon metabolism of E. coli in REF (black), NOX in which NADH oxidase was overexpressed (blue) and ATPase in which the native soluble ATPase was overexpressed (red). The absolute fluxes were calculated from the labeling patterns using [13C]glucose as the carbon source. These values were normalized with the glucose uptake rate for the corresponding strain. The absolute values of the glucose uptake rate are shown next to the glucose flux. Also shown is the relative flux in the transhydrogenase reaction. The drain from precursor metabolites to biomass is indicated in gray dotted lines.
Increased glucose uptake in the mutant strains resulted in a higher flux in the glycolytic pathway. This phenotype is more prominent in ATPase strain (30%) than in NOX (12%). Concomitantly the relative flux in the pentose phosphate pathway decreased. Faster operation of glycolysis triggered related changes in the entire central carbon metabolism, which manifested in flux redistribution around key branch points, such as PEP (phosphoenolpyruvate) and pyruvate. The anaplerotic flux via PEP carboxylase decreased by 21% only in the NOX strain, whereas it remained unaffected in the ATPase strain. Interestingly, the relative flux in the reverse reaction, catalyzed by PEP carboxykinase, increased in the ATPase strain by 40%, but decreased by 27% in the NOX strain (Fig. 1). At the pyruvate branch point, the relative flux of the pyruvate dehydrogenase reaction (from pyruvate to acetyl-CoA) increased by 45% in the ATPase strain while it remained relatively unchanged in the NOX strain. Consistent with the physiological results, 72% of this flux was channeled into acetate overflow in the ATPase strain. Acetate overflow decreased by 53% in the NOX strain while it increased by 78% in the ATPase strain. Interestingly, we detected a small amount of anaplerotic flux via malic enzyme (from malate to pyruvate) only in the NOX strain, while it was absent in the reference and ATPase strains. In comparison to REF, the relative TCA cycle flux increased by 78% in NOX while it increased only 21% in ATPase. Higher glycolytic flux (relative to REF) was transmitted to the TCA cycle only in NOX, whereas it was excreted as acetate in ATPase. The perturbations to reduce the level of NADH and ATP also resulted in a remarkable increase in the transhydrogenase flux, to produce NADH from NADPH. In comparison with REF, the relative transhydrogenase flux increased over 6-fold in NOX and over 5-fold in ATPase (Fig. 1).
The nature of the analysis technique also allows quantifying the origin of key metabolic intermediates such as PEP and pyruvate under the conditions studied. Based on the measurements, we calculated that about 22% of PEP in REF originated from oxaloacetate (OAA) via the PEP carboxykinase. In NOX, only 18% of PEP originated from OAA, but in ATPase, 33% of PEP originated from OAA. The remainder of PEP is derived from pentoses. This result is coherent with the decrease in the pentose phosphate flux in ATPase. We also observed substantial changes in the origin of OAA from PEP via the reverse reaction, PEP carboxylase. Relative to the REF, NOX produced 35% less OAA from PEP whereas ATPase produced 15% less (Fig. 2). The higher glycolytic flux in NOX and ATPase translated into a higher contribution to the production of serine by 9% in NOX and by 24% in ATPase, compared with REF. Information on the origin of metabolic intermediates indicates the degree of utilization of the different pathways, and provides critical insight into regulation prevalent at the flux level. Detailed information on the drain of precursors to biomass is shown in section S2 in the supplemental text.
FIGURE 2.

Origin of metabolic intermediates as calculated from the isotopomer labeling patterns for NOX (solid circles) and ATPase (open squares) strains as compared those for REF (on the X-axis).
Response of the Central Carbon Metabolites
We measured the intracellular concentration of the central carbon metabolites and cofactors under identical conditions at which metabolic fluxes were measured. Principal component analysis separated NOX and ATPase strains from REF (see section S3 in supplemental text). The first principal component (PC1) accounted for 79% of the variance, whereas PC2 accounted for 11% of the variance. PC1 distinctly separated NOX and ATPase from REF. Given the high amount of variance that PC1 accounts for, the result indicates that the levels of the central carbon intermediates are in NOX and ATPase significantly different from that in REF. PC2 separated the strains in opposing directions from REF.
The concentration of the glycolytic metabolites and TCA cycle intermediates was higher in ATPase than in NOX. A notable exception was in the concentration of glyceraldehyde-3-phosphate (GAP), which was present at a higher concentration in NOX. The concentration of the pentose phosphates was lower in ATPase and NOX, compared with REF. The key metabolites at the divergence of metabolism from glucose oxidation to fermentation of glucose, pyruvate (PYR), and acetyl-CoA were substantially higher in ATPase than in NOX (supplemental text S3).
The concentration of NAD+ doubled upon overexpressing NADH oxidase, whereas it remained unaffected in ATPase. The concentration of NADH decreased by a factor of 7 in NOX, relative to REF, while it remained unchanged in ATPase. Overexpressing the soluble ATPase had a more moderate effect on the concentration of ATP, which decreased by a factor of 1.7. Interestingly, the concentration of ATP increased by 20% in NOX. The concentration of ADP remained unchanged in NOX, while it increased by a factor of 1.7 in ATPase. Whereas we did not observe any change in the concentration of AMP in NOX, its concentration doubled in ATPase in comparison with REF. The level of NADPH increased more in NOX than in ATPase. Its oxidized counterpart, NADP, increased only marginally in NOX and even decreased slightly in ATPase. These changes are reflected in the relative levels of redox and energy couples (Fig. 3). The NADH/NAD+ redox ratio decreased in NOX, while remained unaffected in ATPase. On the other hand, the NADPH/NADP redox ratio increased remarkably in NOX. The ATP/ADP energy ratio decreased in ATPase, but increased in NOX in comparison with REF.
FIGURE 3.

The ratio of the redox (NADH/NAD+ and NADPH/NADP) and energy (ATP/ADP) couples as calculated from the metabolite data for REF (black), NOX (blue), and ATPase (red). The complete metabolite data is shown in section S3 of supplemental text.
Regulation at the Transcriptional Level
We quantified the expression of all the genes during midexponential growth of the REF, ATPase, and NOX strains. The analysis revealed that 293 genes were induced in ATPase strain and 217 were induced in the NOX strain, relative to the REF strain, of which 168 were common to both the strains. The genes that were commonly induced in the two strains were involved in maintaining general energy and redox homeostasis and played a key role in hexose metabolism, cellular respiration, and electron transport, acetyl-CoA metabolism, and the TCA cycle. The transport of metal ions, enterobactin metabolism, and ATP synthesis-coupled electron transport were induced only in ATPase (see the complete list in section S4 in supplemental text). On the other hand, genes responsible for the generation of energy from fatty acids and lipids (fatty oxidation), ATP biosynthesis and the non-oxidative branch of the pentose phosphate pathway were induced only in NOX. We observed that substantially fewer genes were repressed in ATPase and NOX strains. Only 60 genes were significantly repressed in ATPase and 70 in NOX, with an overlap of only 18 genes. Key genes in the biosynthesis of macromolecules (lipid, protein, and nucleotide) were repressed only in the ATPase strain while those in mitotic cell cycle and division, oxidative stress, and the generation of NADPH in the oxidative branch of the pentose phosphate pathway were repressed only in the NOX strain. Cellular processes related to translation and protein synthesis were commonly repressed in ATPase and NOX strains.
The genes whose expression was significantly different in the mutant strains were mapped to the transcription factors and sigma factors that control them. The network topology allowed the quantification of the transcriptional regulation exerted by the regulators on the corresponding genes. Many of the transcriptional changes observed were brought about by global TFs such as ArcA, FNR, CRP, IHF, pdhR and fur in ATPase and NOX (Fig. 4). These TFs regulate central biological processes such as respiration, catabolite repression, DNA replication, acetyl-CoA metabolism etc, indicating that these processes are commonly affected in both ATPase and NOX. Furthermore, we also identified regulators that played a significant role in only one strain whereas remaining relatively unaffected in the other. Unlike the global TFs, these regulators had a narrower realm of influence, thereby revealing the differences in regulation between the two strains at a higher resolution. Some key examples of such TFs include fadR, gadEWX, fis, kdpE, ompR, and envY, which were identified to be significant only in NOX (Fig. 4). These TFs control specific biological processes such as fatty acid oxidation, pH homeostasis, DNA gyrase activity, potassium efflux, membrane integrity, etc. On the other hand, TFs such as pspF, fhlA, hyfR, nsrR, and hcaB were dominant only in the ATPase strain (see section S5 in the supplemental text). These TFs are involved in the regulation of phage shock, proton translocation mechanisms mediated by formate hydrogenase system and organic acid production. The sigma factors, σS (rpoS) and σ54 (rpoN) were also identified to play an important role in bringing out the transcriptional response in NOX and ATPase, respectively.
FIGURE 4.

Significance of transcription (or sigma) factor activity in NOX and ATPase relative to REF as calculated from gene expression measurements. The significance of the TFs in ATPase relative to REF is shown against the significance of TFs in NOX relative to REF. The size of the data points is proportional to the number of genes each TF or SF is known to regulate, as documented in RegulonDB database and is shown in the legend. A selected few TFs are indicated.
To validate our correlation of the TFs to the specific cofactors, we overlaid the transcription response from mutants in which some of these TFs were deleted on to the metabolic network (23). Using transcription data from arcAΔ, fnrΔ or arcAΔ fnrΔ mutants, this converse approach identified that NADH and ATP consistently ranked among the top metabolites around which, the enzymes were subjected to significant (p < 0.03) transcriptional changes, compared with an isogenic reference. The only except was the rpoSΔ mutant. Gene expression indicated that only NADH (and not ATP) appeared to be the surrounded by enzymes whose genes significantly changed. This result is in complete concurrence with our discovery that σS (RpoS)-mediated regulation was predominantly sensitive to NADH. The list of metabolites identified by our analysis for all the mutants is shown in section S6 of the supplemental text.
Transcriptionally Significant Metabolic Modules
A global interaction map was used to extract significantly changed metabolic modules, i.e. subnetworks of cellular components (metabolites, reactions, and genes), which were most affected by the overexpression of the soluble ATPase or NADH oxidase. Overexpressing NADH oxidase had a more widespread impact on metabolism, as indicated by the larger size of the HSN in NOX (526 nodes with 1091 interactions between them). The HSN in ATPase was much smaller (264 nodes with 631 interactions between them), but had a higher density. The clustering coefficient, which indicates the extent to which the nodes cluster together, was double for the HSN in ATPase (0.262) than that in NOX (0.135). The HSNs in ATPase and NOX are provided as markup files in the supplemental material. The top scoring metabolites in the HSN of NOX are the redox couples - NAD(H), FAD(H), quinones, TCA cycle intermediates, and acetyl-CoA. The reactions involving these metabolites were identified to be transcriptionally significant in the NOX network. The reactions predominantly involved the conversion of cofactors (such as dehydrogenases in the central carbon metabolism and fatty acid oxidation) and transporters of potassium and ammonia (see section S7 in the supplemental text). The HSN of ATPase was denser and specifically involved the quinones, succinate, fumarate, oxygen, and the proton as the top scoring metabolites.
Further inspection of the HSN of NOX and ATPase indicated that proton translocation in the electron transport chain was significantly affected only in the ATPase strain (Fig. 5). Non-proton translocating NADH dehydrogenase and the TCA cycle were significantly affected only in NOX strain. Although the transhydrogenase reaction was significantly different in both NOX and ATPase, but we did not see significant changes in the gene expression (pntAB or udhA). A complete list of the significant changes is provided in supplemental material S7.
FIGURE 5.

Schematic illustration of the construction of the global interaction network in E. coli by overlaying the transcriptional regulation and protein interaction networks over genome-scale metabolic model. The HSN in NOX and ATPase within the meta-network was identified using simulated annealing, which requires a p value for each node (gene, reaction, or metabolite) as the input. The HSN for NOX and ATPase can be visualized in Cytoscape using the files provided as supplemental text. The TCA cycle and portions of the electron transport chain are magnified from the HSNs. The interactions by regulators (transcription factors and sigma factors) and metabolites were removed from the magnified part of the figure, for clarity. Only physical interactions between proteins are retained. The genes (proteins) are shown in circles, and the reactions are shown in rectangles. The magnified portion is also shown in section S7 of supplemental text.
DISCUSSION
NADH and ATP effect the conversion of metabolic reactions where the products and the reactants are not balanced in terms of redox and/or energy. Because this is often the case in metabolic networks, these cofactors rank among the most highly connected metabolites in many microbial networks. Previous studies along these lines were restricted to either a single enzyme or a regulator or analyzing information from only one level of hierarchy (transcription of metabolic flux, etc). Clearly, these proteins cannot be studied in isolation nor can only one level of information comprehensively identify regulation (1). The widespread role of NADH and ATP in metabolism and cellular processes calls for a true integrative systems biology approach toward this goal.
Regulation of Metabolism by NADH and ATP
Increased glycolytic flux in ATPase or NOX raises the question of the exact control mechanism. Arguably, this is the most well studied pathway in metabolism and cellular ATP demand was shown to control glycolytic flux (7). We observed increased glycolytic flux upon lowering NADH also. It remains to be seen whether ATP and NADH share the control of glycolysis or the net outcome of the glycolytic flux is a ramification of decreased NADH lowering ATP production in the oxidative phosphorylation.
Increased glycolysis translated into increased flux in the TCA cycle in NOX and ATPase strains. When the NADH concentration decreased, the genes of the TCA cycle were induced, ensuing in increased flux. On the other hand, lowering ATP level induced only citrate synthase and succinate dehydrogenase genes. Yet the TCA cycle flux increased by a factor of 60% relative to that in REF. Thus, it can be inferred that the TCA cycle is predominantly regulated at the transcriptional level by TFs such as ArcA and also allosterically inhibited by ATP. Indeed, deleting ArcA, resulted in over 60% increase in the TCA cycle flux (9).The flux in the pentose phosphate pathway decreased in NOX and ATPase strains and did not appear to be actively regulated by cofactor availability.
Beyond the central carbon metabolism, NADH and ATP appear to work independently, and sometimes antagonistically, in regulating many other peripheral pathways. For example, decreasing ATP repressed the biosynthesis of proteins, lipids, and nucleotides and increased acetate overflow. Decreasing NADH induced the synthesis of lipids and amino acids and decreased acetate overflow. Information from S5–S7 of the supplemental text is summarized in Fig. 6, which shows the impact of NADH and ATP in various cellular processes.
FIGURE 6.

Reconciliation of the regulatory role that NADH and ATP have on different aspects of metabolism. The regulation map was constructed based on the integrated analysis of the global interaction map, taking into account the differences in physiology, transcriptional profile, and metabolite measurements between NOX and ATPase. The map is depicted in such a way that an elevated level of NADH or ATP would activate (green lines) or repress (red lines) different aspects of metabolism.
Insights from Integrated Analysis
Perturbation in NADH level affects larger number of reactions that a perturbation in ATP level, as indicated by the size of the HSN for NOX and ATPase, respectively. A denser network (higher clustering coefficient) for ATPase indicates higher degree of transcriptional and enzymatic regulation. This translates into increased robustness against perturbations in ATP level. On the other hand, it appears that E. coli uses NADH to control various reactions via allosteric inhibition and/or activation of relevant TFs. Upon decreasing NADH level, E. coli maintained redox homeostasis by activating those reactions that produce NADH. Decreasing the level of ATP, on the other hand, invoked proton translocation mechanisms via the respiratory chain as well as in ion efflux. Global gene expression analysis revealed distinct hierarchical organization of transcriptional response in ATPase and NOX. Global transcription factors such as ArcA, Fnr, IHF, Fur, and CRP respond to both NADH and ATP. This was confirmed by analyzing transcription data of arcAΔ or fnrΔ or arcAΔ fnrΔ strains, which indicated significant transcriptional activity of the enzymes surrounding NADH and ATP, lending strong credibility to our observations. Although we present only an indirect evidence for the dependence of IHF, Fnr and CRP on cofactor levels, the high confidence with which these TFs were identified from the integrated analysis (indicated by the low p values) warrants further investigation. One possible mechanism could be that these cofactors could serve a role in signaling mechanism. Given that the redox state of the cell is the signal for the ArcA system (30) and that we identified quinones, FADH and NADH as the principal metabolites around which significant transcriptional activity occurred, this is not a far-fetched possibility.
The second tier of transcriptional control was cofactor dependent. For example, TFs such as fadR, gadE, and kdpE and σS had significant control only upon decreasing the level of NADH. On the contrary, pspF, fhlA, narP, and σN were active only when ATP level decreased. In general, the hierarchical regulatory structure imparts efficiency in the control of metabolism by a global response that is shared by NADH and ATP and a local response that is more dependent on only one of the cofactors.
Acetate production is believed to be a consequence of an imbalance between NADH production and its oxidation (31). Decreasing NADH appears to couple glycolysis with the TCA cycle, as indicated by lower acetate overflow. On contrary, acetate overflow increased in ATPase to meet the ATP demand. Interestingly, although proton translocation was induced in ATPase, it appears that E. coli prefers the acetate pathway for ATP homeostasis.
The strong increase in NADPH/NADP ratio in the NOX strain suggests a role for this cofactor in redox homeostasis. Decreased anabolic demand for NADPH coupled with increased flux of isocitrate dehydrogenase increased the ratio in the two strains. Furthermore, the induction (by 2.3-fold compared with REF) of NADH kinase (yfjB) only in NOX translated into the remarkable increase in the NADPH/NADP ratio. Because NADH kinase converts NADH to NADPH at the expense of ATP, this reaction was presumably inactive in ATPase, where ATP is already in great demand. The increased pool of NADPH is then converted to NADH by the transhydrogenase. The induction of udhA (soluble transhydrogenase) in NOX and ATPase strains conveyed an important role of the soluble transhydrogenase is to maintain NADH homeostasis. Indeed, our analysis adds to the growing body of evidence (32) UdhA transhydrogenase is activated during metabolic conditions that have excess NADPH.
Implications for Metabolic Engineering
The recent progress in biotechnology did not translate into success stories in metabolic engineering because it is only now that we are able to understand the complexity of regulation. In addition to facilitating quantitative modeling, the multilevel data presented in this study will also have direct applications in metabolic engineering. The practice of metabolic engineering is moving toward engineering regulatory control (1) where hierarchical organization of global and local TFs provide a framework for the selection of appropriate targets for metabolic engineering. Recent example included the deletion of ArcA to reduce acetate overflow for recombinant protein production (33). Similarly, TFs could be deleted in appropriate combination to elicit only the desired response with minimal side effects. Our results pointed out that isocitrate dehydrogenase is a more potent producer of NADPH than the pentose phosphate pathway. Therefore, this route might be a more efficient means to increase NADPH availability. This is particularly useful in engineering metabolism of pentose sugars (34) or production of heterologous proteins or fatty acids, etc. where NADPH demand is increased.
The data sets provided in this study also open the door to understanding connections between regulatory networks, metabolic flux networks and possibly governing physicochemical states like the redox potential or the cellular energy load. Future metabolic engineering efforts for designing microbial cell factories need to take these network connectivities into account to systematically optimize cellular systems.
Supplementary Material
Acknowledgments
We thank Lene Christiansen for assistance with the arrays and Bianca Klein for assistance with obtaining the data for the metabolites and cofactors.

The on-line version of this article (available at http://www.jbc.org) contains supplemental text sections S1–S7.
- TCA
- tricarboxylic acid
- MOPS
- 4-morpholinepropanesulfonic acid
- TF
- transcription factor
- SF
- sigma factor
- HSN
- high scoring subnetwork
- PEP
- phosphoenolpyruvate
- OAA
- oxaloacetate.
REFERENCES
- 1.Vemuri G. N., Aristidou A. A. (2005) Microbiol. Mol. Biol. Rev. 69, 197–216 [DOI] [PMC free article] [PubMed] [Google Scholar]
- 2.Neidhardt F. C., Ingraham J. L., Schaechter M. (1990) Physiology of the Bacterial Cell: A Molecular Approach, Sinauer Associates, Sunderland, MA [Google Scholar]
- 3.Fuhrer T., Sauer U. (2009) J. Bacteriol. 191, 2112–2121 [DOI] [PMC free article] [PubMed] [Google Scholar]
- 4.Berríos-Rivera S. J., Bennett G. N., San K. Y. (2002) Metab. Eng. 4, 217–229 [DOI] [PubMed] [Google Scholar]
- 5.Berríos-Rivera S. J., Bennett G. N., San K. Y. (2002) Metab. Eng. 4, 230–237 [DOI] [PubMed] [Google Scholar]
- 6.Vemuri G. N., Altman E., Sangurdekar D. P., Khodursky A. B., Eiteman M. A. (2006) Appl. Environ. Microbiol. 72, 3653–3661 [DOI] [PMC free article] [PubMed] [Google Scholar]
- 7.Koebmann B. J., Westerhoff H. V., Snoep J. L., Nilsson D., Jensen P. R. (2002) J. Bacteriol. 184, 3909–3916 [DOI] [PMC free article] [PubMed] [Google Scholar]
- 8.Hengge R. (2008) Adv. Exp. Med. Biol. 631, 40–53 [DOI] [PubMed] [Google Scholar]
- 9.Perrenoud A., Sauer U. (2005) J. Bacteriol. 187, 3171–3179 [DOI] [PMC free article] [PubMed] [Google Scholar]
- 10.Hammer K., Mijakovic I., Jensen P. R. (2006) Trends Biotechnol. 24, 53–55 [DOI] [PubMed] [Google Scholar]
- 11.Jensen P. R., Hammer K. (1998) Appl. Environ. Microbiol. 64, 82–87 [DOI] [PMC free article] [PubMed] [Google Scholar]
- 12.Solem C., Jensen P. R. (2002) Appl. Environ. Microbiol. 68, 2397–2403 [DOI] [PMC free article] [PubMed] [Google Scholar]
- 13.Israelsen H., Madsen S. M., Vrang A., Hansen E. B., Johansen E. (1995) Appl. Environ. Microbiol. 61, 2540–2547 [DOI] [PMC free article] [PubMed] [Google Scholar]
- 14.Neidhardt F. C., Bloch P. L., Smith D. F. (1974) J. Bacteriol. 119, 736–747 [DOI] [PMC free article] [PubMed] [Google Scholar]
- 15.Fischer E., Sauer U. (2003) Eur. J. Biochem. 270, 880–891 [DOI] [PubMed] [Google Scholar]
- 16.Fischer E., Zamboni N., Sauer U. (2004) Anal. Biochem. 325, 308–316 [DOI] [PubMed] [Google Scholar]
- 17.Luo B., Groenke K., Takors R., Wandrey C., Oldiges M. (2007) J. Chromatogr. A. 1147, 153–164 [DOI] [PubMed] [Google Scholar]
- 18.Wu Z., Irizarry R. A. (2005) J. Comput. Biol. 12, 882–893 [DOI] [PubMed] [Google Scholar]
- 19.Workman C., Jensen L. J., Jarmer H., Berka R., Gautier L., Nielser H. B., Saxild H. H., Nielsen C., Brunak S., Knudsen S. (2002) Genome Biol. 3, 0048 [DOI] [PMC free article] [PubMed] [Google Scholar]
- 20.Gama-Castro S., Jiménez-Jacinto V., Peralta-Gil M., Santos-Zavaleta A., Peñaloza-Spinola M. I., Contreras-Moreira B., Segura-Salazar J., Muñiz-Rascado L., Martínez-Flores I., Salgado H., Bonavides-Martinez C., Abreu-Goodger C., Rodriguez-Penagos C., Miranda-Ríos J., Morett E., Merino E., Huerta A. M., Treviño-Quintanilla L., Collado-Vides J. (2008) Nucleic Acids Res. 36, D120–D124 [DOI] [PMC free article] [PubMed] [Google Scholar]
- 21.Oliveira A. P., Patil K. R., Nielsen J. (2008) BMC Syst. Biol. 2, 17. [DOI] [PMC free article] [PubMed] [Google Scholar]
- 22.Reed J. L., Vo T. D., Schilling C. H., Palsson B. O. (2003) Genome Biol. 4, R54. [DOI] [PMC free article] [PubMed] [Google Scholar]
- 23.Patil K. R., Nielsen J. (2005) Proc. Natl. Acad. Sci. U.S.A. 102, 2685–2689 [DOI] [PMC free article] [PubMed] [Google Scholar]
- 24.Hu P., Janga S. C., Babu M., Díaz-Mejía J. J., Butland G., Yang W., Pogoutse O., Guo X., Phanse S., Wong P., Chandran S., Christopoulos C., Nazarians-Armavil A., Nasseri N. K., Musso G., Ali M., Nazemof N., Eroukova V., Golshani A., Paccanaro A., Greenblatt J. F., Moreno-Hagelsieb G., Emili A. (2009) PLoS Biol. 7, e96. [DOI] [PMC free article] [PubMed] [Google Scholar]
- 25.Arifuzzaman M., Maeda M., Itoh A., Nishikata K., Takita C., Saito R., Ara T., Nakahigashi K., Huang H. C., Hirai A., Tsuzuki K., Nakamura S., Altaf-Ul-Amin M., Oshima T., Baba T., Yamamoto N., Kawamura T., Ioka-Nakamichi T., Kitagawa M., Tomita M., Kanaya S., Wada C., Mori H. (2006) Genome Res. 16, 686–691 [DOI] [PMC free article] [PubMed] [Google Scholar]
- 26.Butland G., Peregrín-Alvarez J. M., Li J., Yang W., Yang X., Canadien V., Starostine A., Richards D., Beattie B., Krogan N., Davey M., Parkinson J., Greenblatt J., Emili A. (2005) Nature 433, 531–537 [DOI] [PubMed] [Google Scholar]
- 27.Peregrín-Alvarez J. M., Xiong X., Su C., Parkinson J. (2009) PLoS Comput. Biol. 5, e1000523. [DOI] [PMC free article] [PubMed] [Google Scholar]
- 28.Ideker T., Ozier O., Schwikowski B., Siegel A. F. (2002) Bioinformatics 18, Suppl. 1, S233–S240 [DOI] [PubMed] [Google Scholar]
- 29.Killcoyne S., Carter G. W., Smith J., Boyle J. (2009) Methods Mol. Biol. 563, 219–239 [DOI] [PubMed] [Google Scholar]
- 30.Georgellis D., Kwon O., Lin E. C. (2001) Science 292, 2314–2316 [DOI] [PubMed] [Google Scholar]
- 31.Eiteman M. A., Altman E. (2006) Trends Biotechnol. 24, 530–536 [DOI] [PubMed] [Google Scholar]
- 32.Sauer U., Canonaco F., Heri S., Perrenoud A., Fischer E. (2004) J. Biol. Chem. 279, 6613–6619 [DOI] [PubMed] [Google Scholar]
- 33.Vemuri G. N., Eiteman M. A., Altman E. (2006) Biotechnol. Bioeng. 94, 538–542 [DOI] [PubMed] [Google Scholar]
- 34.Akinterinwa O., Khankal R., Cirino P. C. (2008) Curr. Opin. Biotechnol. 19, 461–467 [DOI] [PubMed] [Google Scholar]
- 35.Casadaban M. J., Cohen S. N. (1980) J. Mol. Biol. 138, 179–207 [DOI] [PubMed] [Google Scholar]
Associated Data
This section collects any data citations, data availability statements, or supplementary materials included in this article.