Abstract
TrwB is a DNA-dependent ATPase involved in DNA transport during bacterial conjugation. The protein presents structural similarity to hexameric molecular motors such as F1-ATPase, FtsK, or ring helicases, suggesting that TrwB also operates as a motor, using energy released from ATP hydrolysis to pump single-stranded DNA through its central channel. In this work, we have carried out an extensive analysis with various DNA substrates to determine the preferred substrate for TrwB. Oligonucleotides with G-rich sequences forming G4 DNA structures were the optimal substrates for TrwB ATPase activity. The protein bound with 100-fold higher affinity to G4 DNA than to single-stranded DNA of the same sequence. Moreover, TrwB formed oligomeric protein complexes only with oligonucleotides presenting such a G-quadruplex DNA structure, consistent with stoichiometry of six TrwB monomers to G4 DNA, as demonstrated by gel filtration chromatography and analytical ultracentrifugation experiments. A protein-DNA complex was also formed with unstructured oligonucleotides, but the molecular mass corresponded to one monomer protein bound to one oligonucleotide molecule. Sequences capable of forming G-quadruplex structures are widespread through genomes and are thought to play a biological function in transcriptional regulation. They form stable structures that can obstruct DNA replication, requiring the action of specific helicases to resolve them. Nevertheless, TrwB displayed no G4 DNA unwinding activity. These observations are discussed in terms of a possible role for TrwB in recognizing G-quadruplex structures as loading sites on the DNA.
Keywords: ATPases, Bacterial Genetics, DNA-binding Protein, DNA Helicase, Molecular Motors, G-quadruplex DNA, TrwB, Bacterial Conjugation
Introduction
Bacterial plasmids are key players in bacterial evolution. Not only do they participate in the slow processes of speciation that shape bacterial genomes, but they also mediate the much more rapid and medically important processes of dissemination of antibiotic resistance and bacterial virulence (1). Among the three classical mechanisms of horizontal gene transfer (conjugation, transformation, and transduction), conjugation is undoubtedly the most salient, at least in many human pathogens, from Gram-negative Enterobacteriaceae and Pseudomonas to Gram-positive Enterococcus, to cite just three examples. Bacterial conjugative systems contain an essential integral membrane protein called the Type IV coupling protein (T4CP). This protein is involved in DNA transport, coupling the relaxosome (a DNA-protein complex) to the secretion channel (a multiprotein complex that spans the inner and outer membranes of the donor cell) (2, 3). TrwB, the T4CP of conjugative plasmid R388, is a DNA-dependent ATPase (4). It is a member of the FtsK/SpoIII family of DNA translocases (5, 6). The crystallographic structure of TrwBΔN70, the cytoplasmic domain of TrwB, reveals a hexamer with a six-fold symmetry and a central channel of about 20 Å in diameter (7). The structural similarity between TrwB and well known molecular motors, such as F1-ATPase (8) or T7 gene 4 helicase (9), suggests that TrwB also operates as a motor, using energy released from ATP hydrolysis to pump DNA through its central channel (10). Recent biochemical data indicated that TrwB ATPase activity can be activated by DNA and/or by protein TrwA, a tetrameric protein that binds specifically at the origin of transfer of the plasmid (oriT) and facilitates TrwB assembly on DNA (11). The TrwA-TrwB system resembles other DNA-dependent molecular motors, such as the RuvA-RuvB recombination system, that target specific DNA structures for assembly as hexamers to pump DNA (12).
TrwBΔN70 ATPase activity is stimulated by both ssDNA3 and dsDNA (11). Although ATPase rates in the presence of dsDNA are comparable with ssDNA in vitro, the in vivo role for TrwB acting on dsDNA remains unclear because it is generally accepted that ssDNA is the translocated substrate during conjugation (13, 14). In an attempt to clarify the DNA substrate preference of TrwB and check the dependence of its ATPase activity on a particular DNA topology, we extended the analysis to oligonucleotides of different lengths, sequences, and conformations. This work indicated a preference for oligonucleotides with G-rich sequences and led us to explore the function of TrwB on G4 DNA in detail.
G4 DNA is a DNA secondary structure formed by the pairing of four guanines in a planar array and stabilized through Hoogsteen bonds (for a review, see Ref. 15). G-quadruplex structural motifs are widespread in genomes and might be control elements in transcription, DNA replication, and other areas of DNA metabolism (16). In these cases, G-DNA has to be dissociated by specific helicases. An example of this group of helicases is the RecQ helicase family (for a review, see Ref. 17). Members of this family have been found in organisms ranging from prokaryotes to mammals (RecQ in bacteria (18), Sgs1 in yeast (19), or BLM and WRN helicases in humans, responsible for Bloom and Werner syndromes, respectively (20)). The function of these helicases is to unwind preferentially non-canonical DNA structures, such as Holliday junctions or G-quadruplex DNA. They maintain chromosome stability by resolving specific DNA structures that would otherwise impede the correct transmission of genetic information.
In this work, we have found that G4 DNA stimulates ATPase activity of TrwBΔN70 and that the protein binds G4 DNA structures with higher affinity than ssDNA of the same sequence. Moreover, TrwBΔN70 only forms hexamers, the active oligomeric state of the protein, with G4 DNA. Our findings suggest a possible role of TrwB in dealing with high order DNA structures. The protein could either recognize a guanine-rich region of the plasmid to start DNA processing or, alternatively, it could be involved in resolving G4 secondary structures that arise during conjugative processing, a required step to assure the correct transfer of the plasmid.
EXPERIMENTAL PROCEDURES
Cloning and Protein Purification
Purification of protein TrwBΔN70 was carried out as described previously (4). Protein samples were stored at −80 °C in buffer 50 mm Pipes-NaOH, pH 6.2, 100 mm NaCl, 0.1 mm EDTA, 10% glycerol, and 0.001% PMSF. Protein concentrations were determined by the method of the BCATM protein assay kit (Pierce).
PCR-amplified recQ from Escherichia coli K-12 MG1655 was cloned into pET14b, creating pEB530, via NdeI and BamHI sites that were contained within PCR primers: recQ1, 5′-GGAATTCCATATGAATGTGGCGCAGGC, and recQ2, 5′-CGGGATCCCTACTCTTCGTCATCGCC. In each primer sequence, the restriction sites are underlined. N-terminal hexahistidine-tagged RecQ was expressed as a soluble protein from pEB530 in strain BL21 AI grown in ampicillin containing LB broth at 37 °C with induction by isopropyl-1-thio-β-d-galactopyranoside (0.5 mm) and arabinose (0.2%) at an optical density of 0.5 for 2 h. Spun down cells were resuspended in 20 mm Tris-HCl, pH 7.5, containing 5 mm imidazole and 400 mm NaCl. This biomass was flash-frozen and thawed prior to sonication and centrifugation (20 krpm, 30 min) to obtain soluble RecQ protein, which was then passed into a precharged nickel His-Gravitrap column (GE Healthcare) under gravity. RecQ eluted from the column in 200 mm imidazole and was pure to about 90% homogeneity. RecQ protein was dialyzed into an alternative buffer for storage at −80 °C: 20 mm Tris-HCl, pH 7.5, containing 40% glycerol, 5 mm dithiothreitol, 250 mm NaCl, and 0.5 mm EDTA. The concentration of RecQ (60.7 μm)) was calculated from assay with Bradford's reagent against bovine serum albumin calibration curve.
Preparation of DNA Substrates
Oligonucleotides were from Sigma-Aldrich. To prepare G4 DNA, the 45-mer oligonucleotide B (300 μm) was incubated overnight at 60 °C in buffer (50 mm Pipes, pH 6.2, 50 mm NaCl, 5% glycerol and 100 mm sodium acetate). Then, the mixture was incubated at 37 °C for 1 day and cooled down at room temperature for 2 h. Formation of the G-quadruplex was confirmed by gel filtration chromatography and analytical ultracentrifugation. To prepare a forked DNA, 45-mer oligonucleotides E and F (85 μm each) were incubated at 95 °C for 3 min in buffer (50 mm Pipes, pH 6.2, 50 mm NaCl, and 5% glycerol). Then, the mixture was cooled down at room temperature for 2 h. The same protocol was followed to prepare the duplex DNA substrate except that, in this case, oligonucleotides A and G were used. Formation of both substrates was confirmed by gel filtration chromatography.
The DNA substrates prepared above were 5′-radiolabeled with [γ-32P]ATP by T4 polynucleotide kinase according to the manufacturer's instructions (Fermentas) except that the G4 DNA sample contained 150 mm Na+ to stabilize the secondary structure. After labeling for 30 min at 37 °C, unincorporated nucleotides were removed by Micro Bio-SpinTM 6 chromatography columns (Bio-Rad).
Nucleotide Hydrolysis Assays
ATP hydrolysis was analyzed by a coupled enzyme assay as described previously (4). TrwBΔN70 was preincubated with different DNA substrates for 10 min at 37 °C in 150 μl of an ATPase assay mixture consisting of 50 mm Pipes-NaOH, pH 6.2, 35 mm NaCl, 5 mm MgAc2, 5% glycerol, 0.5 mm phosphoenolpyruvate, 0.25 mm NADH, 60 μg/ml pyruvate kinase, and 60 μg/ml lactate dehydrogenase (Roche Applied Science). Reactions were started by the addition of ATP.
Analytical Ultracentrifugation Experiments
An Optima XL-I analytical ultracentrifuge (Beckman-Coulter) was used to perform the analytical ultracentrifugation experiments. The detection was carried out by means of a UV-visible absorbance detection system. Experiments were conducted at 20 °C using an AnTi50 eight-hole rotor and Epon-charcoal standard double sector centerpieces (12-mm optical path). Absorbance scans were taken at the appropriate wavelength (260–296 nm). Sedimentation velocity experiments were performed at 45 krpm using 400-μl samples in buffer consisting of 50 mm Pipes-NaOH, pH 6.2, 0.1 mm EDTA, 150 mm NaCl, 5% glycerol, and 0.001% PMSF. Differential sedimentation coefficient distributions, c(s), were calculated by least squares boundary modeling of sedimentation velocity data using the program SEDFIT (21, 22). From this analysis, the experimental sedimentation coefficients were corrected for solvent composition and temperature with the program SEDNTERP to obtain the corresponding standard s values. Solution viscosities were measured with an Anton Paar AMVn automated viscometer.
Short column (85 μl) sedimentation equilibrium runs were carried out at multiple speeds (5.5, 8, 10, 12, and 17 krpm). After the equilibrium scans, a high speed centrifugation run (42 krpm) was done to estimate the corresponding baseline offsets. Weight-average buoyant molecular weights of protein and oligonucleotides were determined by fitting a single species model to the experimental data using either a MATLAB program based on the conservation of signal algorithm (23) or the HeteroAnalysis program (24). Both analyses gave essentially the same results. The molecular weights of protein and DNA were determined from the experimental buoyant masses using 0.737 and 0.55 as the partial specific volumes of TrwBΔN70 (calculated from the amino acid composition using the SEDNTERP program) (25) and DNA (taken from an estimated literature value for nucleic acids) (26), respectively.
Gel Filtration Analysis
DNA substrates and TrwBΔN70-DNA complexes were chromatographed at 20 °C at a flow rate of 30 μl/min on a Superdex-200 PC 3.2/30 column (Amersham Biosciences SMART system). The column was equilibrated in buffer containing 50 mm Pipes-NaOH, pH 6.2, 0.1 mm EDTA, 150 mm NaCl, 10% glycerol, and 0.001% PMSF. Absorbance was monitored at 260 and 280 nm.
To analyze the formation of DNA secondary structures, samples (40 μl) of the oligonucleotides were loaded at a concentration of 50 μm, previously diluted with gel filtration buffer. Formation of TrwBΔN70-DNA complexes was analyzed after incubating protein (60 μm) and DNA (10 μm) for 15 min at 20 °C.
DNA Binding Assays
TrwBΔN70 DNA binding activity was measured using a gel shift assay. Binding reactions (20 μl) contained 50 mm Pipes-NaOH, pH 6.2, 50 mm NaCl, 2 mm dithiothreitol, 100 μg/μl bovine serum albumin, 6% glycerol, 0.5 nm 32P-labeled DNA, and the indicated quantities of TrwBΔN70. After incubation at 37 °C for 10 min, reaction mixtures were loaded onto a 10% native PAGE gel (1× Tris-borate-EDTA). Free nucleic acids and nucleoprotein complexes were resolved by electrophoresis at 175 V for 2 h at room temperature. Gels were analyzed using a Molecular Imager FX ProSystem (Bio-Rad Laboratories). For quantification, the intensity of bands corresponding to free DNA and TrwBΔN70-DNA complex was determined using ImageQuant software. Free DNA (%) = free DNA/(free DNA + TrwB-DNA) × 100.
DNA Helicase Assays
DNA substrates were prepared and radiolabeled as described above. Helicase assays were carried out in 20 μl of a solution containing 50 mm NaCl, 100 μg/ml bovine serum albumin, 6% glycerol, 2 mm dithiothreitol, 5 mm magnesium chloride, 5 mm ATP, 32P-labeled DNA substrate (0.5 nm), and 50 mm Pipes, pH 6.2, for TrwB assays or 50 mm Tris-HCl, pH 7.5, for RecQ assays. Reactions were carried out at 37 °C and stopped by the addition of 4 μl of Stop Mix (2.5% SDS, 200 mm EDTA, 10 mg/ml proteinase K) and 5 μl of loading buffer (0.5% bromphenol blue, 0.5% xylene cyanol, and 15% Ficoll). Products were resolved by electrophoresis on 10% polyacrylamide gels (1× Tris-borate-EDTA) at 175 V for 90 min. Gels were analyzed using a Molecular Imager FX ProSystem (Bio-Rad Laboratories).
RESULTS
DNA Substrate Requirements for TrwBΔN70 ATPase Activity
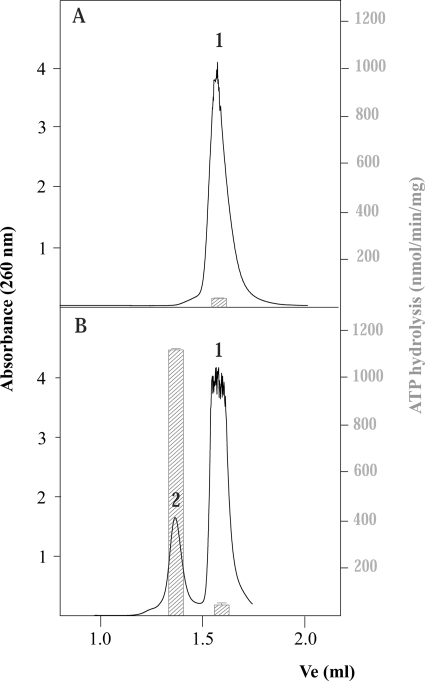
In a previous work, we investigated the minimal length of ssDNA needed for activating TrwBΔN70 ATPase activity (4). No activity was observed with oligonucleotides of <45 nucleotides and, therefore, we concluded that was the minimal length needed. However, a more extensive analysis with an enlarged series of oligonucleotides of different sizes and sequences has revealed a more complex picture. We observed that oligonucleotides that stimulated the ATPase activity of TrwBΔN70, independently of their size, systematically presented a second peak, as shown by gel filtration chromatography. Fig. 1 shows the elution profile of two different 45-mer oligonucleotides. The sequences of both oligonucleotides are shown in Table 1. Oligonucleotide A eluted as a single peak from a Superdex 200 column (peak 1), indicating the absence of any significant high order structure, whereas oligonucleotide B presented a second peak that eluted as if it were a higher molecular mass structure.
FIGURE 1.
Gel filtration chromatography of 45-mer oligonucleotides A and B. Oligonucleotides A and B without pretreatment were chromatographed at 20 °C at a flow rate of 30 μl/min on a Superdex-200 PC 3.2/30 column (Amersham Biosciences SMART system). The column was equilibrated in buffer containing 50 mm Pipes-NaOH, pH 6.2, 150 mm NaCl, 0.1 mm EDTA, 10% glycerol, and 0.001% PMSF. Absorbance was monitored at 260 nm. Ve represents the elution volume. Peaks were interpreted as follows: 1) free oligonucleotide and 2) oligonucleotide with a secondary DNA structure. The right index shows ATP hydrolysis rates, depicted as bars, from samples coming from each peak, quantified as described under “Experimental Procedures.” Reactions were carried out with 1.5 μm TrwBΔN70 and 10 μm bases of the oligonucleotide.
TABLE 1.
Sequence of oligonucleotides used for the substrate preparation
G-clusters are indicated by bold letters. The underlined residues in oligonucleotide D correspond to the substitution of two guanines by two adenines in the cluster of five guanines, which is also present in oligonucleotide B.
| Oligonucleotide | Sequence (5′–3′) |
|---|---|
| A | AAGGACGAAAACCTGTGTAGTGTTATGCCACTACAATATTGCCGC |
| B | TCGCCACGTTTCGCCGTTTGCGGGGGTTTCTGCGAGGAACTTTGG |
| C | AAAGGGTTAGGGTTAGGGTTAGGGAA |
| D | TCGCCACGTTTCGCCGTTTGCGAAGGTTTCTGCGAGGAACTTTGG |
| E | ATCGATAGTCTCTAGACAGCATGTCCTAGCAAGCCAGAATTCGGCAGCGT |
| F | GACGCTGCCGAATTCTGGCTTGCTATGTAACTCTTTGCCCACGTTGACCC |
| G | GCGGCAATATTGTAGTGGCATAACACTACACAGGTTTTCGTCCTT |
In the absence of any DNA substrate, TrwBΔN70 showed basal ATPase activity at 24 nmol/min/mg of protein. Oligonucleotide A stimulated ATPase activity on TrwBΔN70 only marginally because fractions taken from the elution profile resulted in an activity of 46 nmol/min/mg (Fig. 1, right index). Oligonucleotide B led to a much enhanced TrwB ATPase activity, but only fractions from peak 2 were able to activate TrwBΔN70 ATP hydrolysis. The ATPase activity values obtained with samples from peaks 1 and 2 were 50 and 1150 nmol/min/mg of protein, respectively, as shown in the histogram. Therefore, there is a correlation between the capability of an oligonucleotide to form a DNA structure and the stimulation of TrwBΔN70 ATPase activity. Such capability was independent of the size of the oligonucleotide because oligonucleotides shorter than 45-mer that were able to form a G4 DNA structure, such as oligonucleotide C (Table 1), also stimulated TrwBΔN70 ATPase activity (a value of 420 nmol/min/mg was obtained with the untreated oligonucleotide).
Structural predictions using the program OligoCalc (27) showed that oligonucleotides A and B could potentially form the same intermolecular duplexes or hairpins, suggesting that a different type of DNA structure should be involved in promoting TrwBΔN70 ATPase activity (Fig. 1B, peak 2). Interestingly, oligonucleotide B presented a G-rich sequence that could lead to the formation of a G-DNA structure (28).
G4 DNA Structures Stimulate TrwBΔN70 ATPase Activity
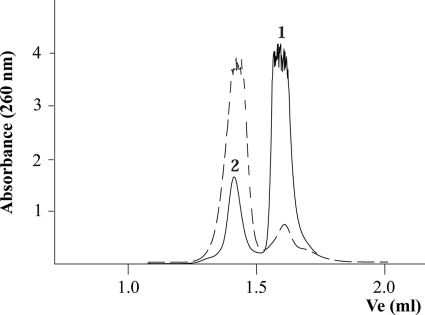
In vitro, oligonucleotides carrying G-rich sequences spontaneously form G4 DNA structures, influenced by the presence of monovalent cations (28). Therefore, laboratory stocks of G-rich synthetic oligonucleotides typically contain a small fraction of G4 DNA (29). As mentioned, oligonucleotide B presents a track of five guanines that potentiate a G-quadruplex structure in vitro. To check this, oligonucleotide B was incubated for 48 h in a high salt buffer, following a protocol to obtain G4 DNA (30) (see also “Experimental Procedures”). Fig. 2 shows the elution profile of oligonucleotide B in gel filtration experiments carried out before and after the treatment. Before the treatment, the oligonucleotide mainly eluted as peak 1, with only a small portion (17.6%) eluting as peak 2. After the treatment, most of the oligonucleotide (93.2%) eluted as peak 2, forming the secondary structure.
FIGURE 2.
Conversion of free oligonucleotide B to a G4 DNA structure. Oligonucleotides were chromatographed at 20 °C at a flow rate of 30 μl/min on a Superdex-200 PC 3.2/30 column (Amersham Biosciences SMART system). The column was equilibrated in buffer containing 50 mm Pipes-NaOH (pH 6.2), 150 mm NaCl, 0.1 mm EDTA, 10% glycerol, and 0.001% PMSF. Absorbance was monitored at 260 nm. Ve represents the elution volume. The figure shows the elution profile of the 45-mer oligonucleotide B without pretreatment (represented as a solid line) and the same oligonucleotide incubated for 48 h in the presence of 150 mm Na+, as described under “Experimental Procedures” (represented as a dashed line). Peaks were interpreted as follows: 1) free oligonucleotide and 2) oligonucleotide with a G4 DNA secondary structure.
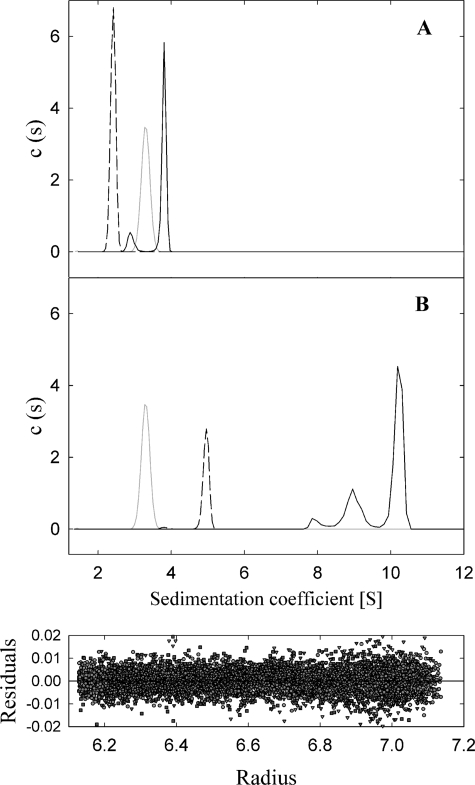
Sedimentation velocity experiments were carried out with oligonucleotide A and also with samples coming from peak 2 of pretreated oligonucleotide B. Both samples were monodisperse at the concentration tested (2.5 and 0.4 μm, respectively). The analysis of the sedimentation coefficient distributions yielded standard s values of 2.4 and 5.0 s (±0.1 s), which were compatible with a 45-mer oligonucleotide and a G4 DNA formed with a 45-mer oligonucleotide (calculated frictional ratios f/f0 = 1.7 and 2.1, respectively) (Fig. 3). Sedimentation equilibrium was carried out in parallel to determine the molecular weight of the molecules. A single species model accounted for the experimental gradients at sedimentation equilibrium of oligonucleotide A and pretreated oligonucleotide B, with best fit molecular weights of 14,100 and 51,400, compatible with a 45-mer monomer and a G4 DNA, respectively. Therefore, analytical ultracentrifugation experiments corroborated the formation of a G4 DNA structure in pretreated oligonucleotide B.
FIGURE 3.
Sedimentation velocity studies. A, coefficient distributions (c(s)) recovered for protein TrwBΔN70 (gray dotted line), oligonucleotide A (black dashed line), and TrwBΔN70-oligonucleotide A complex (black solid line). B, coefficient distributions recovered for protein TrwBΔN70 (gray dotted line), G4 DNA formed with pretreated oligonucleotide B (black dashed line), and TrwBΔN70-G4DNA complex (black solid line). Lower panel, the residuals between experimental velocity data and best fit distribution model c(s) were evenly distributed.
Further analysis demonstrated that the track of five guanines that are present in oligonucleotide B was responsible for the formation of the G-quadruplex because substitution of two of these guanines, at positions 23–24, to adenines (oligonucleotide D, Table 1) disrupted the hydrogen bonding of the G-quartets and abolished the capability of oligonucleotide D to form a secondary structure. The elution profile of oligonucleotide D showed a single peak corresponding to peak 1, even after the treatment to stimulate the formation of a G-quadruplex structure. In addition, oligonucleotide D did not stimulate TrwBΔN70 ATPase activity. This important result linked TrwBΔN70 ATPase activity with the capability of an oligonucleotide to form a G-quadruplex DNA structure.
TrwB Forms Hexamers Only with Oligonucleotides in a G4 DNA Structure
Sedimentation velocity experiments were also carried out to compare TrwBΔN70 with TrwBΔN70-DNA complexes (Fig. 3). Analysis of the sedimentation coefficient distribution of TrwBΔN70 gave an s value of 3.3 (±0.1 s), compatible with a monomer of protein (calculated frictional ratio f/f0 = 1.4). The sample was monodisperse at the concentration tested (14 μm). The mixture of TrwBΔN70 and oligonucleotide A showed a biphasic sedimentation distribution. The predominant sedimenting species (87.3%) had an s value of 3.8 s, compatible with a 1:1 complex (calculated frictional ratio f/f0 = 1.7); the minor species with an s value in between those of isolated protein and oligonucleotide could correspond to dissociated species. The sedimentation coefficient distribution of the TrwBΔN70-G4DNA mixture showed two main sedimenting species, with s values 10.3 s (68.5%) and 9.0 s (26.6%), that are compatible with 6:1 and 4:1 complexes, respectively (calculated frictional ratios of f/f0 = 1.9 and 1.8; respectively). Sedimentation equilibrium experiments were also carried out in parallel to determine the molecular weight of the macromolecules studied, but the protein-DNA complexes dissociated during the time length of the experiment, as demonstrated by time-dependent sedimentation assays. Therefore, it was not possible to use this technique to accurately determine the molecular weight and stoichiometry of the heterocomplexes.
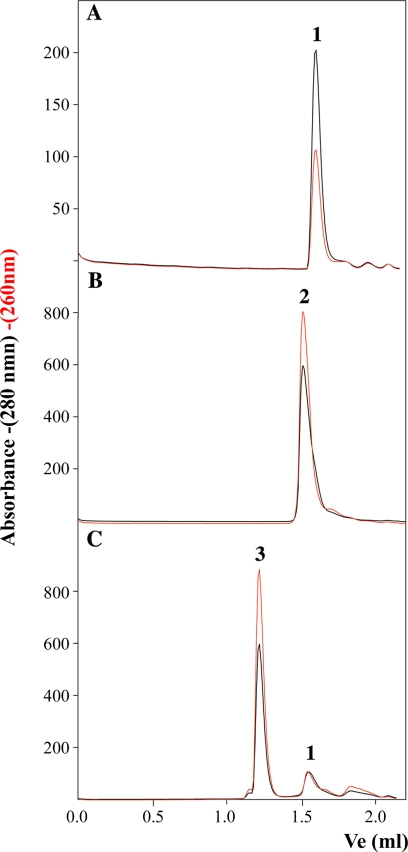
Gel filtration experiments were used as a second method to verify the formation of high order TrwBΔN70 oligomers when protein was incubated with pretreated oligonucleotide B. TrwBΔN70 is a monomer in solution, as shown by the elution of the protein as a single peak with an estimated molecular mass of 50 kDa from a Superdex 200 column (Fig. 4A, peak 1). Incubation of the protein with oligonucleotide A led to the formation of a complex that eluted with a molecular mass of ∼100 kDa (Fig. 4B, peak 2). The complex contained DNA, as shown by a correlated increase in the absorbance at 260 nm, so it was estimated to be a complex of one monomer protein with one oligonucleotide molecule (see also Ref. 4). Peak 1 corresponded to free protein because it showed a relative lack of absorbance at 260 nm. When TrwBΔN70 was incubated with pretreated oligonucleotide B (a G4 DNA structure), a new complex appeared (Fig. 4C, peak 3), with an estimated molecular mass of ∼400 kDa, also correlated with a high absorbance at 260 nm. Peak 3 corresponds to a hexameric TrwBΔN70-DNA complex, as suggested by the analytical ultracentrifugation experiments shown above and by electron microscopy experiments reported in a previous work (11), and is consistent with the size of hexameric TrwBΔN70 complexes solved by crystallography (7). When TrwBΔN70 was incubated with untreated oligonucleotide B, only a small fraction of TrwBΔN70 formed peak 3 (4), corresponding to the small fraction of the oligonucleotide that spontaneously forms G4 DNA without pretreatment.
FIGURE 4.
Gel filtration chromatography of TrwBΔN70 and TrwBΔN70-DNA complexes. Protein samples (60 μm) were preincubated with oligonucleotides A and B (10 μm) and chromatographed at 20 °C at a flow rate of 30 μl/min on a Superdex-200 PC 3.2/30 column (Amersham Biosciences SMART system). The column was equilibrated in buffer containing 50 mm Pipes-NaOH (pH 6.2), 150 mm NaCl, 0.1 mm EDTA, 0.001% PMSF, and 10% glycerol. Absorbance was monitored at 280 nm (black) and 260 nm (red). Ve represents the elution volume. Elution profiles are as follows: A, TrwBΔN70; B, TrwBΔN70 preincubated with oligonucleotide A; and C, TrwBΔN70 preincubated with oligonucleotide B previously treated to form a G4 DNA structure. Peaks were interpreted as follows: 1) free protein (relative lack of absorbance at 260; apparent molecular mass ∼50 kDa); 2) slow complex (contains protein and DNA; apparent molecular mass ∼100 kDa); and 3) fast complex (contains protein and DNA; apparent molecular mass ∼440 kDa).
TrwBΔN70 Displays Higher Affinity for G4 DNA over Single-stranded DNA
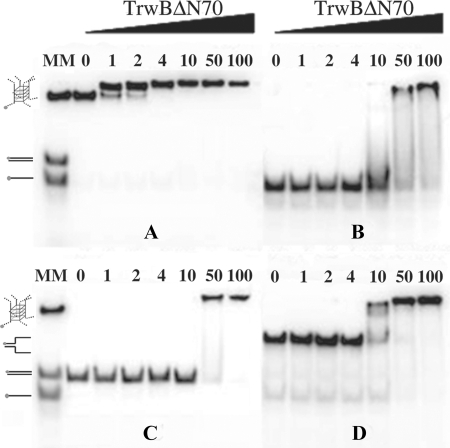
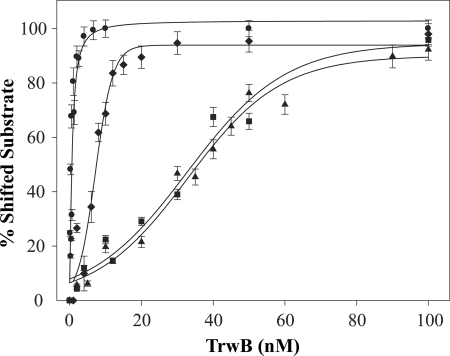
Gel shift assays indicated that TrwBΔN70 binds to G4 DNA with high affinity, as shown in Fig. 5. The protein bound G4 DNA preferentially over ssDNA of the same sequence. Even at the lowest protein concentration, 1 nm, nearly all the G4 DNA substrate formed a complex with TrwBΔN70 (panel A). However, the same DNA sequence without any structure was shifted only at a TrwBΔN70 concentration above 10 nm (panel B), and only at 100 nm of protein, all the free oligonucleotide was forming a complex with TrwBΔN70. Therefore, we conclude that TrwBΔN70 displays preferential binding to G4 DNA (Kd = ∼0.3 nm) and has 100-fold lower affinity for the same ssDNA sequence without secondary structure (Kd = ∼31 nm). Quantification of representative gel mobility shift analyses of TrwBΔN70 binding to different DNA substrates is shown in Fig. 6. Kd values were determined as the TrwBΔN70 concentration that bound 50% of the respective DNA substrate.
FIGURE 5.
TrwBΔN70 binds to G4 DNA structures with high affinity. Gel mobility shift assays of different TrwBΔN70-DNA complexes. Reaction mixtures contained 10 fmol of 32P-labeled G4 DNA, ssDNA, dsDNA, or forked DNA substrates in panels A, B, C, or D, respectively. The DNA substrates were incubated with TrwBΔN70 protein at 1, 2, 4, 10, 50, and 100 nm, as described under “Experimental Procedures.” DNA substrates used as molecular markers (MM) are drawn on the left of the gels and correspond to oligonucleotide A (45-mer), a 45-bp-long dsDNA formed by the annealing of nucleotides A and G, a 50-bp-long forked DNA formed by the annealing of nucleotides E and F, and a G4 DNA formed after the appropriate treatment of oligonucleotide B.
FIGURE 6.
Quantification of representative gel mobility shift analyses of TrwBΔN70 binding to G4 DNA (●), forked DNA (♦), ssDNA (■), and dsDNA (▴). Apparent affinities (Kd) are 0.3, 7, 31, and 33 nm, respectively. Experiments were carried out as described in the legend for Fig. 5. Error bars represent S.D. from three experiments.
These results, alongside ATPase and oligomerization analysis, strongly suggested that TrwBΔN70 has structure specificity for G4 DNA. To check whether TrwBΔN70 presented high affinity for other DNA substrates with a region of both dsDNA and ssDNA, other structures were tested to compare binding affinities. The data in Fig. 5, panel C show a gel shift assay of a forked DNA structure formed with oligonucleotides E and F (Table 1). TrwBΔN70 bound to this structure to a lower extent (Kd = ∼7 nm) (Fig. 6) when compared with the G4 DNA structure. Interestingly, a duplex DNA substrate 45 bases long, formed by the annealing of oligonucleotides A and G, was less efficient for TrwBΔN70 binding (Kd ∼33 nm). This result suggests that TrwBΔN70 binds specifically to a DNA structure, with higher affinity to a four-stranded DNA structure than to hairpin forms.
TrwBΔN70 Cannot Unwind G4 DNA Substrates
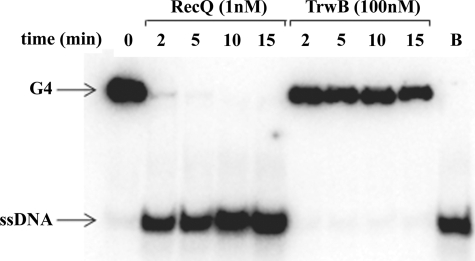
On the basis of the results discussed above, we wanted to determine whether TrwBΔN70 was able to unwind four-stranded DNA structures. Therefore, TrwBΔN70 was assayed for helicase activity on G4 DNA, as described under “Experimental Procedures.” TrwBΔN70 displayed no G4 DNA unwinding activity even at high protein concentration (100 nm), whereas E. coli RecQ protein (1 nm) unwound G4 DNA very efficiently. After 2 min, 92% of the G4 DNA substrate was unwound by RecQ (Fig. 7). Similar results were obtained with longer incubation times. TrwBΔN70 was also assayed for helicase activity on a wide range of DNA substrates, including various types of forked DNA, duplex DNA, and Holliday junction structures. In the latter case, RecG protein (31) and Hel308 protein (32) were used as positive controls (data not shown). G4 DNA substrates with longer 3′- and 5′-poliA tails were also formed to check a putative dependence upon single-stranded tails, as it is in the case of RecQ protein (29). None of the DNA substrates was unwound by TrwBΔN70 under the tested conditions.
FIGURE 7.
TrwBΔN70 cannot unwind G4 DNA substrates. Helicase assays were carried out as described under “Experimental Procedures.” G4 DNA (0.5 nm) was incubated with proteins RecQ (1 nm) and TrwBΔN70 (100 nm). Reactions were stopped at different times, as indicated in the figure. Controls were loaded onto the gel without the enzyme (first lane) and with the boiled substrate (B, last lane).
DISCUSSION
T4CPs are essential proteins in plasmid conjugation that act on DNA to actively transport it into cells (10). In accordance to this, TrwB was shown to be a DNA-dependent ATPase. The results presented in this work suggest that TrwB is also a structure-specific DNA-binding protein. Three lines of evidence presented here indicate that G4 DNA may be the natural target for TrwB activity in vivo. First, TrwBΔN70 binds G4 DNA with 100-fold higher affinity than ssDNA of the same sequence. Second, TrwB is at least 25 times more efficient in hydrolyzing ATP in the presence of an oligonucleotide with a G4 DNA structure. Furthermore, the protein only forms high order oligomers in the presence of G-quadruplex intermolecular structures, as shown by analytical ultracentrifugation and gel filtration experiments.
G-DNA structures have not been directly observed in vivo, but the ease with which they can form in vitro suggests that they may exist transiently in a cell. Runs of three or more Gs occur throughout the mammalian genome; G-rich motifs are particularly abundant in rDNA gene clusters (33), immunoglobulin heavy chain gene switch regions (34), and telomeric repeats (35). As a G-DNA structure is stable once formed, it could interfere with normal nuclear processes if there were no efficient enzymes able to disrupt it. The existence of specialized helicases with the ability to resolve G4 DNA structures provided evidence for the importance of G4 DNA in various biological processes. For instance, RecQ helicases bind and unwind G-quadruplex DNA (17), contributing to the resolution of secondary structures during replication. Bacterial conjugation can be visualized as a DNA replication system linked to a macromolecular transport complex (36). In the bacterial cytoplasm, an rolling circle replication-like process is used to cleave the transferred DNA strand at the origin of transfer (oriT) and unwind the cleaved strand while replicating it from its free 3′-OH end. The process might expose single-stranded G-rich regions in the replicating DNA, allowing G-DNA to form (particularly in a GC-rich plasmid as R388). These observations suggested that TrwB might be involved in resolving G4 secondary structures that arise during conjugative DNA processing, disrupting such structures to allow ssDNA transport through the central channel of the protein. ATP hydrolysis would be required both for translocation of TrwB along ssDNA and also for destabilization of any G4 DNA ahead of the enzyme. However, TrwBΔN70 did not show any significant DNA helicase activity, although a wide variety of DNA substrates were tried, including G-quadruplex structures. R388 plasmid codes for another protein that is also essential for bacterial conjugation and presents helicase activity (TrwC). This protein cleaves the DNA at oriT and separates both DNA strands prior to translocation. Therefore, TrwB might not need a helicase activity and might act on ssDNA previously supplied by TrwC.
On the basis of the exposed results, G4 DNA could act simply as a loading site for TrwB. A DNA translocase from the same family, FtsK, recognizes a DNA sequence named KOPS on the DNA (FtsK orienting polarized sequence), which acts as a loading sequence to correctly orient FtsK on DNA prior to translocation (37). Interestingly, KOPS is a G-rich sequence that has the consensus 5′-GGGNAGGG-3′. The crystal structure of three FtsKγ domains bound to 16 bp of double-stranded DNA containing the KOPS sequence was solved (38) (Protein Data Bank 2VE9). The resultant model predicts that only three of the six FtsKγ subunits are used for KOPS recognition. When bound by the three domains, the DNA does not significantly change its conformation and is close to ideal B-DNA. The higher effectiveness of a longer KOPS sequence (GGGCAGGGCAGGGCAGGG) is explained in terms of providing potential binding sites for all six FtsKγ domains (38, 39). As mentioned before, G-rich DNA sequences are thought to form G-DNA structures in vivo. Interestingly, the overlapping triple KOPS sequence, with four clusters of G-residues, perfectly matches the consensus signature to form a G4 DNA structure (G3–5, N1–3, G3–5, N1–3, G3–5, N1–3, G3–5) (16). Therefore, it might be interesting to study whether FtsK binds differentially or with more effectiveness to such DNA structures. Architecture-imparting sequences, such as KOPS, have been identified in nearly all bacterial genomes (40). The distribution of this type of short sequence is consistent with global chromosome structure. Another example is the 8-bp χ sequence (GCTGGTGG); this octamer is highly abundant on leading strands (41). It is recognized by the E. coli RecBC recombinase complex, halting the retrotranslocation of Holliday junctions at these sites to repair dsDNA breaks via homologous recombination (42). In summary, TrwB seems to share with other related molecular motors acting on DNA the capability to bind specific DNA structures that are important to its physiological roles. Therefore, a G-quadruplex structure could simply act as a loading site to promote the formation of TrwB hexamers on DNA. Further analyses of the effect of such sequences on the function of TrwB are in progress to disentangle its mechanism of action.
Acknowledgments
We thank J. Webster and S. Zunzunegui for excellent technical assistance and Dr. Ramón Eritja for helpful discussions.
This work was supported by Ministerio de Ciencia e Innovación (MCINN, Spain) Grant BFU2008-00806 (to E. C.), Grants BFU2008-00995/BMC from MCINN, RD06/0008/1012 from Instituto de Salud Carlos III, and LSHM-CT-2005_019023 from the European VI Framework Program (to F. d. l. C.), and a grant from The Biomedical Sciences (Nottingham) Research Fund (to E. L. B.).
- ssDNA
- single-stranded DNA
- dsDNA
- double-stranded DNA
- PMSF
- phenylmethylsulfonyl fluoride
- Pipes
- 1,4-piperazinediethanesulfonic acid.
REFERENCES
- 1.de la Cruz F., Davies J. (2000) Trends Microbiol. 8, 128–133 [DOI] [PubMed] [Google Scholar]
- 2.Cabezón E., Sastre J. I., de la Cruz F. (1997) Mol. Gen. Genet. 254, 400–406 [DOI] [PubMed] [Google Scholar]
- 3.Cascales E., Christie P. J. (2004) Science 304, 1170–1173 [DOI] [PMC free article] [PubMed] [Google Scholar]
- 4.Tato I., Zunzunegui S., de la Cruz F., Cabezon E. (2005) Proc. Natl. Acad. Sci. U.S.A. 102, 8156–8161 [DOI] [PMC free article] [PubMed] [Google Scholar]
- 5.Moncalián G., Cabezón E., Alkorta I., Valle M., Moro F., Valpuesta J. M., Goñi F. M., de La Cruz F. (1999) J. Biol. Chem. 274, 36117–36124 [DOI] [PubMed] [Google Scholar]
- 6.Massey T. H., Mercogliano C. P., Yates J., Sherratt D. J., Löwe J. (2006) Mol. Cell 23, 457–469 [DOI] [PubMed] [Google Scholar]
- 7.Gomis-Rüth F. X., Moncalián G., Pérez-Luque R., González A., Cabezón E., de la Cruz F., Coll M. (2001) Nature 409, 637–641 [DOI] [PubMed] [Google Scholar]
- 8.Abrahams J. P., Leslie A. G., Lutter R., Walker J. E. (1994) Nature 370, 621–628 [DOI] [PubMed] [Google Scholar]
- 9.Singleton M. R., Sawaya M. R., Ellenberger T., Wigley D. B. (2000) Cell 101, 589–600 [DOI] [PubMed] [Google Scholar]
- 10.Cabezon E., de la Cruz F. (2006) Res. Microbiol. 157, 299–305 [DOI] [PubMed] [Google Scholar]
- 11.Tato I., Matilla I., Arechaga I., Zunzunegui S., de la Cruz F., Cabezon E. (2007) J. Biol. Chem.. 282, 25569–25576 [DOI] [PubMed] [Google Scholar]
- 12.Yamada K., Miyata T., Tsuchiya D., Oyama T., Fujiwara Y., Ohnishi T., Iwasaki H., Shinagawa H., Ariyoshi M., Mayanagi K., Morikawa K. (2002) Mol. Cell 10, 671–681 [DOI] [PubMed] [Google Scholar]
- 13.Cohen A., Fisher W. D., Curtiss R., 3rd, Adler H. I. (1968) Proc. Natl. Acad. Sci. U.S.A. 61, 61–68 [DOI] [PMC free article] [PubMed] [Google Scholar]
- 14.Ohki M., Tomizawa J. (1968) Cold Spring Harbor Symp. Quant. Biol. 33, 651–658 [DOI] [PubMed] [Google Scholar]
- 15.Williamson J. R. (1994) Annu. Rev. Biophys. Biomol. Struct. 23, 703–730 [DOI] [PubMed] [Google Scholar]
- 16.London T. B., Barber L. J., Mosedale G., Kelly G. P., Balasubramanian S., Hickson I. D., Boulton S. J., Hiom K. (2008) J. Biol. Chem. 283, 36132–36139 [DOI] [PMC free article] [PubMed] [Google Scholar]
- 17.Karow J. K., Wu L., Hickson I. D. (2000) Curr. Opin. Genet. Dev. 10, 32–38 [DOI] [PubMed] [Google Scholar]
- 18.Irino N., Nakayama K., Nakayama H. (1986) Mol. Gen. Genet. 205, 298–304 [DOI] [PubMed] [Google Scholar]
- 19.Stewart E., Chapman C. R., Al-Khodairy F., Carr A. M., Enoch T. (1997) EMBO J. 16, 2682–2692 [DOI] [PMC free article] [PubMed] [Google Scholar]
- 20.Popuri V., Bachrati C. Z., Muzzolini L., Mosedale G., Costantini S., Giacomini E., Hickson I. D., Vindigni A. (2008) J. Biol. Chem. 283, 17766–17776 [DOI] [PubMed] [Google Scholar]
- 21.Schuck P. (2000) Biophys. J. 78, 1606–1619 [DOI] [PMC free article] [PubMed] [Google Scholar]
- 22.Schuck P., Perugini M. A., Gonzales N. R., Howlett G. J., Schubert D. (2002) Biophys. J. 82, 1096–1111 [DOI] [PMC free article] [PubMed] [Google Scholar]
- 23.Minton A. P. (1994) in Modern Analytical Ultracentrifugation (Schuster T. M., Laue T. M. eds) pp. 81–93, Birkhauser, Boston, MA [Google Scholar]
- 24.Cole J. L. (2004) Methods Enzymol. 384, 212–232 [DOI] [PMC free article] [PubMed] [Google Scholar]
- 25.Laue T. M., Shah B. D., Ridgeway T. M., Pelletier S. L. (1992) in Analytical Ultracentrifugation in Biochemistry and Polymer Science (Harding S., Rowe A., Horton J. eds) pp. 90–125, The Royal Society of Chemistry, Cambridge, UK [Google Scholar]
- 26.Howlett G. J., Davidson B. E. (2000) Methods Enzymol. 323, 231–254 [DOI] [PubMed] [Google Scholar]
- 27.Kibbe W. A. (2007) Nucleic Acids Res. 35, W43–W46 [DOI] [PMC free article] [PubMed] [Google Scholar]
- 28.Sen D., Gilbert W. (1990) Nature 344, 410–414 [DOI] [PubMed] [Google Scholar]
- 29.Sun H., Karow J. K., Hickson I. D., Maizels N. (1998) J. Biol. Chem. 273, 27587–27592 [DOI] [PubMed] [Google Scholar]
- 30.Baran N., Pucshansky L., Marco Y., Benjamin S., Manor H. (1997) Nucleic Acids Res. 25, 297–303 [DOI] [PMC free article] [PubMed] [Google Scholar]
- 31.Briggs G. S., Mahdi A. A., Wen Q., Lloyd R. G. (2005) J. Biol. Chem. 280, 13921–13927 [DOI] [PubMed] [Google Scholar]
- 32.Guy C. P., Bolt E. L. (2005) Nucleic Acids Res. 33, 3678–3690 [DOI] [PMC free article] [PubMed] [Google Scholar]
- 33.Versini G., Comet I., Wu M., Hoopes L., Schwob E., Pasero P. (2003) EMBO J. 22, 1939–1949 [DOI] [PMC free article] [PubMed] [Google Scholar]
- 34.Shimizu A., Honjo T. (1984) Cell 36, 801–803 [DOI] [PubMed] [Google Scholar]
- 35.Cohen H., Sinclair D. A. (2001) Proc. Natl. Acad. Sci. U.S.A. 98, 3174–3179 [DOI] [PMC free article] [PubMed] [Google Scholar]
- 36.Llosa M., Gomis-Rüth F. X., Coll M., de la Cruz Fd F. (2002) Mol. Microbiol. 45, 1–8 [DOI] [PubMed] [Google Scholar]
- 37.Bigot S., Saleh O. A., Lesterlin C., Pages C., El Karoui M., Dennis C., Grigoriev M., Allemand J. F., Barre F. X., Cornet F. (2005) EMBO J. 24, 3770–3780 [DOI] [PMC free article] [PubMed] [Google Scholar]
- 38.Löwe J., Ellonen A., Allen M. D., Atkinson C., Sherratt D. J., Grainge I. (2008) Mol. Cell 31, 498–509 [DOI] [PMC free article] [PubMed] [Google Scholar]
- 39.Sivanathan V., Allen M. D., de Bekker C., Baker R., Arciszewska L. K., Freund S. M., Bycroft M., Löwe J., Sherratt D. J. (2006) Nat. Struct. Mol. Biol. 13, 965–972 [DOI] [PMC free article] [PubMed] [Google Scholar]
- 40.Hendrickson H., Lawrence J. G. (2006) J. Mol. Evol. 62, 615–629 [DOI] [PubMed] [Google Scholar]
- 41.El Karoui M., Biaudet V., Schbath S., Gruss A. (1999) Res. Microbiol. 150, 579–587 [DOI] [PubMed] [Google Scholar]
- 42.Myers R. S., Stahl F. W. (1994) Annu. Rev. Genet. 28, 49–70 [DOI] [PubMed] [Google Scholar]


