Abstract
We showed previously in cultures of primary human adipocytes and preadipocytes that lipopolysaccharide and trans-10,cis-12-conjugated linoleic acid (10,12-CLA) activate the inflammatory signaling that promotes insulin resistance. Because our published data demonstrated that preadipocytes are the primary instigators of inflammatory signaling in lipopolysaccharide-treated cultures, we hypothesized that they played the same role in 10,12-CLA-mediated inflammation. To test this hypothesis, we employed four distinct models. In model 1, a differentiation model, CLA activation of MAPK and induction of interleukin-8 (IL-8), IL-6, IL-1β, and cyclo-oxygenase-2 (COX-2) were greatest in differentiated compared with undifferentiated cultures. In model 2, a cell separation model, the mRNA levels of these inflammatory proteins were increased by 10,12-CLA compared with bovine serum albumin vehicle in the adipocyte fraction and the preadipocyte fraction. In model 3, a co-culture insert model, inserts containing ∼50% adipocytes (AD50) or ∼100% preadipocytes (AD0) were suspended over wells containing AD50 or AD0 cultures. 10,12-CLA-induced IL-8, IL-6, IL-1β, and COX-2 mRNA levels were highest in AD50 cultures when co-cultured with AD0 inserts. In model 4, a conditioned medium (CM) model, CM collected from CLA-treated AD50 but not AD0 cultures induced IL-8 and IL-6 mRNA levels and activated phosphorylation of MAPK in naive AD0 and AD50 cultures. Consistent with these data, 10,12-CLA-mediated secretions of IL-8 and IL-6 from AD50 cultures were higher than from AD0 cultures. Notably, blocking adipocytokine secretion prevented the inflammatory capacity of CM from 10,12-CLA-treated cultures. These data suggest that CLA instigates the release of inflammatory signals from adipocytes that subsequently activate adjacent preadipocytes.
Keywords: Cytokines/Interleukins, Lipid/Fatty Acid, Metabolism/Lipid, Adipocyte, Inflammation, Adipocytokines, Conjugated Linoleic Acid, Human (Pre)adipocytes
Introduction
Obesity is the most prevalent nutrition-related disease in the United States, where 66% of the adult population is classified as overweight or obese (1). Obesity is linked to chronic diseases such as type 2 diabetes, hypertension, and cardiovascular disease. Annual health care costs for treating the overweight and obese population are ∼$100 billion. Thus, maintaining ideal body weight will decrease the incidence of and health care costs associated with obesity. However, current strategies that promote effective and safe weight loss or maintenance thereof are lacking.
Notably, a commercially available weight loss supplement containing two equal levels of conjugated linoleic acid (CLA)2 isomers (i.e. cis-9, trans-11 (9,11-CLA) and trans-10, cis-12 (10,12-CLA)) decreases adiposity or increases lean body mass in animals (2–6) and some humans (7–10). It appears that 10,12-CLA, rather than 9,11-CLA, is the anti-obesity isomer in this supplement (reviewed in Ref. 11). Potential mechanisms responsible for these anti-obesity properties of 10,12-CLA include: 1) decreasing energy intake or increasing energy expenditure (12–16), 2) decreasing lipogenesis or increasing lipolysis (17–20), 3) decreasing adipogenesis or increasing delipidation (21–25), and 4) increasing adipocyte apoptosis (26–28).
There is, however, concern about potential adverse side effects of CLA supplementation, including lipodystrophy (28), steatosis (29), macrophage infiltration to white adipose tissue (WAT (5)), and insulin resistance (9, 30–32). For example, the 10,12-isomer of CLA increases insulin resistance (33) and markers of oxidative stress (e.g. isoprostaglandin (iso-PG) F2α) and atherosclerosis (e.g. C-reactive protein (34)) in obese men with metabolic syndrome. Consistent with these data, CLA supplementation (i.e. equal levels of 9,11- and 10,12-isomers) adversely affects insulin and glucose metabolism in patients with type 2 diabetes (35). More recently, it was reported that supplementing postmenopausal women with an equal mixture of 10,12- and 9,11-CLA increases serum triglyceride (TG) levels, C-reactive protein, plasminogen activator inhibitor-1, and urinary levels of iso-PGF2α compared with treatment with the 9,11-isomer alone (32). Furthermore, insulin and tumor necrosis factor-α levels were elevated in the serum and WAT, respectively, of women consuming the CLA mixture compared with the olive oil control subjects (9).
Similarly, we have demonstrated that 10,12-CLA, but not 9,11-CLA, decreases the TG content of primary cultures of newly differentiated human adipocytes (18, 19, 23, 25). However, 10,12-CLA increases the expression levels of genes and proteins linked to chronic inflammation in these cultures, resulting in adverse metabolic consequences such as insulin resistance (23, 25, 36, 37). Indeed, chronic inflammation driven by NF-κB and specific mitogen-activated protein kinases (MAPK) antagonize peroxisome proliferator-activated receptor-γ (PPARγ) activity, thereby suppressing the transcriptional activation of genes needed for glucose and fatty acid uptake and conversion to lipids. Consistent with these data, we have demonstrated that 10,12-CLA suppression of PPARγ activity and target gene expression is linked to the activation of extracellular signal-related kinase (ERK)1/2 (23, 37) and NF-κB (36). Therefore, 1) the effective and safe use of CLA for weight loss or maintenance remains unclear, 2) the precise mechanism by which 10,12-CLA promotes inflammation and delipidation is unknown, and 3) the cell type in our primary cultures of human adipocytes responsible for mediating the inflammatory effects of CLA is unknown. To better understand the connection between inflammation and delipidation induced by CLA in our cultures, it is important first to identify the cell type in our cultures that is responsible for initiating the inflammatory effects of CLA. Thus, the objective of this research was to identify the role that preadipocytes versus adipocytes play in mediating 10,12-CLA-mediated inflammation in primary cultures of newly differentiated human adipocytes.
EXPERIMENTAL PROCEDURES
Materials and Models
Materials
All cell cultureware and Hyclone fetal bovine serum were purchased from Fisher Scientific. Adipocyte medium (AM-1) was purchased from Zen-Bio. Isomers of CLA (+98% pure) were purchased from Matreya (Pleasant Gap, PA). Lightning chemiluminescence substrate was purchased from PerkinElmer Life Science. Immunoblotting buffers and precast gels were purchased from Invitrogen. Primary antibodies for rabbit polyclonal phospho-p44/42 (Thr-202/Tyr-204, catalog No. 9101), p44/p42 (catalog No. 9102), phospho-SAPK/JNK (c-Jun-NH2-terminal kinase; Thr-183/Tyr-185, catalog No. 9251), SAPK/JNK (catalog No. 9252), phospho-c-Jun (Ser-63, catalog No. 9261S), phospho-STAT3 (Tyr-705, 3E2, catalog No. 9138), STAT3 (catalog No. 9139), c-Jun (60AB, catalog No. 9165), and p38 (catalog No. 9217) were purchased from Cell Signaling Technologies (Beverly, MA). Mouse monoclonal phospho-p38 (pT180/pY182, catalog No. 612280) was purchased from BD Transduction Laboratories (San Jose, CA). The primary antibodies for activating transcription factor 3 (ATF3; C-19, catalog No. sc-188) and glyceraldehyde-3-phosphate dehydrogenase (GAPDH; sc20357) were purchased from Santa Cruz Biotechnology (Santa Cruz, CA). Gene expression assays for interleukin-1β (IL-1β), IL-8, IL-6, cyclooxygenase-2 (COX-2), adiponectin (apm1), adipocyte-specific fatty acid-binding protein (aP2), adipocyte enhancer-binding protein-1 (AEBP-1), GAPDH, and monocyte chemoattractant protein-1 (MCP-1) were purchased from Applied Biosystems Inc. (Foster City, CA). PicoGreen reagent was purchased from Molecular Probes (Eugene, OR). BioPlex singleplex assays for IL-6 and IL-1β were purchased from Bio-Rad. Recombinant human IL-6 was purchased from Fitzgerald Industries Int. (Concord, MA). Monoclonal anti-human IL-6 antibody (Ab) was purchased from R&D Systems (Minneapolis, MN). PGF2α and AL-8810 were purchased from Cayman Chemical (Ann Arbor, MI). All other chemicals and reagents were purchased from Sigma unless otherwise stated.
Cell Culture Models
Abdominal WAT was obtained from non-diabetic Caucasian and African American females between the ages of 20 and 50 years with a body mass index ≤ 32.0 who had undergone elective surgery as described previously (23). These selection criteria allow for reduced variation in gender, age, and obesity status. Institutional Review Board approval was granted through the University of North Carolina at Greensboro and the Moses H. Cone Memorial Hospital. Stromal vascular (SV) cells from human WAT were isolated via collagenase digestion and subsequently grown as described previously (23). CLA was administered at a physiological level of 50 μm. Each experiment was repeated at least twice using a mixture of cells from at least three different subjects unless otherwise indicated.
Because our previous CLA studies had been conducted in primary cultures of human adipocytes containing ∼50% preadipocytes and 50% adipocytes (36), we did not know which cells were instigating inflammation or insulin resistance in response to CLA treatment. To better understand the extent to which preadipocytes and adipocytes initiated inflammation in these cultures, we developed four distinct cell models described below.
Model 1, Differentiation Model
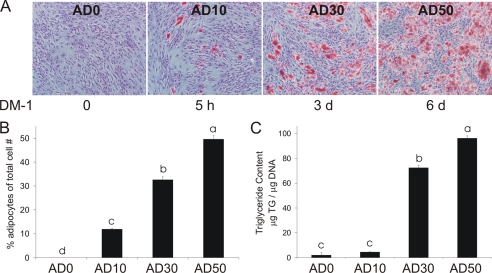
Four human (pre)adipocyte cell models containing ∼0, 10, 30, and 50% adipocytes (i.e. AD0, AD10, AD30, and AD50) were established by modulating exposure to differentiation medium (DM-1) containing 250 μm isobuthylmethylxanthine and 1 μm rosiglitazone (BRL49653; a PPARγ agonist generously provided by Dr. Per Sauerberg at Novo Nordisk A/S, Copenhagen, Denmark). SV cells were seeded into 35-mm dishes at 4 × 10⁴ cells/cm2. AD0 cultures received no treatment with DM-1 for 8 d. AD10, AD30, and AD50 cultures were supplemented with DM-1 for 5 h, 3 d, or 6 d, respectively (Fig. 1A). Cells were treated with 50 μm 10,12-CLA for 12 h and harvested on day 8. For MAPK and activating protein-1 (AP-1) activation shown in Fig. 3, cells were treated for 6, 12, and 24 h.
FIGURE 1.
The percentage of lipid-filled adipocytes increases with the duration of DM-1 supplementation. Four human (pre)adipocyte cell models containing ∼ 0, 10, 30, and 50% adipocytes were established by modulating exposure to DM-1. AD0 cultures received no DM-1 for 8 d AD10, AD30, and AD50 cultures were supplemented with DM-1 containing 1 μm BRL and 250 μm isobuthylmethylxanthine for 5 h, 3 d, or 6 d, respectively. A, on days 9 and 10, cells were fixed with Baker's formalin, stained with ORO to detect adipocytes, and counterstained with Mayer's hematoxylin to detect nondifferentiated cells. Three pictures/well were taken, each of a different field. B, the total number of cells stained with ORO was counted and expressed as a percentage of total cell number. C, TG content was determined using a colorimetric assay. Data are expressed as μg of TG/μg of DNA. The data in A–C are representative of three independent experiments. Means ± S.E. not sharing a common superscript (a–d) differ significantly (p < 0.05).
FIGURE 3.
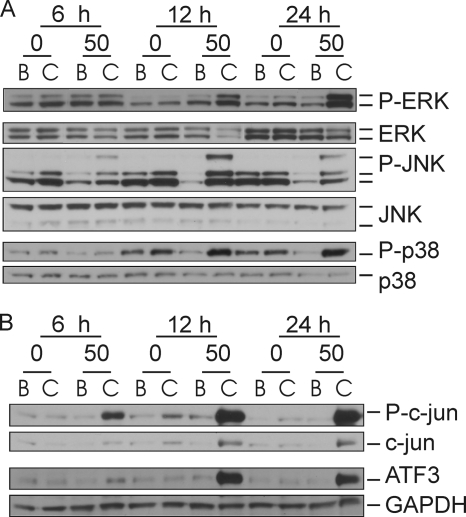
Time-dependent increase in the activation of MAPK and transcription factors in AD50 versus AD0 cultures treated with 10,12-CLA. AD0 and AD50 cultures were treated with 50 μm 10,12-CLA (C lanes) or BSA (B lanes) control for 6, 12, or 24 h. Cells were harvested and analyzed for protein expression via immunoblot. Membranes were probed with antibodies targeting phosphorylated and total ERK, JNK, and p38 (A) and P-c-Jun, c-Jun, ATF3, and GAPDH (n = 2) (B). The data in both panels are representative of three independent experiments.
Model 2, Cell Separation Model
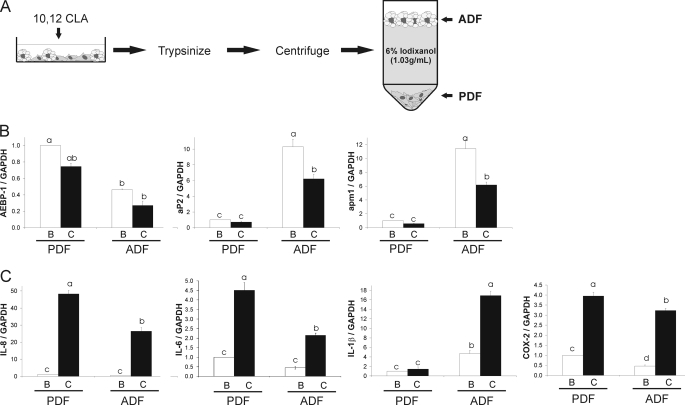
SV cells were grown in 100-mm dishes containing ∼3 million cells and were differentiated to ∼30% adipocytes (AD30). On day 8, cells were treated with 50 μm 10,12-CLA or BSA vehicle for 12 h (Fig. 4). Cells were washed with Hanks' balanced salt solution (HBSS) containing 0.5 mm EDTA and trypsinized with trypsin-like enzyme at 37 °C for 10 min. Cells were layered on 6% iodixanol (Optiprep, Axis-Shield, Oslo, Norway; ∼1.03 g/ml) in HBSS containing 0.5% BSA in a 15-ml centrifuge tube and centrifuged at 650 × g for 20 min at 4 °C. The floating adipocytes were collected from the top of the tube, placed in a 1.5-ml microcentrifuge tube, resuspended in HBSS, and recentrifuged for 5 min at 5000 × g to remove any cell debris. The remaining supernatant was removed, and the SV cells were collected from the pellet and transferred to a microcentrifuge tube. TriReagent was added to each tube for RNA extraction.
FIGURE 4.
10,12-CLA induces inflammatory gene expression in the PDF and ADF fractions of newly differentiated primary human adipocytes. A, human SV cells were supplemented with DM-1 for 3 d yielding cultures containing ∼30% adipocytes (AD30). Cultures were treated with 50 μm 10,12-CLA or BSA vehicle for 12 h and then fractionated using 6% iodixanol (1.03 g/ml). The lipid-laden ADF was floated, and the PDF was pelleted. B, fractionations were verified by measuring gene expression of AEBP-1, aP2, GAPDH and apm1 using qPCR. C, relative mRNA expression of IL-8, IL-1β, COX-2, GAPDH and ATF3 were investigated using qPCR. Data in B and C were normalized to BSA vehicle in the PDF. Means ± S.E. (n = 3) not sharing a common superscript (a–d) differ significantly (p < 0.05). The data in B and C are representative of three independent experiments.
Model 3, Co-culture Insert Model
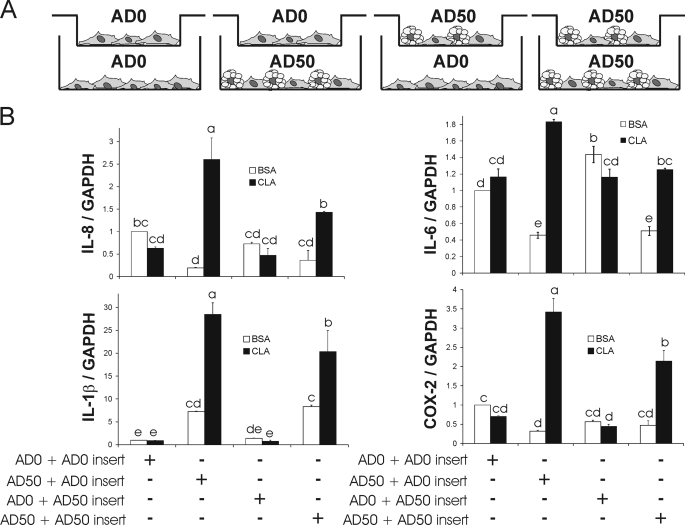
SV cells were seeded in cell culture inserts seeded with 0.2 million cells/insert and in 6-well Multiwell™ plates seeded at 4 × 10⁴ cells/cm2. Inserts and wells received either AM-1 until day 8 to achieve AD0 cultures or DM-1 for 6 d to achieve AD50 cultures. At day 8 of differentiation, inserts were transferred over underlying wells, and a recovery period of ∼15 h was allotted to allow for a decrease in potential stress due to the transfer (Fig. 5). Next, both wells and inserts were supplemented with 50 μm 10,12-CLA or BSA vehicle control for 12 h, and inflammatory gene expression was measured via qPCR in cultures harvested from the underlying wells.
FIGURE 5.
10,12-CLA-induced inflammatory gene expression is greatest in AD50 cultures in the presence of AD0-containing inserts. A, inserts containing either preadipocytes (AD0) or preadipocytes and adipocytes (AD50) were suspended over 6-well plates containing either AD0 or AD50 cultures. B, next, both wells and inserts were supplemented with 50 μm 10,12-CLA or BSA vehicle control for 12 h, and inflammatory gene expression in the cells in the underlying wells was subsequently analyzed via qPCR. Means ± S.E. (n = 3) not sharing a common superscript (a–e) differ significantly (p < 0.05). The data are representative of two independent experiments.
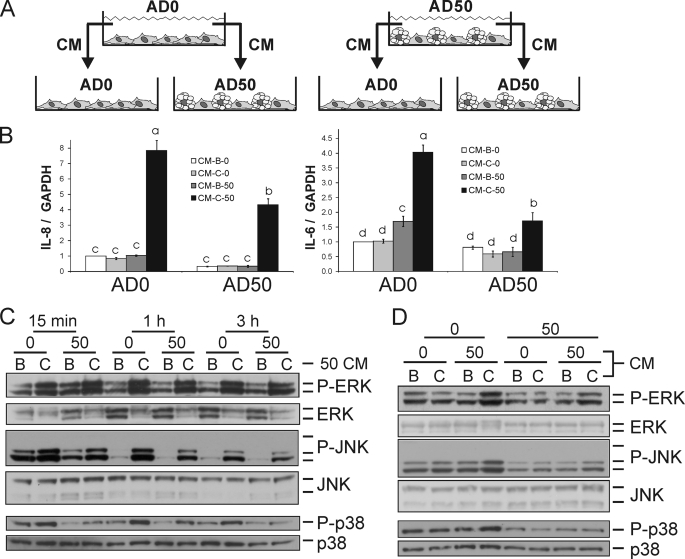
Model 4, Conditioned Medium (CM) Model
SV cells were seeded in 60-mm dishes at 4 × 10⁴ cells/cm2. Cultures received either AM-1 for 8 d or DM-1 for 6 d to achieve AD0 and AD50 cultures, respectively (Fig. 6). On day 8, cells were treated with 50 μm 10,12-CLA or BSA control for 24 h after which CM was collected and stored at −80 °C for subsequent experiments. Naive AD0 and AD50 cultures were treated with a 1:1 ratio of thawed CM and fresh AM-1 at day 8 of differentiation.
FIGURE 6.
CM from 10,12-CLA-treated AD50 cultures induces inflammatory genes and activates MAPK in naive AD0 and AD50 cultures. A, CM was collected from AD0 and AD50 cultures that were treated with 50 μm 10,12-CLA or BSA control for 24 h. A 1:1 ratio of CM to AM-1 was added to AD0 and AD50 cultures. B, next, cultures were treated with CM for 3 h and inflammatory genes and GAPDH were analyzed via qPCR. Means ± S.E. (n = 4) not sharing a common superscript (a–d) differ significantly (p < 0.05). C, AD0 and AD50 cultures were treated with AD50 CM for 15 min, 1 h, and 3 h. D, AD0 cultures were treated with AD50 and AD0 CM for 15 min. C and D, cells were harvested and analyzed for protein expression via immunoblotting. Membranes were probed with antibodies targeting phosphorylated and total ERK, JNK, and p38 (n = 2). AD0 or AD50 cultures were treated with CM collected from BSA or CLA-treated AD0 or AD50 cultures for 3 h (B). Next, gene expression was analyzed. AD0 and AD50 cultures were treated with CM collected from BSA or CLA-treated cultures for 15 min, 1 h, or 3 h (C). The data in B–D are representative of three independent experiments.
Methods
Lipid and Nuclear Staining and TG Content
Intracellular lipid and nuclei were visualized by staining cultures with ORO and Mayer's hematoxylin, respectively, as described previously (18). To establish the differentiation model, photomicrographs were taken using an Olympus microscope digital camera, model DP71, to provide micrographs of the degree of lipid accumulation in relation to nuclei in the cultures. In Fig. 1B, three fields were captured per well with three replicates per treatment group (i.e. AD0, AD10, AD30, and AD50). Therefore, a total of nine pictures were taken per treatment group. Data are expressed as the percentage of ORO-stained adipocytes to total cell number. TG levels were determined with a modified commercially available TG assay as described previously (19). To normalize the TG content, DNA was isolated using a DNeasy® blood and tissue kit (Qiagen, Valencia, CA) and then quantified using a Quant-iT™ PicoGreen® dsDNA assay kit (Invitrogen).
RNA Isolation and Quantitative PCR (qPCR)
RNA was isolated from cell cultures using TriReagent (Molecular Research Center, Cincinnati, OH) following the manufacturer's protocol for reverse transcription-PCR. For real-time qPCR, 2 μg of total RNA was used to generate first-strand cDNA using the Applied Biosystems high capacity cDNA archive kit. qPCR was performed using a 7500 Fast Real-time PCR System (Applied Biosystems) using TaqMan® Universal PCR Master Mix and TaqMan gene expression assays. To account for possible variation-related to cDNA input amounts or the presence of PCR inhibitors, the endogenous reference gene GAPDH was quantified simultaneously for each sample in separate wells of the same 96-well plate.
Immunoblotting
Immunoblotting was conducted as described previously using NuPage precast gels from Invitrogen (23).
Secretion of IL-6 and IL-8 via Multiplex Cytokine Assay
The concentrations of IL-6 and IL-8 were determined using the BioPlex® suspension array system from Bio-Rad following the manufacturer's protocol.
Quantification of PGE2 and PGF2
PGE2 and PGF2 were measured with a stable isotope dilution gas chromatographic/negative ion chemical ionization/mass spectrometric (GC/NICI/MS) assay (38). Briefly, PGE2-d4 (2.12 ng) and PGF2-d4 (0.84 ng) internal standards were added to the media samples. The samples were then acidified to pH 3.0 with 1 n HCl and extracted on a C18 Sep-Pak. PGE2 and PGF2 were eluted with ethyl acetate:heptane and evaporated under a stream of nitrogen (N2). PGE2 and PGF2 in methoxylamine solution were extracted with ethyl acetate and evaporated with N2. The pentafluorobenzyl esters were purified by TLC (PGF2 and PGE2 methyl esters were used as TLC standards) and converted to O-methyloxime pentafluorobenzyl ester trimethylsilyl derivatives, and PGE2 and PGF2 were dissolved in undecane that was dried over a bed of calcium hydride. GC/NICI/MS analysis was performed as described previously with the ions for PGE2 (m/z 526) and [4H2]PGE2 as the internal standard (m/z 528) and the ions for PGF2 (m/z 569) and [4H2]PGF2 as the internal standard (m/z 573).
Quantification of Isoprostanes (F2-IsoPs)
Total F2-IsoPs were measured by GC/MS with selective ion monitoring (39, 40). Briefly, cells were resuspended in 0.5 ml of methanol containing 0.005% butylated hydroxytoluene, sonicated, and then subjected to chemical saponification with 15% KOH to hydrolyze bound F2-IsoPs. The cell lysates were adjusted to a pH of 3.0 followed by the addition of 0.1 ng of 4H2-labeled 15-F2α-IsoP internal standard. F2-IsoPs were subsequently purified by C18 and silica Sep-Pak extraction and by TLC. They were then analyzed with pentafluorobenzyl ester, a trimethylsilyl ether derivative, via GC/NICI/MS assay.
Lipolysis Assay
The release of [14C]oleic acid into CM was measured after a 3-, 9-, or 24-h treatment of (pre)adipocyte cultures with 10,12-CLA or BSA vehicle as described previously (20).
Statistical Analysis
Statistical analyses were performed for data in Figs. 1, B and C, and 9B using one-way ANOVA. Analyses were performed for data in Figs. 2, 4, B and C, 5B, 6B, 7, 8A, and 9A using two-way ANOVA with interaction (JMP, version 6.03, SAS Institute). The data in Fig. 8B were analyzed by a multifactor ANOVA with interaction. Student's t tests were used to compute individual pairwise comparisons of least square means (p < 0.05). Data are expressed as the means ± S.E. The number of replicates and independent experiments varies with each outcome.
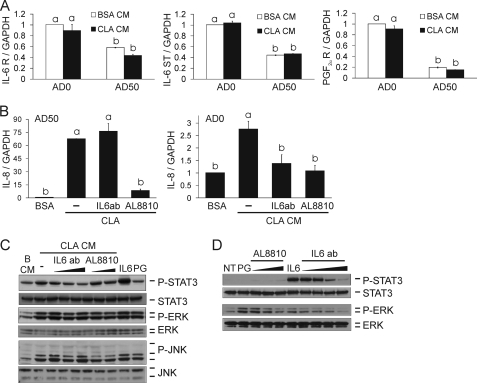
FIGURE 9.
IL-6-neutralizing Ab, PGF2α analog, and FP prostanoid receptor antagonist AL-8810 attenuate CLA CM-induced IL-8 gene expression and P-STAT3 levels. A, AD0 and AD50 cultures treated with BSA or CLA CM at a 1:1 ratio of CM to AM-1 for 3 h were analyzed for IL-6 receptor (R), IL-6 signal transducer (ST), GAPDH, and PGF2α receptor expression via qPCR. B, AD50 cultures were pretreated with 0.01 μg/ml IL-6 Ab or 50 μm AL-8810 for 30 min and then treated with 50 μm 10,12-CLA or BSA vehicle for 24 h after which IL-8 mRNA levels were measured. Next, AD0 cultures were treated with AD50 CM for 3 h, and IL-8 mRNA levels were measured. C, AD50 cultures were pretreated with 0.01, 0.1, and 1 μg/ml IL-6 Ab or 1 and 10 μm AL-8810 for 30 min. Then cultures were treated with 50 μm 10,12-CLA or BSA vehicle for 24 h after which CM was collected and added to AD0 cultures for 1 h. Cultures were treated with 0.1 μg/ml recombinant human IL-6 and 10 μm PGF2α (PG) for 30 min as positive controls. D, AD0 cultures were untreated (NT) or pretreated with 0.01, 0.1, 1, or 10 μg/ml IL-6 Ab or 0.5, 5, or 50 μm AL-8810 for 30 min and then treated with 0.1 μg/ml recombinant human IL-6 or 10 μm PGF2α for 30 min, respectively. C and D, cells were harvested and analyzed for levels of phosphorylated and total STAT3, ERK, or JNK via immunoblotting. Means ± S.E. (A, n = 3; B–D, n = 2–3) not sharing a common superscript (a–b) differ significantly (p < 0.05). The data in all panels are representative of three independent experiments. NT, no treatment; PG, PGF2α.
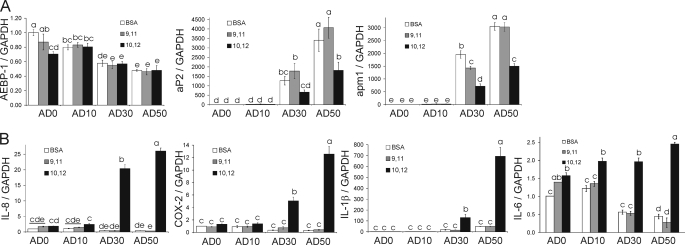
FIGURE 2.
10,12-CLA-induction of inflammatory gene expression increases as the degree of differentiation increases. Using the differentiation model, each experimental group (i.e. AD0, AD10, AD30, and AD50) was treated with BSA vehicle, 50 μm 10,12-CLA, or 50 μm 9,11-CLA as a positive control for 12 h. A, cells were harvested for RNA extraction, and mRNA analyses were done via qPCR on day 9 for subsequent marker gene analyses to verify increases in adipocyte number with increasing duration of DM-1 treatment. B, inflammatory genes increased by 10,12-CLA compared with 9,11-CLA and BSA controls. Data were normalized to BSA vehicle in AD0 cultures. Means ± S.E. (n = 3) not sharing a common superscript (a–e) are significantly different (p < 0.05). The data in both panels are representative of three independent experiments.
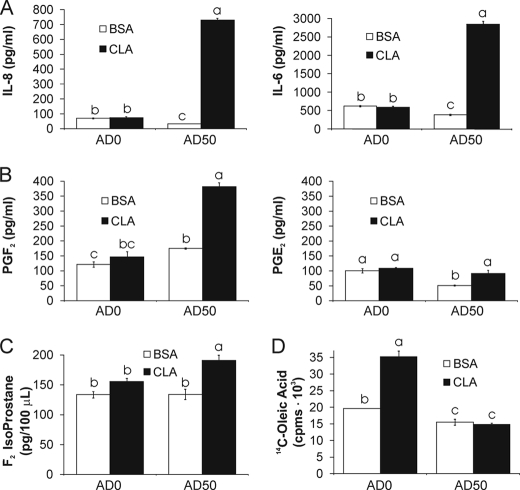
FIGURE 7.
10,12-CLA-treated AD50 cultures secrete adipocytokines and PGF2. Cells were treated with 50 μm 10,12-CLA or BSA control for 24 h. A, CM was collected, and IL-8 and IL-6 were measured in CM using the Bio-Rad BioPlex suspension array system. B, CM was collected, and PGF2 and PGE2 were measured using a stable isotope dilution GC/NICI/MS assay. C, cells were harvested in phosphate-buffered saline and total F2-isoprostanes were measured using GC/MS with selective ion monitoring. D, AD0 and AD50 cultures were treated with 20 μl of HBSS containing 12.5 nm [14C]oleic acid (0.2 μCi; specific activity = 40–60 mCi/mmol) for 12 h. The medium was removed, and cells were washed three times with HBSS containing 2% BSA. Subsequently, each well was treated with 250 μl of Dulbecco's modified Eagle's medium containing 50 μm 10,12-CLA or BSA + phloretin (a fatty acid uptake inhibitor) for 9 h. 200 μl of the medium was collected from each well and measured for [14C]oleic acid by scintillation counting. Means ± S.E. (A–C, n = 4; D, n = 3) not sharing a common superscript (a–c) differ significantly (p < 0.05). The data in A–C and in D are representative of two and three independent experiments, respectively.
FIGURE 8.
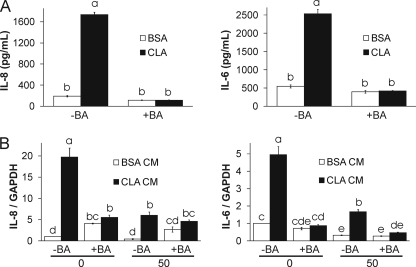
Brefeldin A (BA) prevents CM from 10,12-CLA AD50 cultures from inducing inflammatory gene expression. AD50 cultures were pretreated with 1 μg/ml brefeldin A for 1 h to prevent cytokine secretion and treated with 50 μm CLA or BSA for 24 h. A, IL-8 and IL-6 were measured in CM using the Bio-Rad suspension array system. B, CM was collected, and 1 ml was added to naive AD0 or AD50 cultures containing 1 ml of AM-1 (1:1 ratio) for 3 h; cells were harvested to measure inflammatory gene expression via qPCR. Means ± S.E. (A, n = 2; B, n = 3) not sharing a common superscript (a–e) differ significantly (p < 0.05). The data in A and B are representative of two and three independent experiments, respectively.
RESULTS
Model 1, Differentiation Model: Cell Types in Our Cultures
We had previously identified the predominate type of cells in our primary cultures of newly differentiated human adipocytes on the basis of marker analysis (41). Undifferentiated cultures lacking DM-1 supplementation consisted of preadipocytes (i.e.“+” for Pref-1 and “−” for aP2 and PPARγ). Differentiated cultures supplemented with DM-1 medium consisted of preadipocytes and adipocytes (i.e. + for Pref-1 or aP2 and PPARγ, respectively). None of the cells were positive for markers of myocytes (e.g. MyoD) or macrophages (e.g. CD-68, MAC-1). On the basis of these findings, undifferentiated cells (i.e. lacking aP2 or PPARγ expression, TG content, or visible lipid droplets) discussed in this article will be referred to as preadipocytes.
Percentage of Lipid-filled Adipocytes Increases as the Duration of DM-1 Treatment Increases
We had demonstrated previously in primary cultures of newly differentiated human adipocytes that 10,12-CLA promotes inflammatory signaling, insulin resistance, and delipidation (23, 25, 36, 37). We have also shown that preadipocytes are the primary instigators of inflammation and insulin resistance induced by lipopolysaccharide in our cultures (41). On the basis of these data, we originally hypothesized that preadipocytes would be the instigators of the inflammatory response to 10,12-CLA. To determine whether the preadipocytes or the adipocytes were responsible for 10,12-CLA-mediated inflammatory signaling, we developed a differentiation model in which various levels of differentiation were achieved as described under “Materials and Models.” As shown in Fig. 1A, the percentage of adipocytes stained with ORO relative to total cell number increased as the duration of DM-1 treatment increased from no treatment to 6 d of treatment. DM-1 untreated cultures showed no ORO-stained adipocytes, whereas cultures that received DM-1 treatment for 5 h, 3 d, or 6 d yielded ∼10, 30, or 50% ORO-stained adipocytes, respectively (Fig. 1B). Furthermore, TG content in AD30 and AD50 cultures was significantly greater than in AD0 or AD10 cultures (Fig. 1C). Therefore, by manipulating the duration of treatment with DM-1, a differentiation model was established that had four distinct levels of lipid-filled adipocytes in the cultures.
Adipocytes Play an Essential Role in 10,12-CLA-induced Inflammatory Gene Expression and the Activation of MAPK and AP-1 Subunits
Gene expression of preadipocyte (i.e. AEBP-1) and adipocyte (aP2 and adiponectin (apm1)) markers was analyzed to verify the levels of preadipocytes and adipocytes in each group of the differentiation model (Fig. 2A). The expression AEBP-1 was highest in the AD0 cultures and decreased as the level of differentiation increased. In contrast, the mRNA levels of aP2 and apm1 were lowest in the AD0 cultures and increased as the level of differentiation increased. Consistent with previous findings (23), 10,12-CLA attenuated aP2 and apm1 gene expression compared with BSA control in AD30 and AD50 cultures.
To determine which experimental group (i.e. AD0, AD10, AD30, or AD50) displayed the greatest level of inflammatory signaling in response to 10,12-CLA treatment, gene expression of inflammatory cytokines and COX-2 was analyzed. Cultures were treated with 50 μm 10,12-CLA, 9,11-CLA, or BSA vehicle for 12 h. These dose and time points were selected on the basis of previous time course and dose response studies conducted in our laboratory (25, 37). In contrast to previous findings with lipopolysaccharide as an inflammatory stimulant, 10,12-CLA treatment caused the greatest increase in the expression of IL-8, IL-6, IL-1β, and COX-2 in AD50 cultures compared with all other groups (Fig. 2B). The induction of these genes by 10,12-CLA was greater in AD50 compared with AD30 cultures. Furthermore, 10,12-CLA did not induce inflammatory genes in AD0 or AD10 cultures compared with BSA. Consistent with our previous findings (19, 23, 37), the inflammatory effect of CLA was specific to the 10,12-isomer, where 9,11-CLA did not induce inflammatory gene expression compared with BSA vehicle.
Given the role of MAPK and AP-1 in activating inflammatory gene expression during cellular stress, their activation by 10,12-CLA in AD50 versus AD0 cultures was examined. 10,12-CLA robustly increased the phosphorylation of ERK, JNK, and p38 at 12 and 24 h in AD50 versus AD0 cultures compared with BSA controls (Fig. 3A). Similarly, 10,12-CLA increased the levels of ATF3 and phospho (P)-c-Jun at 12 and 24 h in the AD50 cultures but not in the AD0 cultures, compared with BSA controls (Fig. 3B). Collectively, these data suggest that adipocytes are essential for 10,12-CLA-mediated activation of MAPK and transcription factors and the induction of genes associated with inflammation.
Model 2, Cell Separation Model: 10,12-CLA Induces Inflammatory Gene Expression in Adipocytes and Preadipocytes from Mixed Cultures
The cell separation model, as described under “Materials and Models” and shown in Fig. 4A, was used to demonstrate that adipocytes are responsible for the inflammatory response induced by 10,12-CLA in mixed cultures of preadipocytes and adipocytes. On day 8, cells were treated with 50 μm 10,12-CLA or BSA vehicle for 12 h and fractionated to yield a floating ADF and a pelleted PDF. The preadipocyte marker AEBP-1 was expressed at higher levels in the PDF compared with the ADF (Fig. 4B). Adipocyte-specific genes aP2 and apm1 were expressed at higher levels in the ADF compared with the PDF (Fig. 4B). As expected, 10,12-CLA decreased aP2 and apm1 gene expression in the ADF.
Surprisingly, the expression of IL-8, IL-6, and COX-2 induced by 10,12-CLA was greater than that of BSA vehicle controls in the PDF and the ADF (Fig. 4C). Thus, we hypothesized that the inflammatory response to 10,12-CLA in the PDF may have been due to cross-talk between adipocytes and preadipocytes prior to fractionation, as there was cell-to-cell contact in these mixed cultures (AD30) during the 12-h treatment with 10,12-CLA. Alternatively, it is possible that immature adipocytes contaminated the PDF. However, adipogenic gene expression was much greater in the ADF compared with the PDF, so the possibility that a significant number of adipocytes contaminated the PDF is unlikely. Thus, a third model was utilized to better understand 10,12-CLA-induced inflammatory gene expression and potential cross-talk between adipocytes and preadipocytes.
Model 3, Co-culture Insert Model: Preadipocytes Enhance the Inflammatory Response to 10,12-CLA in Adipocytes
To determine the extent to which adipocytes communicate with preadipocytes during 10,12-CLA treatment, AD0 and AD50 cultures were grown in inserts and suspended over underlying wells containing AD0 or AD50 cultures during treatment with 50 μm 10,12-CLA or BSA vehicle for 12 h (Fig. 5A). Gene expression was measured only in cells grown in underlying wells.
Consistent with the differentiation model, 10,12-CLA did not induce inflammatory gene expression in preadipocytes (AD0), regardless of whether preadipocyte (AD0 + AD0 insert) or adipocyte (AD0 + AD50 insert) inserts were suspended above them (Fig. 5B). Also consistent with the differentiation model, 10,12-CLA-induced inflammatory gene expression was greater in AD50 versus AD0 cultures. However, the mRNA levels of genes induced by 10,12-CLA were greatest in AD50 cultures when AD0-containing inserts were suspended above them (AD50 + AD0 insert) compared with when AD50 cultures were suspended above them (AD50 + AD50 inserts). These data suggest that the presence of preadipocytes enhanced the increase of inflammatory gene expression in AD50 cultures by 10,12-CLA treatment, once again suggesting cross-talk between preadipocytes and adipocytes. Therefore, a fourth model, the conditioned medium model, was implemented to clarify which cultures, AD50 or AD0, are responsible for 10,12-CLA-mediated inflammation.
Model 4, Conditioned Media Model: Adipocytes Secrete Inflammatory Signals That Activate Preadipocytes
This fourth model, as described under “Materials and Models” and shown in Fig. 6A, was developed to better understand the inflammatory capacity of adipocytes versus preadipocytes as well as the cross-talk between both cell types. It can be inferred from the co-culture insert model that cross-talk occurs between adipocytes and preadipocytes as evidenced by the increase in inflammatory gene expression in AD50 cultures when AD0-containing inserts were suspended above them. Data from the cell separation model also suggest that cross-talk occurs between adipocytes and preadipocytes. Therefore, we hypothesized that CM from 10,12-CLA-treated AD50, but not AD0 cultures, would promote inflammatory protein activation and gene expression in naive AD0 and AD50 cultures.
CM was collected from AD50 and AD0 cultures treated with 50 μm 10,12-CLA or BSA vehicle for 24 h. A 24-h time point was chosen on the basis of previous dose data showing that the secretion of IL-8, IL-6, and PGF2α by 24 h after 10,12-CLA treatment was greater than at earlier time points in mixed cultures (36, 37). As hypothesized, CM from 10,12-CLA-treated AD50 cultures increased IL-8 and IL-6 gene expression in naive AD50 and AD0 cultures (Fig. 6B). MCP-1 and ATF3 gene expression were also increased in naive AD0 and AD50 cultures by CM from 10,12-CLA-treated AD50 (data not shown). In contrast, CM from CLA-treated AD0 cultures did not increase inflammatory gene expression in naive AD50 or AD0 cultures. Notably, CM from 10,12-CLA-treated AD50 cultures caused a greater level of inflammatory gene expression in naive AD0 versus AD50 cultures.
Consistent with the data in Fig. 6B, CM from AD50 cultures treated with 10,12-CLA versus BSA vehicle increased P-ERK, P-JNK, and P-38 in naive AD0 and AD50 cultures (Fig. 6C). Next, we wanted to determine the extent to which CM from AD0 compared with CM from AD50 cultures treated with 10,12-CLA, impacted MAPK phosphorylation. As hypothesized, CM from AD50 cultures increased phosphorylated ERK, JNK, and p38, particularly in naive AD0 cultures compared with naive AD50 cultures (Fig. 6D). In contrast, CM from AD0 cultures did not increase the levels of P-ERK, P-JNK, or P-p38 in either set of cultures. Collectively, these data suggest that 10,12-CLA selectively activates adipocytes that secrete inflammatory adipocytokines, PGs, or free fatty acids that signal to preadipocytes, resulting in increased inflammatory protein activation and gene expression in preadipocytes.
Therefore, we wanted to identify inflammatory candidates in the CM from cultures treated with 10,12-CLA. IL-6 and IL-8 levels (Fig. 7A) as well as PGF2 and PGE2 (Fig. 7B) were higher in CM from 10,12-CLA-treated AD50 cultures but not in AD0 cultures compared with BSA controls. However, the increase in PGE2 in AD50 cultures was not higher than the basal levels found in AD0 cultures. Consistent with the PGF2 data, F2-IsoP levels were higher in AD50 cultures treated with 10,12-CLA compared with BSA controls (Fig. 7C).
Because of the role that elevated free fatty acids play in inducing inflammation and insulin resistance, we suspected that 10,12-CLA-mediated lipolysis might also contribute inflammatory free fatty acids to the CM. Surprisingly, 10,12-CLA treatment increased [14C]oleic acid release from AD0 cultures at 9 h (Fig. 7D) and 24 h (data not shown) but had no effect on AD50 cultures. These data suggest that 10,12-CLA-driven lipolytic activity does not contribute to the inflammatory capacity of AD50 CM.
To determine whether adipocytokines are necessary for the inflammatory capacity of AD50 CM, AD50 cultures were pretreated with 1 μg/ml brefeldin A for 1 h to prevent cytokine secretion by inhibiting protein transport from the endoplasmic reticulum to the Golgi apparatus. Subsequently, cultures were treated with 50 μm CLA or BSA for 24 h after which CM was collected and added to naive AD0 or AD50 cultures (at a 1:1 ratio) for 3 h; then cells were harvested to measure inflammatory gene expression. As hypothesized, brefeldin A (BA) pretreatment prevented CLA-mediated adipocytokine secretion (Fig. 8A). Furthermore, pretreatment with brefeldin A prevented AD50 CM-mediated increases of IL-8 and IL-6 mRNA levels in AD0 and AD50 cultures (Fig. 8B). Similar effects were found for MCP-1 and ATF-3 gene expression (data not shown).
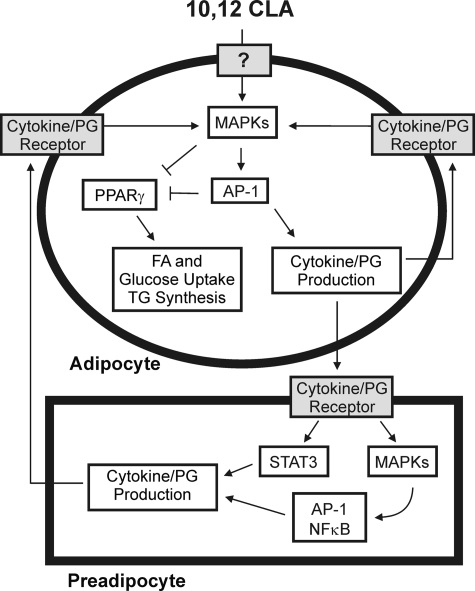
To more specifically identify inflammatory adipocytokines or PGs responsible for mediating inflammatory signaling in AD0 cultures, IL-8, IL-6, and PGF2α were targeted for further investigation. IL-8 α and β receptors, IL-6 receptor and signal transducer, and PGF2α receptor expression were measured in our primary cultures of human preadipocytes. Consistent with a previous report (42), IL-8 α and β receptors were undetectable in human preadipocytes (data not shown). Interestingly, IL-6 receptor and signal transducer and PGF2α receptor expression were higher in AD0 versus AD50 cultures (Fig. 9A). Consequently, AD50 cultures were pretreated with an IL-6-neutralizing Ab or the FP prostanoid receptor antagonist AL-8810 for 30 min and subsequently treated with 10,12-CLA or BSA vehicle for 24 h. First, AD50 cultures were analyzed for inflammatory mRNA levels. Whereas there was no effect of 0.01 μg/ml IL-6 Ab on IL-8 mRNA levels, 50 μm AL-8810 prevented CLA induction of IL-8 in AD50 cultures (Fig. 9B). Next, CM from these cultures was collected and added to AD0 cultures at a 1:1 ratio after which IL-8 gene expression was measured at 3 h and P-STAT3, P-ERK, and P-JNK levels were measured at 1 h. IL-6-neutralizing Ab and AL-8810 attenuated IL-8 gene expression (Fig. 9B) but not other inflammatory genes induced by CLA CM, including IL-6 and MCP-1 (data not shown). Neutralizing IL-6 attenuated P-STAT3 levels in a dose-dependent manner (Fig. 9C). However, only 0.1 μg/ml IL-6-neutralizing Ab modestly attenuated P-ERK and P-JNK levels increased by CLA CM. As expected, AL-8810 had no effect on P-STAT3 levels, but 10 μm AL-8810 reduced P-JNK levels and modestly reduced P-ERK levels (Fig. 9C). The specificity of the IL-6-neutralizing Ab and AL-8810 was confirmed (Fig. 9D). The IL-6 Ab dose-dependently reduced IL-6-mediated increases in P-STAT3 and P-ERK levels, and AL-8810 dose-dependently reduced PGF2α-mediated increases in P-ERK levels. These data suggest that IL-6 and PGF2α contribute, in part, to the inflammatory capacity of CLA CM from AD50 cultures. Taken together, these data imply that adipocytes instigate the inflammatory response to 10,12-CLA treatment in newly differentiated cultures of primary human adipocytes, which in turn activate inflammatory pathways in neighboring preadipocytes (Fig. 10).
FIGURE 10.
Working model. Treating primary cultures of newly differentiated human adipocytes with 10,12-CLA increases the phosphorylation of MAPK (i.e. ERK 1/2, JNK, and p38) and the activation of the transcription factor AP-1 (i.e. c-Jun, c-Fos, ATF2, and ATF3), which leads to the production of inflammatory cytokines and PGs (i.e. PGE2 and PGF2) through up-regulation of inflammatory genes (i.e. COX-2, IL-1β, IL-8, and ATF3). These inflammatory signals subsequently activate preadipocytes leading to inflammatory cytokine secretion from preadipocytes, thus continuing the inflammatory cycle. Furthermore, activation of STAT3, MAPK, and AP-1 by 10,12-CLA antagonizes PPARγ and associated target genes, ultimately leading to delipidation through decreased glucose and fatty acid uptake and decreased TG content in adipocytes.
DISCUSSION
Interpretation of Data from the Four Cell Models
We have demonstrated, using four experimental models, that adipocytes are the instigators of 10,12-CLA-induced inflammation in primary cultures of newly differentiated human adipocytes. Data from the differentiation model showed that 10,12-CLA-induced inflammatory signaling was greater in differentiated cultures (AD10–50) compared with undifferentiated cultures (AD0) as evidenced by increased expression of inflammatory genes and phosphorylation of MAPK and AP-1. Results from the cell separation model suggest that adipocytes signal to preadipocytes during treatment with 10,12-CLA in mixed cultures (AD30), as there was an increase in inflammatory gene expression in the PDF, yet no induction of inflammatory genes in cultures containing only preadipocytes (AD0), as shown in the differentiation model and the co-culture insert model. Next, it was demonstrated in the co-culture insert model that not only are adipocytes required for an inflammatory response to CLA but that preadipocytes also enhance the inflammatory response in differentiated cultures to 10,12-CLA treatment. Finally, using the conditioned medium model, we demonstrated that CM from differentiated cultures (AD50), but not from undifferentiated cultures (AD0), treated with 10,12-CLA yielded bioactive CM containing inflammatory adipocytokines and PGs that promote increased inflammatory signaling in naive (pre)adipocytes. Notably, CM from the differentiated cultures caused greater increases in inflammatory gene expression in preadipocytes (AD0) versus adipocytes (AD50). Blocking adipocytokine release with brefeldin A prevented CLA CM induction of IL-6, IL-8, and MCP-1. Moreover, neutralizing IL-6 and blocking the PGF2α receptor attenuated CLA CM-induced IL-8 gene expression or STAT3 phosphorylation in preadipocytes. However, other genes induced by CLA CM, including IL-6 and MCP-1, were not affected. Therefore, IL-6 and PGF2α may be key factors in the contribution of CM to the inflammatory response in preadipocytes, but it is not likely that they are solely responsible. Further investigation is needed to determine other important inflammatory mediators in CLA CM and the potential synergism of these bioactive factors. Taken together, these studies show that adipocytes are the main initiators of 10,12-CLA-mediated inflammatory signaling in primary cultures of newly differentiated human adipocytes.
Cell Types in WAT and Their Inflammatory Capacity
Adult human WAT has been reported to contain ∼50–70% adipocytes, ∼20–40% preadipocytes, and ∼1–30% infiltrated macrophages (43, 44). These percentages depend on body composition and age. For example, it has been reported that the WAT of lean women contains ∼30% preadipocytes, whereas the WAT of obese women contains only 17% preadipocytes (45). However, the localization and secretory pattern of cytokines in WAT are unknown. Some researchers suggest that nonfat cells such as macrophages are the key players in cytokine release from adipose tissue (46, 47). According to Fain et al. (46), nonfat cells are responsible for up to 90% of the adipokine release from WAT compared with mature adipocytes. These samples, obtained from obese women directly after undergoing bariatric surgery, were analyzed for basal levels of inflammatory markers. Similarly, results from our laboratory suggest that 10,12-CLA-mediated cytokine release is predominately from SV cells freshly isolated from human subcutaneous WAT as opposed to cultured newly differentiated adipocytes (23, 36). However, this heterogeneous mixture of SV cells had never been exposed to AM-1 for 6–12 d as in the current study. Thus, we do not know if these SV cultures contained cells other than preadipocytes (i.e. macrophages), which may respond differently to CLA.
In contrast to these studies, our current results show that cultured preadipocytes grown in adipocyte media do not secrete adipocytokines in response to 10,12-CLA treatment, suggesting that the microenvironment of cultured (pre)adipocytes may affect experimental outcomes. For example, it has been proposed that adipocyte size is an important determinant of adipokine secretion, where proinflammatory cytokine secretion (i.e. IL-6, IL-8, MCP-1, or tumor necrosis factor-α) was higher from large adipocytes compared with smaller adipocytes (48). Interestingly, Suganami et al. (49, 50) reported that activated hypertrophied adipocytes release saturated free fatty acids that subsequently promote tumor necrosis factor-α secretion from macrophages, leading to an inflammatory cycle in adipose tissue. Taken together, these results suggest that the differences in the inflammatory capacity of preadipocytes, adipocytes, or other inflammatory cells such as macrophages in WAT may be due to 1) the type of inflammatory stimuli employed, 2) the microenvironment of cultures, 3) adipocyte size, 4) degree of adiposity, or 5) cross-talk with other cell types.
Shortcomings of Cell Models
Because we used primary SV cells, it was difficult to achieve fully differentiated cultures containing 100% adipocytes (AD100). Our greatest level of differentiation was ∼50% adipocytes (AD50) on days 8–12. Therefore, it was difficult to clearly ascertain the function of adipocytes alone, being that preadipocytes are always present in our cultures. The cell separation model provided us the ability to analyze inflammatory gene expression separately from each fraction. However, these cells had direct cell-to-cell contact during treatment. The insert model provided an environment in which these cells were not in direct contact. Yet, the most differentiated cultures still contained ∼50% preadipocytes. Therefore, future studies are needed to determine the effect of CLA on pure cultures of mature adipocytes. This could be achieved by 1) developing a more effective differentiation mixture, 2) using freshly isolated floating adipocytes during the isolation of SV cells, or 3) using fully differentiated cultures of murine 3T3-L1 adipocytes. Another challenge in using primary human adipocytes is that the degree of differentiation varied between experiments.
Although there are some limitations in using primary cultures, our model of primary cultures of newly differentiated human adipocytes is a particular strength because of its direct application to (pre)adipocytes in human WAT compared with using animal (pre)adipocytes or cell lines of adipocytes. This model also allowed us to examine the direct effects of CLA on cross-talk between preadipocytes and adipocytes as occurs in vivo and their impact on cell signaling, gene expression, and metabolism.
Implications
The results presented in this article clearly show that adipocytes are essential for the inflammatory response to CLA. On the basis of these studies, we propose that treating primary cultures of newly differentiated human adipocytes with 10,12-CLA increases the phosphorylation of MAPK (i.e. ERK 1/2, JNK, and p38) and the activation of the transcription factor AP-1 (i.e. c-Jun and ATF3), which leads to the production of inflammatory adipocytokines and PGs through up-regulating inflammatory genes (i.e. COX-2, IL-6, IL-1β, IL-8, MCP-1, and ATF3). These inflammatory signals subsequently activate preadipocytes, leading to inflammatory cytokine secretion from preadipocytes, thus continuing the inflammatory cycle. These studies are expected to lead to the discovery of the earliest mechanism by which 10,12-CLA causes adipocyte delipidation. As a consequence, it will enable researchers to determine the potentially safe and effective use of CLA as a dietary strategy to promote weight loss.
Acknowledgments
We are very grateful to Dr. Susanne Mandrup and Søren Schmidt, University of Southern Denmark, for providing guidance in the development of this manuscript.
This work was supported, in whole or in part, by National Institutes of Health Grants 5R01 DK063070-07 (to M. M.) and F31DK084812-01 (to K. M.). This work was also supported by North Carolina Agricultural Research Service Grant NCARS 06771 (to M. M.).
- CLA
- conjugated linoleic acid
- 10,12-CLA
- trans-10,cis-12-conjugated linoleic acid
- 9,11-CLA
- cis-9,trans-11-conjugated linoleic acid
- Ab
- antibody
- ADF
- adipocyte fraction
- AEBP
- adipocyte enhancer-binding protein
- AM
- adipocyte medium
- ANOVA
- analysis of variance
- AP-1
- activating protein-1
- ATF
- activating transcription factor
- BSA
- bovine serum albumin
- CM
- conditioned medium
- COX
- cyclooxygenase
- d
- day
- DM
- differentiation medium
- ERK
- extracellular signal-related kinase
- GC
- gas chromatography
- HBSS
- Hanks' balanced salt solution
- IL
- interleukin
- IsoP
- isoprostane
- JNK
- c-Jun-NH2-terminal kinase
- MAPK
- mitogen-activated protein kinase
- MS
- mass spectrometry
- MCP
- monocyte chemoattractant protein
- NICI
- negative ion chemical ionization
- ORO
- oil red O
- P-
- phosphorylated
- preadipocyte fraction
- PPARγ
- peroxisome proliferator-activated receptor-γ
- PG
- prostaglandin
- qPCR
- quantitative PCR
- SAPK
- stress-activated protein kinase
- STAT
- signal transducers and activators of transcription
- SV
- stromal vascular
- TG
- triglyceride
- WAT
- white adipose tissue
- GAPDH
- glyceraldehyde-3-phosphate dehydrogenase.
REFERENCES
- 1.Khan L., Sobush K., Keener D., Goodman K., Lowry A., Kakietek J., Zaro S. (2009) MMWR Recomm. Rep. 58, 1–26 [PubMed] [Google Scholar]
- 2.Park Y., Storkson J. M., Albright K. J., Liu W., Pariza M. W. (1999) Lipids 34, 235–241 [DOI] [PubMed] [Google Scholar]
- 3.Terpstra A. H., Beynen A. C., Everts H., Kocsis S., Katan M. B., Zock P. L. (2002) J. Nutr. 132, 940–945 [DOI] [PubMed] [Google Scholar]
- 4.Bhattacharya A., Rahman M. M., Sun D., Lawrence R., Mejia W., McCarter R., O'Shea M., Fernandes G. (2005) J. Nutr. 135, 1124–1130 [DOI] [PubMed] [Google Scholar]
- 5.Poirier H., Shapiro J. S., Kim R. J., Lazar M. A. (2006) Diabetes 55, 1634–1641 [DOI] [PubMed] [Google Scholar]
- 6.Banu J., Bhattacharya A., Rahman M., Fernandes G. (2008) J. Bone. Miner. Metab. 26, 436–445 [DOI] [PubMed] [Google Scholar]
- 7.Steck S. E., Chalecki A. M., Miller P., Conway J., Austin G. L., Hardin J. W., Albright C. D., Thuillier P. (2007) J. Nutr. 137, 1188–1193 [DOI] [PubMed] [Google Scholar]
- 8.Gaullier J. M., Halse J., Høivik H. O., Høye K., Syvertsen C., Nurminiemi M., Hassfeld C., Einerhand A., O'Shea M., Gudmundsen O. (2007) Br. J. Nutr. 97, 550–560 [DOI] [PubMed] [Google Scholar]
- 9.Raff M., Tholstrup T., Toubro S., Bruun J. M., Lund P., Straarup E. M., Christensen R., Sandberg M. B., Mandrup S. (2009) J. Nutr. 139, 1347–1352 [DOI] [PubMed] [Google Scholar]
- 10.Norris L. E., Collene A. L., Asp M. L., Hsu J. C., Liu L. F., Richardson J. R., Li D., Bell D., Osei K., Jackson R. D., Belury M. A. (2009) Am. J. Clin. Nutr. 90, 468–476 [DOI] [PMC free article] [PubMed] [Google Scholar]
- 11.Kennedy A., Martinez K., Schmidt S., Mandrup S., LaPoint K., McIntosh M. (2010) J. Nutr. Biochem. 21, 171–179 [DOI] [PMC free article] [PubMed] [Google Scholar]
- 12.West D.B., Blohm F. Y., Truett A. A., DeLany J. P. (2000) J. Nutr. 130, 2471–2477 [DOI] [PubMed] [Google Scholar]
- 13.Nagao K., Wang Y. M., Inoue N., Han S. Y., Buang Y., Noda T., Kouda N., Okamatsu H., Yanagita T. (2003) Nutrition 19, 652–656 [DOI] [PubMed] [Google Scholar]
- 14.House R. L., Cassady J. P., Eisen E. J., Eling T. E., Collins J. B., Grissom S. F., Odle J. (2005) Physiol. Genomics 21, 351–361 [DOI] [PubMed] [Google Scholar]
- 15.Close R. N., Schoeller D. A., Watras A. C., Nora E. H. (2007) Am. J. Clin. Nutr. 86, 797–804 [DOI] [PubMed] [Google Scholar]
- 16.So M. H., Tse I. M., Li E. T. (2009) J. Nutr. 139, 145–151 [DOI] [PubMed] [Google Scholar]
- 17.Brodie A. E., Manning V. A., Ferguson K. R., Jewell D. E., Hu C. Y. (1999) J. Nutr. 129, 602–606 [DOI] [PubMed] [Google Scholar]
- 18.Brown J. M., Halvorsen Y. D., Lea-Currie Y. R., Geigerman C., McIntosh M. (2001) J. Nutr. 131, 2316–2321 [DOI] [PubMed] [Google Scholar]
- 19.Brown J. M., Boysen M. S., Jensen S. S., Morrison R. F., Storkson J., Lea-Currie R., Pariza M., Mandrup S., McIntosh M. K. (2003) J. Lipid Res. 44, 1287–1300 [DOI] [PMC free article] [PubMed] [Google Scholar]
- 20.Chung S., Brown J. M., Sandberg M. B., McIntosh M. (2005) J. Lipid Res. 46, 885–895 [DOI] [PMC free article] [PubMed] [Google Scholar]
- 21.Azain M. J., Hausman D. B., Sisk M. B., Flatt W. P., Jewell D. E. (2000) J. Nutr. 130, 1548–1554 [DOI] [PubMed] [Google Scholar]
- 22.Kang K., Miyazaki M., Ntambi J. M., Pariza M. W. (2004) Biochem. Biophys. Res. Commun. 315, 532–537 [DOI] [PubMed] [Google Scholar]
- 23.Brown J. M., Boysen M. S., Chung S., Fabiyi O., Morrison R. F., Mandrup S., McIntosh M. K. (2004) J. Biol. Chem. 279, 26735–26747 [DOI] [PMC free article] [PubMed] [Google Scholar]
- 24.LaRosa P. C., Miner J., Xia Y., Zhou Y., Kachman S., Fromm M. E. (2006) Physiol. Genomics 27, 282–294 [DOI] [PubMed] [Google Scholar]
- 25.Kennedy A., Chung S., LaPoint K., Fabiyi O., McIntosh M. K. (2008) J. Nutr. 138, 455–461 [DOI] [PMC free article] [PubMed] [Google Scholar]
- 26.Evans M., Geigerman C., Cook J., Curtis L., Kuebler B., McIntosh M. (2000) Lipids 35, 899–910 [DOI] [PubMed] [Google Scholar]
- 27.Miner J. L., Cederberg C. A., Nielsen M. K., Chen X., Baile C. A. (2001) Obes. Res. 9, 129–134 [DOI] [PubMed] [Google Scholar]
- 28.Tsuboyama-Kasaoka N., Takahashi M., Tanemura K., Kim H. J., Tange T., Okuyama H., Kasai M., Ikemoto S., Ezaki O. (2000) Diabetes 49, 1534–1542 [DOI] [PubMed] [Google Scholar]
- 29.Wendel A. A., Purushotham A., Liu L. F., Belury M. A. (2008) J. Lipid Res. 49, 98–106 [DOI] [PubMed] [Google Scholar]
- 30.Houseknecht K. L., Vanden Heuvel J. P., Moya-Camerena S. Y., Protocarrero C. P., Peck L. W., Nickel K. P., Belury M. A. (1998) Biochem. Biophys. Res. Comm. 244, 678–682 [DOI] [PubMed] [Google Scholar]
- 31.Clément L., Poirier H., Niot I., Bocher V., Guerre-Millo M., Krief S., Staels B., Besnard P. (2002) J. Lipid Res. 43, 1400–1409 [DOI] [PubMed] [Google Scholar]
- 32.Tholstrup T., Raff M., Straarup E. M., Lund P., Basu S., Bruun J. M. (2008) J. Nutr. 138, 1445–1451 [DOI] [PubMed] [Google Scholar]
- 33.Risérus U., Arner P., Brismar K., Vessby B. (2002) Diabetes Care 25, 1516–1521 [DOI] [PubMed] [Google Scholar]
- 34.Risérus U., Basu S., Jovinge S., Fredrikson G. N., Arnlöv J., Vessby B. (2002) Circulation 106, 1925–1929 [DOI] [PubMed] [Google Scholar]
- 35.Moloney F., Yeow T. P., Mullen A., Nolan J. J., Roche H. M. (2004) Am. J. Clin. Nutr. 80, 887–895 [DOI] [PubMed] [Google Scholar]
- 36.Chung S., Brown J. M., Provo J. N., Hopkins R., McIntosh M. K. (2005) J. Biol. Chem. 280, 38445–38456 [DOI] [PMC free article] [PubMed] [Google Scholar]
- 37.Kennedy A., Overman A., Lapoint K., Hopkins R., West T., Chuang C. C., Martinez K., Bell D., McIntosh M. (2009) J. Lipid Res. 50, 225–232 [DOI] [PMC free article] [PubMed] [Google Scholar]
- 38.Awas J. A., Soteriou M. C., Drougas J. G., Stokes K. A., Roberts L. J., 2nd, Pinson C. W. (1996) Transplantation 61, 1624–1629 [DOI] [PubMed] [Google Scholar]
- 39.Morrow J. D., Roberts L. J., 2nd (1999) Methods Enzymol. 300, 3–12 [DOI] [PubMed] [Google Scholar]
- 40.Milatovic D., Yin Z., Gupta R. C., Sidoryk M., Albrecht J., Aschner J. L., Aschner M. (2007) Toxicol. Sci. 98, 198–205 [DOI] [PubMed] [Google Scholar]
- 41.Chung S., LaPoint K., Martinez K., Kennedy A., Sandberg M. B., McIntosh M. K. (2006) Endocrinology 147, 5340–5351 [DOI] [PubMed] [Google Scholar]
- 42.Gerhardt C. C., Romero I. A., Cancello R., Camoin L., Strosberg A. D. (2001) Mol. Cell. Endocrinol. 175, 81–92 [DOI] [PubMed] [Google Scholar]
- 43.Trayhurn P., Wood I. S. (2004) Br. J. Nutr. 92, 347–355 [DOI] [PubMed] [Google Scholar]
- 44.Hauner H. (2005) Proc. Nutr. Soc. 64, 163–169 [DOI] [PubMed] [Google Scholar]
- 45.Tchoukalova Y., Koutsari C., Jensen M. (2007) Diabetologia 50, 151–157 [DOI] [PubMed] [Google Scholar]
- 46.Fain J. N., Madan A. K., Hiler M. L., Cheema P., Bahouth S. W. (2004) Endocrinology 145, 2273–2282 [DOI] [PubMed] [Google Scholar]
- 47.Gil A., María Aguilera C., Gil-Campos M., Cañete R. (2007) Br. J. Nutr. 98, Suppl. 1, S121–S126 [DOI] [PubMed] [Google Scholar]
- 48.Skurk T., Alberti-Huber C., Herder C., Hauner H. (2007) J. Clin. Endocrinol. Metab. 92, 1023–1033 [DOI] [PubMed] [Google Scholar]
- 49.Suganami T., Nishida J., Ogawa Y. (2005) Arterioscler. Thromb. Vasc. Biol. 25, 2062–2068 [DOI] [PubMed] [Google Scholar]
- 50.Suganami T., Tanimoto-Koyama K., Nishida J., Itoh M., Yuan X., Mizuarai S., Kotani H., Yamaoka S., Miyake K., Aoe S., Kamei Y., Ogawa Y. (2007) Arterioscler. Thromb. Vasc. Biol. 27, 84–91 [DOI] [PubMed] [Google Scholar]


