Abstract
Cytochrome P450 19A1 (P450 19A1), the aromatase, catalyzes the conversion of androgens to estrogens through a sequential three-step reaction, generating 19-hydroxy and 19-aldehyde intermediates en route to the product estrogen. A procedure for the heterologous expression and purification of P450 19A1 in Escherichia coli was developed (kcat of 0.06 s−1 for the conversion of androstenedione to estrone). Binding of the substrate and intermediates show low micromolar dissociation constants and are at least two-step processes. Rates of reduction of the iron were fast in the presence of substrate, either intermediate, or product. P450 19A1 is a distributive rather than a processive enzyme, with the sequential reaction allowing free dissociation of the intermediates as revealed by pulse-chase experiments. Conversion of androstenedione to estrone (under single turnover conditions) generated a progress curve showing changes in the concentrations of the substrate, intermediates, and product. A minimal kinetic model containing the individual rate constants for the steps in P450 19A1 catalysis was developed to globally fit the time course of the overall reaction, the dissociation constants, the two-step ligand binding, the distributive character, the iron-reduction rates, and the steady-state conversion of the 19-hydroxy androstenedione and 19-aldehyde androstenedione intermediates to estrone.
Keywords: Cytochrome P450, Enzyme Catalysis, Enzyme Kinetics, Enzyme Purification, Kinetics, Pre-steady-state Kinetics, Steroid, CYP19A1
Introduction
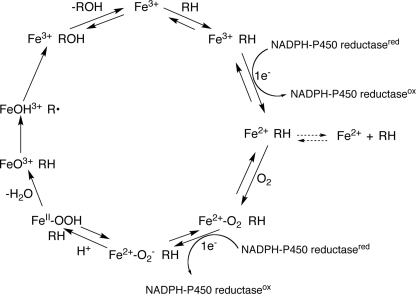
Cytochrome P450s (P450s)2 are heme-thiolate-containing enzymes capable of catalyzing reactions involving both endogenous substrates (e.g. fat-soluble vitamins and steroids) and exogenous substrates (e.g. drugs and pesticides) (1). These enzymes are found throughout nature, with 57 P450s encoded in the human genome (2). P450s typically catalyze monooxygenation reactions (Fig. 1) and are also capable of reduction, ring expansion, dealkylation, aromatization, and other reactions based on the same high valent iron chemistry (3).
FIGURE 1.
General P450 catalytic cycle.
An unusual feature of some P450s is the ability to catalyze sequential reactions. These multistep processes are characteristic of some of the P450s involved in steroid metabolism (P450s 11A1, 11B2, 17A1, 19A1, and 51A1), although sequential reactions with non-steroid substrates have also been characterized (e.g. P450s 1A2 (4), 2A6 (5), and 2E1 (6)). Pregnenolone and aldosterone are generated from P450 11A1 and 11B2 reactions, respectively, in three-step processes. P450 17A1 exhibits both steroid 7α-hydroxylation and lyase activities in a two-step reaction. P450 51A1 is a key enzyme in the cholesterol biosynthetic pathway and catalyzes a three-step C-demethylation of the substrate lanosterol. Although pre-steady-state analyses of P450 11B2 (7) and 17A1 (8) have been reported, to our knowledge no global fits (i.e. using several types of data to generate a kinetic mechanism of turnover) are available.
P450 19A1 is responsible for the conversion of androgens (andro, testosterone, and 16α-hydroxytestosterone) to estrogens (estrone, 17β-estradiol, and estriol, respectively) in a sequential, three-step reaction (Scheme 1). This conversion, first identified in 1959 (9), requires three molecules each of NADPH and O2 and proceeds through two relatively stable intermediates, the 19-hydroxy and 19-aldehyde compounds, before the final aromatization step. There has been considerable debate over the chemistry of the third step, and two mechanisms are currently favored. In the first model, the ferric peroxide form of the P450 (FeOO−, Fig. 1) attacks the aldehyde, followed by heterolytic cleavage of the peroxide bond and the transfer of the 1β proton of the steroid to the heme to generate a ferrous hydroxy intermediate, with the loss of formic acid (10, 11). In a second postulated mechanism, a non-enzymatic conversion of the 19=O andro intermediate to a gem-diol (or direct hydroxylation of the alcohol intermediate to form the gem-diol) is followed by an aromatization catalyzed by the “Compound I” form of P450 (formally FeO3+), which removes a hydrogen at the 1β position on the steroid (12). Following a transfer of an electron from the steroid A ring to the iron, the ferric hydroxy intermediate (FeOH3+) removes a hydrogen from the gem-diol, facilitating the loss of this carbon as formic acid (12).
SCHEME 1.
Controversy exists regarding the processive or distributive characteristic of the sequential steps catalyzed by P450 19A1, as summarized by Bednarski and Nelson (13). Steady-state time-course reactions of the turnover of andro by microsomes suggested linear formation of estrone sequentially from the two intermediates that freely dissociate (14, 15). It has also been proposed that the third step proceeds at a different active site than the first two oxidations, which would perhaps support intermediate dissociation (16). Further studies with inhibitors that mimic both the 19-OH andro and 19=O andro intermediates suggest P450 19A1 is processive (17) and indicate that only one active site exists (13). Although there is now agreement that catalysis occurs at one active site and must proceed through the 19-OH andro and 19=O andro intermediates (18), it remains unclear whether these intermediates dissociate over the course of the reaction.
A crystal structure of P450 19A1 (bound to andro) has recently been solved, revealing a relatively small active site that is well suited to accommodate andro and arguing against the existence of multiple active sites (19). P450 19A1 has wide tissue distribution (including placenta, ovaries, testes, and adipose tissue), and expression is associated with estrogen-dependent breast cancer (∼75% of diagnoses) (20). Aromatase inhibitors, available since the 1970s, have been successful in treating post-menopausal women with this type of cancer (21). Although much of the focus has been on characterizing the kinetics of P450 19A1 in the context of aromatase inhibitors, fewer studies have probed native substrates. Although many steady-state parameters for the conversion of andro to estrone have been published (22–26), similar steady-state studies on the intermediates are limited (22). Further, to our knowledge, no transient-state kinetic studies are available that determine the individual rate constants of the three-step sequential reaction catalyzed by P450 19A1.
One of the greatest obstacles in the study of P450 19A1 has been heterologous expression and purification. Almost all kinetic and structural work (19, 23, 26–28) has utilized P450 19A1 purified from human placenta, which requires access to tissue and precludes mutagenesis approaches. Heterologous expression has been primarily limited to baculovirus-infected insect cells (24, 29), although P450 19A1 expression in Escherichia coli has been reported (25, 30).
We describe a reasonably straightforward and robust protocol for the heterologous expression and purification of P450 19A1 in E. coli. Using global fitting of a variety of both steady-state and pre-steady-state kinetic data, we developed a minimal kinetic model of P450 19A1 turnover, which includes individual rate constants for the three-step reaction and indicates a distributive mechanism.
EXPERIMENTAL PROCEDURES
Chemicals
Andro, 19-OH andro, 19=O andro, and estrone were purchased from Steraloids (Newport, RI), and all radiolabeled steroids were purchased from PerkinElmer (Waltham, MA). HPLC-grade solvents were purchased Fisher Scientific (Pittsburgh, PA), and protocatechuate and protocatechuate dioxygenase were purchased from Sigma.
P450 19A1 cDNA Manipulation
The P450 19A1 cDNA was optimized for E. coli translation and formatted into overlapping oligonucleotides using the program DNAWorks (31). Oligonucleotides were purchased from Invitrogen and underwent polymerase cycling assembly to generate two synthons that could be joined through a unique BsrGI restriction enzyme cut site. After ligation of the synthons, the cDNA was inserted into a TOPO vector (Invitrogen), and sequence errors were corrected using a QuikChange multi site-directed mutagenesis kit (Stratagene). PCR was used to generate the modified N-terminal sequence and to add a C-terminal hexa-histidine tag in the P450 19A1 cDNA. Finally the cDNA was inserted into the pCW expression vector.
P450 19A1 Expression
TOP 10 competent cells (Invitrogen) were transformed with the P450 19A1 cDNA, and colonies were used to inoculate 50 ml of TB medium (supplemented with ampicillin (100 μg/ml)). After overnight shaking in an incubator at 37 °C (ATR Multitron, Laurel, MD), 2.8-liter Fernbach flasks containing 1.0 liter of TB medium (supplemented with ampicillin (100 μg/ml), thiamine (340 μg/ml), and a trace element solution) (32) were inoculated with 10 ml of culture. After an A600 of 1–1.2 was reached (∼3.5 h, 37 °C, 250 rpm), isopropyl 1-thio-β-d-galactopyranoside (1 mm) and δ-aminolevulinic acid (1 mm) were added, and the cultures were incubated for 42 h at 28 °C (150 rpm).
P450 19A1 Purification
The cells from the 1.0-liter cultures were pelleted, decanted, and then resuspended in Buffer A (100 mm Tris chloride buffer (pH 7.6 at 4 °C) containing 500 mm sucrose and 0.5 mm EDTA) (15 ml/g cells). All subsequent steps were at 0–4 °C. Following lysozyme treatment, a volume of H2O (equal to the volume of Buffer A) was added, and the preparation was incubated on ice for 30 min. After separation by centrifugation at 5000 × g (20 min), the resulting spheroplast pellet was resuspended in Buffer B (100 mm potassium phosphate buffer (pH 7.4), containing 20% glycerol (v/v), 6 mm magnesium acetate, and 0.1 mm dithiothreitol). To this were added the protease inhibitors leupeptin (2 μm), aprotinin (0.04 unit/ml), bestatin (1 μm), and phenylmethylsulfonyl fluoride (1 mm final, from a 100 mm stock solution in 1-propanol). The spheroplasts were sonicated and separated by centrifugation at 12,000 × g (20 min). The supernatant was harvested and separated by ultracentrifugation at 142,000 × g (60 min), and the pellet was resuspended in minimal Buffer B. The membranes were diluted with Buffer C (100 mm potassium phosphate buffer (pH 7.4) containing 20% glycerol (v/v), 1% CHAPS detergent (w/v), and 0.1 mm dithiothreitol) to a concentration of ∼2.5 mg/ml total protein (as determined by a bicinchoninic acid assay) and were solubilized overnight with gentle stirring. The solubilized membrane-bound proteins were separated from the membranes by ultracentrifugation at 142,000 × g (60 min). Two 8-ml nickel-NTA resin (Qiagen, Valencia, CA) columns were poured and equilibrated with Buffer D (100 mm potassium phosphate buffer (pH 7.4) containing 20% glycerol (v/v), 1% CHAPS detergent (w/v), 0.1 mm dithiothreitol, and 0.5 m NaCl). The solubilized protein supernatant (∼1.2 liters) was fortified with 0.5 m NaCl and loaded onto the two nickel-NTA columns (operated in parallel) using a pump (flow rate ∼ 1.8 ml/min). The columns were then washed with 200 ml of Buffer E (Buffer D containing 30 mm imidazole). P450 19A1 was eluted with a linear gradient of 30–300 mm imidazole in Buffer D (140-ml total, elution began with ∼100 mm imidazole). The most concentrated fractions (A417) were combined and dialyzed in Buffer F (100 mm potassium phosphate buffer (pH 7.4) containing 1 mm EDTA and 20% glycerol (v/v)). The purified P450 19A1 was stored at −70 °C.
Other Enzyme Preparations
Rat NADPH-P450 reductase was expressed in E. coli and purified as described elsewhere (33).
Spectroscopy
UV-visible spectra were recorded with either an Aminco DW2/OLIS or a Cary14/OLIS spectrophotometer (On-Line Instrument Systems, Bogart, GA). In steady-state titrations, P450 19A1 (1 μm) was titrated with increasing amounts of ligand dissolved in CH3OH, with a reference cuvette containing only P450 19A1 (final organic solvent concentration ≤ 2%, v/v). Scans were made from 350–500 nm, in duplicate, and averaged. The inherent absorbance of estrone required the use of a tandem (Yankeelov) cuvette in these titrations, as described elsewhere (4).
Stopped-flow absorbance and fluorescence experiments were performed on an OLIS RSM-1000 instrument (On-Line Instrument Systems) as described previously (34). Absorbance measurements were made in the rapid-scanning mode, and fluorescence measurements were made using excitation at 325 nm and a long pass filter of >385 nm, with 3.16 nm slits. Stopped-flow experiments shorter than 15 s were reported as averages of four individual experiments, and longer time point studies were an average of two.
Anaerobic Reduction
Samples (in glass tonometers) were deaerated using an argon/vacuum manifold as described previously (35), utilizing a protocatechuate/protocatechuate dioxygenase oxygen-scrubbing system (36). The tonometers were mounted on the stopped-flow apparatus as described previously (35), and measurements were made by averaging results from four shots. P450 19A1 (1 μm) preincubated with andro, 19-OH andro, 19=O andro, or estrone (all with CO) was reduced upon the addition of NADPH (150 μm).
Measurement of Enzyme Activity
In general steady-state studies, the reconstituted enzyme system contained 0.10 μm P450 19A1, 0.20 μm NADPH-P450 reductase, and 9 μm l-α-1,2-dilauroyl-sn-glycero-3-phosphocholine (dispersed into vesicles by sonication prior to use, as a 1 mg/ml stock solution), followed by the addition of substrate dissolved in CH3OH (final organic solvent content ≤ 1% v/v). Volumes of incubations were 1.0 ml and contained 100 mm potassium phosphate buffer, because the P450 19A1 was unstable in buffers of lower ionic strength. Incubations (in a shaking water bath, 37 °C, 50 rpm shaking, Amerex Instruments model 903, Lafayette, CA) were initiated by the addition of an NADPH-generating system (37).
In addition to Fe2+·CO versus Fe2+ difference spectral analysis, P450 19A1 activity was measured using slight modifications of a tritiated water release assay (38). Briefly, a reconstituted enzyme system containing 20 nm P450 19A1, 600 nm NADPH-P450 reductase, and 28 μm l-α-1,2-dilauroyl-sn-glycero-3-phosphocholine (dispersed into vesicles by sonication prior to use, as a 1 mg/ml stock solution) was incubated with 4.9 μm [1β-3H]andro (2 μCi) for 5 min (1.0-ml volume). Following quenching with 3 ml of CHCl3, 0.75 ml of the (upper) aqueous layer was removed and mixed with a vortex device after adding charcoal-dextran (5% charcoal, 0.5% dextran, v/w/w). This mixture was added to a centrifugal filter device (Fisher, Fair Lawn, NJ) filled with Celite®, and the charcoal-dextran was separated by centrifugation (2000 × g, 5 min). The radioactivity in an aliquot of H2O was then quantified using a scintillation counter (Beckman LS6500, Beckman, Brea, CA).
For steady-state kinetic analyses, reactions were run in duplicate for 5 min, quenched with 1.0 ml of CH2Cl2, and mixed with a vortex device. Following centrifugation, 0.75 ml of the organic layer was transferred, dried under a N2 stream, and then dissolved in 30 μl of CH3OH prior to HPLC analysis. Due to the very low Km for conversion of andro to estrone, radiolabeled starting material ([1,2,6,7-3H]andro) was required (a range of 0.02–1.2 μCi/incubation was used), and the reconstituted enzyme system contained 2.0 nm P450 19A1, 60 nm NADPH-P450 reductase, and 1.8 μm l-α-1,2-dilauroyl-sn-glycero-3-phosphocholine. For all reactions, HPLC (20-μl injections) was used to separate the compounds using an octadecylsilane (C18) column (6.2 mm × 80 mm, 3 μm, Agilent Technologies, Palo Alto, CA).
HPLC separation strategies were modified based on work by Zhou et al. (39). Separations were achieved (flow rate of 1.0 ml/min) with solvent A (83% H2O, 17% tetrahydrofuran, v/v) and solvent B (83% CH3OH, 17% tetrahydrofuran, v/v), using a linear gradient from 40% to 100% B from 0 to 6 min (v/v), held isocratic from 6 to 8 min at 100% B. For the studies with radiolabeled andro, HPLC was used with a liquid scintillation flow counter (In/Us β-Ram, Brandon, FL). A second, larger scale incubation was performed to relate peak area in the radiochromatograms to A280, using a Spectra Series UV100 spectrophotometer (ThermoFisher Scientific, Waltham, MA) for the quantitation of estrone. In the cases of the incubations with 19-OH andro and 19=O andro, separations were monitored at 240 and 285 nm (the 285 nm trace and external standards were used for quantitation) using a ThermoFinnigan UV3000 rapid-scanning UV detector (ThermoFisher Scientific).
The same conditions for incubations and HPLC analysis described for the andro activity assay (see above) were used for pulse-chase experiments (with 400 nm [1,2,6,7-3H]andro), except that either 210 μm 19-OH andro or 180 μm 19=O andro was added at time points of 30 or 60 s (total incubation time was 5 min).
Pre-steady-state kinetics were performed under single turnover conditions in a quenched-flow apparatus (model RFQ-3, Kintek Corp., Austin, TX). Specifically, 2.0 μm [4-14C]andro was added to a reconstituted enzyme system containing 2.0 μm P450 19A1, 4.0 μm NADPH-P450 reductase, and 250 μm l-α-1,2-dilauroyl-sn-glycero-3-phosphocholine. Reactions (in duplicate) were initiated by the addition of 500 μm NADPH and were quenched by the addition of 2% ZnSO4 (w/v) after a time period of 100 ms to 28 s. Sample workup and HPLC analysis were performed as described (see above), although the dried samples were dissolved in 25 μl of CH3OH for injection. Because the specific activity of the radiolabeled substrate was low (4.8 nCi present at each time point), five individual reactions (at each time point) were combined for HPLC analysis.
Rates of NADPH oxidation were measured as described previously (40). Briefly, reconstituted enzyme systems were prepared (see above) with 0.40 μm P450 19A1 and 125 μm substrate except in the case of estrone, where 20 μm substrate was used. The sample was preincubated at 37 °C using a water bath attached to the Aminco DW2/OLIS spectrophotometer, and the reaction was initiated by adding 180 μm NADPH and monitored at 340 nm. OLIS software was used to calculate the linear rates of NADPH oxidation, using ϵ340 = 6.22 mm−1 cm−1 for NADPH oxidation.
Analysis of Kinetic and Binding Data
In the anaerobic studies, the OLIS fitting software was used to fit the traces to single- or double-exponential equations. In the cases of the pre-steady-state binding experiments, Dynafit software (41) was used for double-exponential fits. Kintek Explorer® software (42) was employed for fitting the single turnover experimental data, and this fit was constrained in part by fitting v versus substrate concentration plots using Dynafit software.
RESULTS
P450 19A1 Expression and Purification
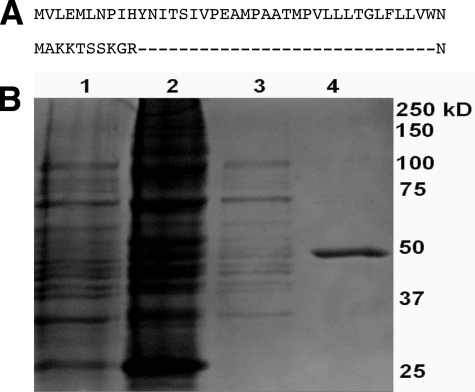
A method was developed that routinely achieved ∼400–500 nm expression of P450 19A1 and involved the use of a single column for purification, without the use of non-ionic detergents. To enhance expression in E. coli, the native mammalian P450 19A1 cDNA sequence was modified. Polymerase cycling assembly was used to optimize the cDNA codons for E. coli (supplemental Fig. S1). The N terminus was replaced with a sequence developed for improving heterologous expression of rabbit P450s (43) (Fig. 2A) and a hexa-histidine tag was added to the C-terminus. Finally, optimization of the strain of E. coli used (TOP 10) yielded some of the greatest improvement in expression levels.
FIGURE 2.
N-terminal sequence and purification of P450 19A1 protein. A, N-terminal sequence of native mammalian P450 19A1 (top) and the modification used for heterologous expression (bottom). B, SDS-PAGE (10% gel, stained with Coomassie Brilliant Blue G250). Lane 1, whole cells; lane 2, membrane-bound fraction; lane 3, solubilized membrane fraction; and lane 4, purified P450 19A1. Nominal protein concentrations loaded in lanes 1–4 were 70, 55, 7, and 1.7 μg, respectively.
Many difficulties in purification of P450 19A1 have been cited in the literature, typically related to loss of Fe2+·CO versus Fe2+ difference spectra due either to protein instability or suspected masking of signal by detergents or ligands used in purification (23, 27). We found that one successful method of stabilizing P450 19A1 during purification was the addition of the 19A1 inhibitor αNF (44) during the solubilization and chromatography steps (23), an approach used previously with P450s 1A1 and 1A2 (32, 45). However, we found that removal of this ligand was virtually impossible despite extensive column-washing steps and dialysis (with αNF quantified by fluorescence spectroscopy after extraction from P450 19A1 with organic solvent). Not surprisingly, the measured Kd of αNF was very low (0.09 ± 0.02 μm, estimated by monitoring the fluorescence quenching of αNF upon titration with P450 19A1). Alternatively, stability could be improved by limiting the exposure time of the P450 19A1 to the nickel-NTA resin during the chromatography step and using high ionic strength (100 mm potassium phosphate buffer) throughout. Nickel-NTA nickel chromatography was sufficient to achieve >95% electrophoretic purity (Fig. 2B). Overall yields of P450 19A1 were not particularly high (Table 1 and supplemental Fig. S2) but sufficient for kinetic analysis.
TABLE 1.
Quantitation of P450 19A1 expression and purification
| Purification stage | P450a | Cytochrome P420a | P450 plus cytochrome P420b | Hemec | P450 proteind | Total proteine | Specific content |
|---|---|---|---|---|---|---|---|
| nmol | nmol | nmol | nmol | nmol | mg | nmol P450/mg protein | |
| Whole cells | 2,700f | 2,500 | 84,000 | 0.032 | |||
| Membranes | 370f | 260 | 2,200 | 0.17 | |||
| Solubilized protein | 370f | 1,330 | 1,700f | 950 | 1,700 | 0.22 | |
| Purified P450 19A1 | 120f | 50 | 170f | 180 | 420 | 19 | 6.3 |
a Fe2+·CO versus Fe2+ difference spectrum.
b Fe2+·CO versus Fe2+ difference spectrum in which the absorbance change at 420 nm is added to the absorbance change at 450 nm to calculate total P450 plus cytochrome P420.
c Pyridine hemochrome assay.
d Immunoblot analysis, quantified based on the Fe2+·CO versus Fe2+ difference spectrum of purified P450 3A4.
e Bicinchoninic acid analysis.
f Safranin T dye included (2 μm).
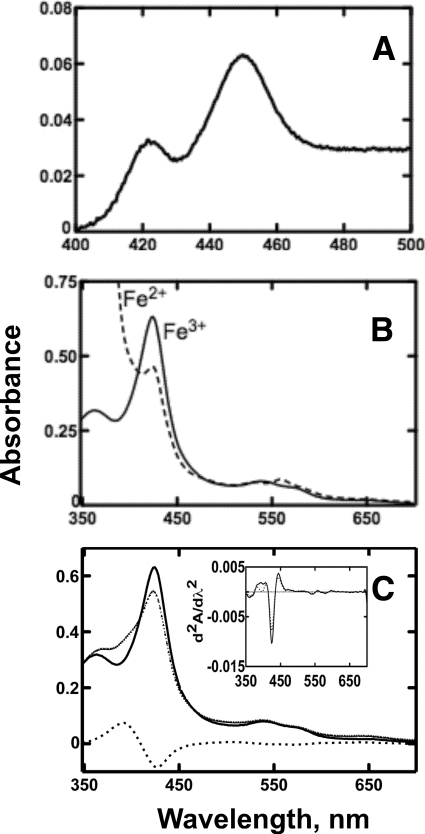
Spectral analysis of purified P450 19A1 yielded rather typical Fe2+·CO- versus Fe2+-reduced difference (Fig. 3A) and absolute (Fig. 3B) spectra. Fe2+·CO- versus Fe2+-reduced difference spectra were improved by the addition of safranin T (2 μm) as an electron mediator in the assays (45). P450 19A1 displayed “Type I” changes (increase at 390 nm and decrease at 420 nm as binding of the ligand caused displacement of H2O as the sixth axial ligand) (46) upon binding andro (Fig. 3C), although only ∼18% maximal conversion to the high spin iron state was observed (Fig. 3C, inset). The heme content, measured by the pyridine hemochrome assay (47), was similar to the sum of P450 plus cytochrome P420 (Table 1).
FIGURE 3.
Spectra of purified P450 19A1. A, Fe2+·CO versus Fe2+ difference spectrum (using 2 μm safranin T dye as an electron mediator). B, absolute spectrum showing ferric and ferrous forms. C, absolute spectrum of 2 μm P450 19A1 in the absence (solid line) or presence (small dotted line) of 10 μm andro and the difference between the two spectra (large dotted line). Also shown (inset) are the second derivatives of the spectra recorded in the absence (solid line) or presence (large dotted line) of 10 μm andro, showing about 18% conversion from low- to high-spin iron upon ligand binding.
Steady-state Kinetics of Ligand Binding to P450 19A1
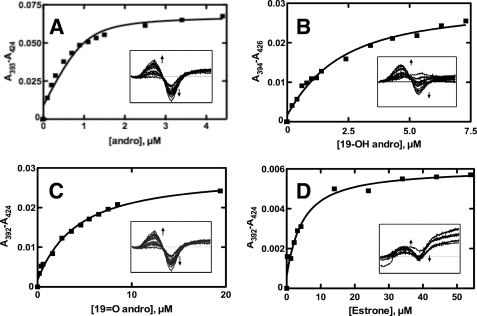
Andro, 19-OH andro, 19=O andro, and estrone all behaved as Type I ligands (Fig. 4). These titrations displayed tight ligand binding with dissociation constants in the low micromolar range (Table 2), and fitting such plots (Fig. 4) required quadratic equations. Andro showed the strongest affinity for P450 19A1 with a Kd value of 0.13 μm, whereas 19-OH andro, 19=O andro, and estrone yielded Kd values of 1.5, 3.6, and 4.0 μm, respectively.
FIGURE 4.
Steady-state binding of ligands to P450 19A1. Titration of P450 19A1 (1 μm) with varying concentrations of ligand. Insets show the spectral changes, and the plots (lines) are quadratic fits of the changes in absorbance (squares). A, andro, Kd = 0.13 ± 0.07 μm; B, 19-OH andro, Kd = 1.5 ± 0.4 μm; C, 19=O andro, Kd = 3.6 ± 0.6 μm; and D, estrone, Kd = 4.0 ± 1.0 μm.
TABLE 2.
Steady-state parameters of P450 19A1 turnover and dissociation constants
| Substrate | kcat | Km | kcat/Km | Kd |
|---|---|---|---|---|
| s−1 | μm | m−1s−1 | μm | |
| Andro | 0.060 ± 0.003 | 0.044 ± 0.006 | 1.4 × 10⁶ | 0.13 ± 0.07 |
| 19-OH andro | 0.13 ± 0.01 | 21 ± 6 | 6.2 × 10³ | 1.5 ± 0.4 |
| 19=O andro | 0.42 ± 0.03 | 18 ± 5 | 2.3 × 10⁴ | 3.6 ± 0.6 |
| Estrone | 4.0 ± 1.0 |
Pre-steady-state Kinetics of Ligand Binding to P450 19A1
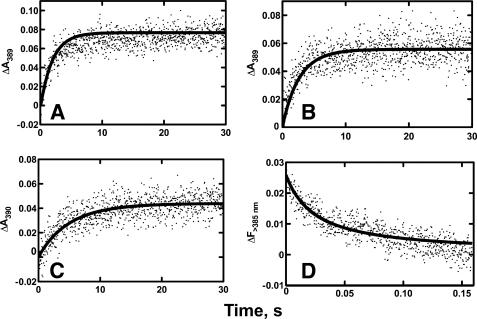
Stopped-flow absorbance or fluorescence spectroscopy was used to measure pre-steady-state rates of binding of andro, 19-OH andro, 19=O andro, and αNF to P450 19A1 (Fig. 5). When the changes in absorbance upon ligand binding were fit to a single-exponential equation (i.e. simple one-step binding mechanism, E + L ⇆ EL), a second-order rate constant (kon) of ∼5.6 × 10⁴ m−1 s−1 resulted, which is probably 100–1000 times too slow for a diffusion-limited interaction (48). Instead a two-step binding mechanism was used: E + L ⇆ EL ⇆ LE, with a fast, spectroscopically silent initial step followed by a slower change that affected the heme Soret region. This initial fast, absorbance-silent step theoretically could be captured if a fluorescent ligand was used, as previously shown in studies with P450s 3A4 (34) and 1A2 (4). In this case, quenching of the native fluorescence of the ligand occurs upon the first interaction with the enzyme and does not depend on heme Soret region changes proposed to occur following an initial binding step. By using the fluorescent P450 19A1 inhibitor αNF (see above), a very fast initial interaction with the protein was observed (∼103 × faster than changes seen in absorbance) (Fig. 5D).
FIGURE 5.
Pre-steady-state binding kinetics of ligands to P450 19A1. Stopped-flow absorbance (A–C) and fluorescence (D) changes for binding of various ligands (2 μm) to P450 19A1 (2 μm). Raw data are presented as scatter plots, and the overlaid lines are fits using Dynafit software. A, andro (ΔA390), k1 = 2.5 × 10⁶ m−1 s−1, k−1 = 1.4 s−1, k2 = 0.42 s−1, k−2 = 0.20 s−1; B, 19-OH andro (ΔA390), k1 = 2.0 × 10⁷ m−1 s−1, k−1 = 240 s−1, k2 = 0.80 s−1, k−2 = 0.15 s−1; C, 19=O andro (ΔA390), k1 = 2.5 × 10⁶ m−1 s−1, k−1 = 300 s−1, k2 = 2.4 s−1, k−2 = 0.13 s−1; and D, αNF (ΔF> 385), k1 = 1.0 × 10⁷ m−1 s−1, k−1 = 0.1 s−1, k2 = 0.01 s−1, k−2 = 0.18 s−1.
Double-exponential equations provided good fits to the biphasic curves observed for andro, 19-OH andro, and 19=O andro binding, with initial binding rates that ranged from 2.5 × 10⁶ to 2.0 × 10⁷ m−1 s−1 (Fig. 5, using Dynafit software). The andro, 19-OH andro, and 19=O andro fits were constrained using both the raw data and the Kd values (from the steady-state titration data) (supplemental Fig. S3). In support of this two-step binding mechanism, the fluorescence quenching of αNF upon binding P450 19A1 was significantly faster than the observed absorbance changes, and the data were fit to a double-exponential equation with an initial rate (k1) of 1.0 × 10⁷ m−1 s−1, which is realistic for a second-order encounter phenomenon (48) (Fig. 5D). The faster rate seen for fluorescence compared with absorbance strongly supports the E + L ⇆ EL ⇆ LE mechanism, where E + L ⇆ EL is the initial fast binding step that can be captured for observation by fluorescence quenching of the ligand, while EL ⇆ LE is a slower binding step related to interaction with the heme.
Rates of Reduction of P450 19A1
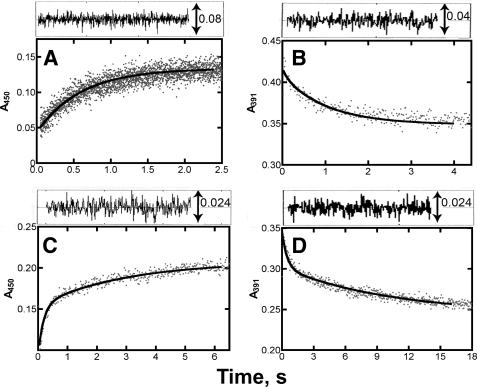
The rates of reduction of ferric P450 19A1 in the absence of any ligand were extremely slow (∼0.03 s−1, data not shown). However, much higher rates were observed in the presence of ligands, particularly in the case of 19-OH andro and 19=O andro (Fig. 6). It is typically assumed in such reduction studies that CO interacts rapidly with P450s with high affinity, regardless of other ligands present, and thus absorbance changes at 450 nm indicate rates of reduction and are not complicated by the kinetics of CO binding. However, this was not the case in measuring rates of reduction of P450 19A1 in the presence of 19-OH andro and estrone. A Fe2+·CO versus Fe2+ difference spectrum (supplemental Fig. S4) indicated that iron reduction occurred, but the addition of 19-OH andro precluded CO from binding, preventing the Soret absorbance increase at 450 nm. A similar phenomenon was observed for estrone binding, in which the signal at 450 nm was high, but the apparent rate of reduction (0.098 ± 0.002 s−1) was slower than the kcat (data not shown). In both cases, the change in absorbance at 390 nm (rather than 450 nm) was extracted and used to determine rates of reduction. Although the reduction of P450 19A1 in the presence of andro could be fit to a single-exponential equation (k = 1.7 ± 0.1 s−1), the reduction data for P450 19A1 in the presence of 19-OH andro, 19=O andro, and estrone were better fit to double-exponential equations with fast initial rate constants (kfast) of 10, 5.4, and 2.2 s−1, respectively. In all cases, the rates of iron reduction were much faster than the measured rates of substrate oxidation (see below).
FIGURE 6.
Reduction kinetics of P450 19A1. Stopped-flow absorbance traces of the reduction of P450 19A1 (1 μm) by NADPH-P450 reductase (2 μm) in the presence of l-α-1,2-dilauroyl-sn-glycero-3-phosphocholine (95 μm) and various ligands (5 μm) upon the addition of NADPH (150 μm). A, andro (ΔA450), k = 1.7 ± 0.1 s−1; B, 19-OH andro (ΔA391), kfast = 10 ± 4 s−1, kslow = 0.97 ± 0.12 s−1; C, 19=O andro (ΔA450), kfast = 5.4 ± 0.5 s−1, kslow = 0.34 ± 0.06 s−1; and D, estrone (ΔA391), kfast = 2.2 ± 0.4 s−1, kslow = 0.098 ± 0.02 s−1. The analysis of residuals is shown at the top of each plot.
The steady-state rates of oxidation of NADPH by P450 19A1 in the presence of NADPH-P450 reductase were also measured. In the absence of ligands, rates of 0.40 ± 0.02 nmol of NADPH oxidized (nmol P450)−1 s−1 were measured, whereas faster rates of 1.23 (± 0.07), 1.03 (± 0.08), 0.90 (± 0.02), and 0.45 (± 0.03) nmol of NADPH oxidized (nmol P450)−1 s−1 were observed in the presence of andro, 19-OH andro, 19=O andro, and estrone, respectively.
Steady-state Kinetics of P450 19A1 Activity
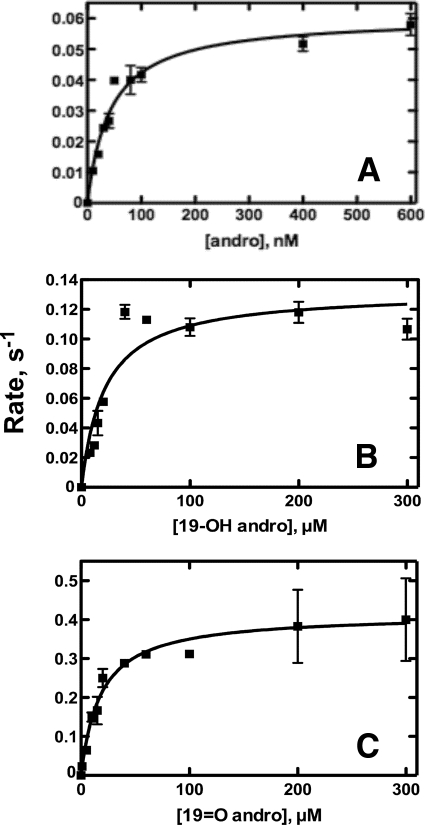
Although in the range of previously reported kcat values (Fig. 7 and Table 2) (22, 23, 25), the turnover of andro by P450 19A1 was relatively slow (0.06 s−1), particularly when compared with cholesterol 7α-hydroxylation by P450 7A1, which has been reported to be two orders of magnitude faster (50). (A sample chromatogram used for quantitation of estrone is shown in supplemental Fig. S5.) Although the kcat was somewhat low (0.06 s−1), the low Km contributed to a relatively high catalytic efficiency (1.4 × 10⁶ m−1 s−1). 19-OH andro and 19=O andro displayed higher kcat values (0.13 and 0.42 s−1, respectively), although higher Km values caused the resulting catalytic efficiencies to be lower than that of andro conversion to estrone (Table 2). Thus coupling of NADPH oxidation (see above) to kcat was not very efficient, with 5%, 34%, and 33% coupling for andro, 19-OH andro, and 19=O andro, respectively.
FIGURE 7.
Steady-state kinetics of P450 19A1 activity. Hyperbolic fitting (lines) of the formation of estrone by P450 19A1. A, andro as substrate; B, 19-OH andro as substrate; and C, 19=O andro as substrate. Data points are squares.
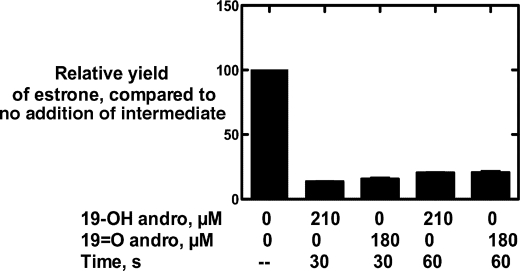
When excess 19-OH andro or 19=O andro was added at 30 or 60 s to an incubation containing P450 19A1 and tritiated andro in a pulse-chase experiment, a ∼75% loss of the radiolabel in the estrone product was observed (Fig. 8). Loss of the radiolabel in the product (estrone) upon addition of either intermediate indicated that both intermediates exchange freely during the course of the sequential reaction.
FIGURE 8.
Pulse-chase assays. P450 19A1 (2 nm) was incubated with 400 nm [1,2,6,7-3H]andro, followed by a pulse of 19-OH andro (210 μm) or 19=O andro (180 μm) at 30 or 60 s. In this case, 100% activity was 0.087 s−1. The total reaction time was 5 min.
Kinetics of P450 19A1 under Single Turnover Conditions
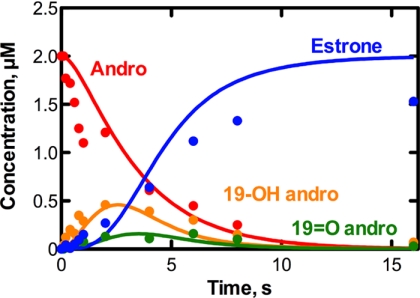
Pre-steady-state kinetic analysis was done under single turnover conditions to generate a progress curve showing the loss of substrate, the subsequent formation and loss of 19-OH andro and 19=O andro, and the generation of estrone (Fig. 9). 19-OH andro (which accumulated to higher concentrations than 19=O andro) was seen already at 100 ms, followed by 19=O andro and estrone. The reaction was essentially complete within 10 s.
FIGURE 9.
Kinetics of P450 19A1 catalysis under single turnover conditions. Loss and/or formation of andro (red), 19-OH andro (orange), 19=O andro (green), and estrone (blue) were monitored in a reaction of P450 19A1 (2 μm) and [4-14C]andro (2 μm). Global fitting (using Kintek Explorer® software) is shown.
P450 19A1 Kinetic Modeling
Global fitting was employed to generate a minimal mechanism for the three-step reaction catalyzed by P450 19A1 (Fig. 9 and Table 3). The single turnover time course could be fit using Kintek Explorer® software (Fig. 9), and the resulting individual rate constants were constrained in part by concurrently fitting (using Dynafit software) the v versus substrate concentration steady-state plots (Fig. 7) for the conversion of 19-OH andro and 19=O andro to estrone (supplemental Fig. S6). Further, Kd values resulting from the fits for andro and 19=O andro binding were within range of those derived experimentally (Fig. 4 and Table 2). The rates of P450 19A1 reduction (Fig. 6) were used to set approximate upper limits of substrate oxidation (i.e. k3, k6, and k9, Table 3). The inclusion of a conformational change following ligand binding (Table 3) was based upon evidence for a spectroscopically silent initial binding step in the pre-steady-state binding experiments (Fig. 5), and the insertion of intermediate dissociation steps was included based on the results of the pulse-chase experiments (Fig. 8).
TABLE 3.
Individual rate constants for P450 19A1 turnover
| Mechanism stepa | Forward rate constant | Reverse rate constant |
|---|---|---|
| E + A ⇆ EA | k1 = 4.5 × 10⁷m−1 s−1 | k−1 = 15 s−1 |
| EA ⇄ AE | k2 = 0.63 s−1 | k−2 = 0.35 s−1 |
| AE → EB | k3 = 1.0 s−1 | |
| EB ⇄ E + B | k4 = 3.9 × 10⁴ s−1 | k−4 = 3.5 × 10⁷m−1 s−1 |
| EB ⇄ BE | k5 = 2.4 × 10⁴ s−1 | k−5 = 320 s−1 |
| BE → EC | k6 = 7.5 s−1 | |
| EC ⇄ E + C | k7 = 50 s−1 | k−7 = 4.0 × 10⁷m−1 s−1 |
| EC ⇄ CE | k8 = 3.2 × 10⁴ s−1 | k−8 = 3.0 × 10⁴ s−1 |
| CE → ED | k9 = 5.9 s−1 | |
| ED ⇄ E + D | k10 = 1.3 × 10⁴ s−1 | k−10 = 4.5 × 10⁷m−1 s−1 |
a A: andro, B: 19-OH andro, C: 19 = O andro, D: estrone, and E: enzyme (P450 19A1).
DISCUSSION
P450 19A1, which converts androgens to estrogens, is a member of the class of P450s capable of catalyzing sequential reactions. Many of these multistep enzymes are involved in steroid processing, i.e. P450s 11A1, 11B2, 17A1, and 51A1, as well as 19A1. The reported kinetic studies of three-step reactions catalyzed by P450 19A1 are limited to a small collection of steady-state parameters associated with the turnover of andro and testosterone plus a multitude of studies examining aromatase inhibitors, which have proved to be therapeutically effective for some breast cancers. We used both steady-state and pre-steady-state kinetic techniques to characterize the binding of the substrate, intermediates, and product, revealing low micromolar binding that occurred in a two-step process. Over the course of the reaction, the intermediates freely dissociated. Globally fitting a progress curve generated under single turnover conditions, as well as many other data, yielded a kinetic model with individual rate constants for each step of catalysis.
We report heterologous P450 19A1 expression of 400–500 nm in E. coli and purification that requires only one chromatography step. Most other methods involve purification of P450 19A1 from placenta, which prohibits mutagenesis experiments and requires access to human tissues. Further, these purification protocols require the use of two (51), three (22, 23), or four (52) columns, decreasing the overall yield, and some utilize non-ionic detergents, which can be difficult to remove (53). The specific content (6.3 nmol of P450/mg of protein, Table 1) was lower than expected for a pure P450 holoenzyme, i.e. ∼20 nmol of P450/mg for a 50-kDa protein. Because SDS-PAGE analysis indicated >95% purity (Fig. 2B), we presume that the deviation from the theoretical value resulted from a contribution of apo-P450 19A1 to the measured concentration. P450 19A1 was sensitive to exposure to the nickel-NTA resin, and although the chromatography step was abbreviated, the absorbance spectrum of the purified protein at 420 nm (demonstrating a loss of heme) suggested some apo-protein formation (Table 1).
Two other purification strategies required the use of either andro (22) or αNF (23) to stabilize the P450 during purification. Although the Fe2+·CO versus Fe2+ difference spectra improved upon the addition of αNF during solubilization and chromatography steps, we were unable to remove αNF from the preparation despite extensive column washing, adding a second column for further washing, and using additional dialysis steps. Because andro has a Kd nearly as low as αNF (0.13 versus 0.09 μm, respectively), it is likely that similar problems plague purification strategies that utilize andro. Limiting exposure to the nickel-NTA resin generated Fe2+·CO versus Fe2+ difference spectra of as high quality as those recorded with αNF-containing preparations (minimum A420 in the Fe2+·CO versus Fe2+ difference spectra) and, importantly, did not complicate kinetics by having an inhibitor or substrate present.
Another protocol for expression and purification of P450 19A1 in E. coli involved the removal of a larger portion of the N terminus, produced slightly lower levels of expression (350–400 nm), and required three columns and the presence of andro (25). Although Zhang et al. (30) used only a single column for purification, the native sequence was more highly modified in that histidine tags were present at both the N and C-termini, and expression levels were not reported.
One steady-state time-course assay involving aromatization of andro (by placental microsomes) showed accumulation of both intermediates before the formation of estrone (14), but another study extended this time course to show subsequent loss of the intermediates (15). The presence of both intermediates, the lag of formation of estrone, and the subsequent loss of the intermediates was taken as evidence that each step of the sequential reaction was required and that the intermediates were free to dissociate. Conversely, the high specific radioactivity of estrone and low specific radioactivity of 19-OH andro after incubation of radiolabeled andro and non-labeled 19-OH andro (with placental microsomes) suggested little dissociation of the intermediates (17). However, this type of assay does not directly probe dissociation of both intermediates, unlike pulse-chase experiments (Fig. 8). The amount of 19A1 present was not defined (microsomal fractions were used), which could prove problematic. If substrate concentrations approximate the concentration of P450 19A1, conditions would be similar to those in our single turnover experiment, and a 5-min incubation would be too long for this type of assay. In our time-course experiment (Fig. 9) this relatively late time point would show more radioactive estrone than radioactive 19-OH andro, as indicated in the study by Hollander (17), but this observation should not be used to infer processivity. Our more direct assay of measuring dissociation using pulse-chase experiments (with defined concentrations), which shows dissociation of both intermediates, is considered more reliable.
Characterization of P450 19A1 as being more distributive than processive contrasts with similar studies on sequential reactions catalyzed by P450s 2A6 (processive conversion of nitrosamines to aldehydes and then carboxylic acids (5)) and 2E1 (processive conversion of ethanol to acetic acid through acetaldehyde (6)). Intuitively one might expect a reaction course with a physiological substrate to be more processive, but this is not necessarily the case. Why these P450s show such differences in the ability of the intermediates to freely exchange remains unknown and is the object of further investigation.
Distinction between the ferric peroxide and the Compound I mechanisms (see above) was not addressed in this work. Because the former mechanism (10, 11) dictates that the ferric peroxide intermediate attacks the 19=O andro intermediate rather than the 19-gem-diol compound, it is possible that buildup of the 19-gem-diol might occur (if dehydration is slow). However, no unidentified peaks in the radiochromatogram were observed to indicate a distinct 19-gem-diol compound in the single turnover studies. The sensitivity of the assay may have prevented observation of the 19-gem-diol (the specific activity of the [4-14C]-andro was very low), because 19=O andro levels were just above the limit of detection. It is also possible that the rate of non-enzymatic conversion might favor the 19=O andro compound, preventing buildup of the 19-gem-diol. Another possibility is that the 19-gem-diol is immediately attacked by Compound I, as in the case of the second proposed mechanism (12), and the enzymatically non-preferred conformation, the 19=O andro, accumulates (as seen in Fig. 9). Further experiments are necessary to distinguish between these two models.
Steady-state titrations (Fig. 4) showed low micromolar dissociation constants for all four ligands. The highest affinity was seen for andro (0.13 μm), a value that is still much higher than the circulating concentration of andro (∼9 nm in men (54)). Titrations with testosterone (data not shown) indicated a Kd value of 1.5 μm, which is considerably higher than that of andro, although circulating levels of testosterone are also higher (∼19 nm in men (54)). Pre-steady-state binding of andro, 19-OH andro, and 19=O andro to P450 19A1 was a two-step process. Thus multistep binding to P450s is not limited to xenobiotics (i.e. P450s 1A2 and 3A4) (4, 55), because this was also seen with an endobiotic in a P450 with a small active site (19).
To generate a minimum kinetic model to describe P450 19A1 turnover, multiple types of data were fit globally using both Kintek Explorer® (Fig. 9) and Dynafit software (supplemental Fig. S6). The greatest challenge of global fitting was constraining the individual rate constants to fit the steady-state turnover data (Fig. 7). For the steady-state 19-OH andro to estrone conversion data, all of the rate constants from the EB ⇆ E + B step (Table 3) through the final step (estrone release) were used. The resulting fit (supplemental Figs. S6A and S6B) describes the turnover of 19-OH andro relatively well. Similarly, 19=O to estrone turnover data were fit using rate constants from the EC ⇆ E + C step (Table 3) through estrone release. Although the initial rate is slightly faster than observed experimentally, these steady-state data were also fit well (supplemental Figs. S6C and S6D).
There are some weaknesses in this kinetic model. Although concentrations of the two intermediates were well described by the model of the single turnover experiment, a lag phase in the formation of estrone was overemphasized, and the rate of andro loss was slow (Fig. 9). Laws of mass balance dictate that 2 μm estrone should be formed as indicated by the model, because levels of andro, 19-OH andro, and 19=O andro fall to zero, and no further reaction with estrone could be identified. However, slow conversion of estrone to 2-hydroxyestrone by P450 19A1 has been reported (56–58), and it is possible that some estrone 2-hydroxylation occurred, albeit at undetectable levels in these assays. It is unlikely that significant intermediate decomposition occurred during the course of the single turnover experiment, because no additional peaks (14C) were identified to indicate novel compounds (resulting from decomposition). Additional “conformational change” steps could be added following binding each of the ligands, or at other steps of the catalytic cycles, which may improve the overall fit, but have no experimental basis. The convention of global kinetic simulation is to develop the best possible minimal mechanism that can fit several types of experimental data, without adding additional steps unless necessary and justified (49). Analysis using substrate with higher specific radioactivity might reveal contributions from other products (of andro, the intermediates, or estrone), although we have used the highest specific radioactivity 14C-labeled andro available. The use of tritium-labeled materials has the disadvantages of potential loss of labels resulting from exchange or isotope effects (depending on the site of labeling).
These rate constants (Table 3) could not be used to fit the steady-state andro to estrone conversion (Fig. 7A) using Dynafit software, and Kd values for 19-OH andro and estrone were under predicted. In the case of estrone, the Kd problem may be solved by the addition of an ED ⇆ DE rearrangement step prior to estrone dissociation, as seen in the cases of the other ligands, but stopped-flow spectroscopy data would need to support this approach.
In summary, we report the first kinetic mechanism for P450 19A1 resulting from the global fitting of Kd values, pre-steady-state ligand binding experiments, iron-reduction rates, steady-state turnover experiments, pulse-chase assays, and a single turnover time course. The P450 19A1 mechanism, which includes rate constants for each of the three steps in the sequential, three-step reaction, may be useful for modeling other sequential P450s and may aid in the characterization of aromatase inhibitors.
Supplementary Material
Acknowledgment
We thank K. Trisler for her assistance in preparation of the manuscript.
This work was supported, in whole or in part, by National Institutes of Health Grants R37 CA090426, P30 ES000267, and T32 ES007028 (to F. P. G.).

The on-line version of this article (available at http://www.jbc.org) contains supplemental Figs. S1–S6.
- P450
- cytochrome P450
- andro
- androstenedione
- 19-OH andro
- 19-hydroxyandrostenedione
- 19=O andro
- 19-aldoandrostenedione
- αNF
- α-naphthoflavone (5,6-benzoflavone)
- CHAPS
- 3-[(3-cholamidopropyl)dimethylammonio]-1-propanesulfonate
- HPLC
- high-performance liquid chromatography
- TB
- Terrific Broth
- NTA
- nitrilotriacetic acid.
REFERENCES
- 1.Ortiz de Montellano P. R. (ed) (2005) Cytochrome P450s: Structure, Mechanism, and Biochemistry, 3rd Ed., Kluwer Academic/Plenum Publishers, New York [Google Scholar]
- 2.Nelson D. R. (2003) Arch. Biochem. Biophys. 409, 18–24 [DOI] [PubMed] [Google Scholar]
- 3.Guengerich F. P. (2001) Chem. Res. Toxicol. 14, 611–650 [DOI] [PubMed] [Google Scholar]
- 4.Sohl C. D., Isin E. M., Eoff R. L., Marsch G. A., Stec D. F., Guengerich F. P. (2008) J. Biol. Chem. 283, 7293–7308 [DOI] [PubMed] [Google Scholar]
- 5.Chowdhury G., Calcutt M. W., Guengerich F. P. (2010) J. Biol. Chem. 285, 8031–8044 [DOI] [PMC free article] [PubMed] [Google Scholar]
- 6.Bell-Parikh L. C., Guengerich F. P. (1999) J. Biol. Chem. 274, 23833–23840 [DOI] [PubMed] [Google Scholar]
- 7.Imai T., Yamazaki T., Kominami S. (1998) Biochemistry 37, 8097–8104 [DOI] [PubMed] [Google Scholar]
- 8.Yamazaki T., Ohno T., Sakaki T., Akiyoshi-Shibata M., Yabusaki Y., Imai T., Kominami S. (1998) Biochemistry 37, 2800–2806 [DOI] [PubMed] [Google Scholar]
- 9.Ryan K. J. (1959) J. Biol. Chem. 234, 268–272 [PubMed] [Google Scholar]
- 10.Akhtar M., Calder M. R., Corina D. L., Wright J. N. (1982) Biochem. J. 201, 569–580 [DOI] [PMC free article] [PubMed] [Google Scholar]
- 11.Cole P. A., Robinson C. H. (1991) J. Am. Chem. Soc. 113, 8130–8137 [Google Scholar]
- 12.Hackett J. C., Brueggemeier R. W., Hadad C. M. (2005) J. Am. Chem. Soc. 127, 5224–5237 [DOI] [PubMed] [Google Scholar]
- 13.Bednarski P. J., Nelson S. D. (1989) J. Steroid Biochem. 32, 309–316 [DOI] [PubMed] [Google Scholar]
- 14.Thompson E. A., Jr., Siiteri P. K. (1974) J. Biol. Chem. 249, 5364–5372 [PubMed] [Google Scholar]
- 15.Braselton W. E., Jr., Engel L. L., Orr J. C. (1974) Eur. J. Biochem. 48, 35–43 [DOI] [PubMed] [Google Scholar]
- 16.Fishman J., Goto J. (1981) J. Biol. Chem. 256, 4466–4471 [PubMed] [Google Scholar]
- 17.Hollander N. (1962) Endocrinology 71, 723–728 [DOI] [PubMed] [Google Scholar]
- 18.Simpson E. R., Clyne C., Rubin G., Boon W. C., Robertson K., Britt K., Speed C., Jones M. (2002) Annu. Rev. Physiol. 64, 93–127 [DOI] [PubMed] [Google Scholar]
- 19.Ghosh D., Griswold J., Erman M., Pangborn W. (2009) Nature 457, 219–223 [DOI] [PMC free article] [PubMed] [Google Scholar]
- 20.Johnston S. R., Dowsett M. (2003) Nat. Rev. Cancer 3, 821–831 [DOI] [PubMed] [Google Scholar]
- 21.Altundag K., Ibrahim N. K. (2006) Oncologist 11, 553–562 [DOI] [PubMed] [Google Scholar]
- 22.Kellis J. T., Jr., Vickery L. E. (1987) J. Biol. Chem. 262, 4413–4420 [PubMed] [Google Scholar]
- 23.Gartner C. A., Thompson S. J., Rettie A. E., Nelson S. D. (2001) Protein Expr. Purif. 22, 443–454 [DOI] [PubMed] [Google Scholar]
- 24.Amarneh B., Simpson E. R. (1995) Mol. Cell. Endocrinol. 109, R1–R5 [DOI] [PubMed] [Google Scholar]
- 25.Kagawa N., Hori H., Waterman M. R., Yoshioka S. (2004) Steroids 69, 235–243 [DOI] [PubMed] [Google Scholar]
- 26.Hagerman D. D. (1987) J. Biol. Chem. 262, 2398–2400 [PubMed] [Google Scholar]
- 27.Vickery L. E., Kellis J. T., Jr. (1987) Steroids 50, 29–36 [DOI] [PubMed] [Google Scholar]
- 28.Harada N. (1988) J. Biochem. 103, 106–113 [DOI] [PubMed] [Google Scholar]
- 29.Sigle R. O., Titus M. A., Harada N., Nelson S. D. (1994) Biochem. Biophys. Res. Commun. 201, 694–700 [DOI] [PubMed] [Google Scholar]
- 30.Zhang F., Zhou D., Kao Y. C., Ye J., Chen S. (2002) Biochem. Pharmacol. 64, 1317–1324 [DOI] [PubMed] [Google Scholar]
- 31.Hoover D. M., Lubkowski J. (2002) Nucleic Acids Res. 30, e43. [DOI] [PMC free article] [PubMed] [Google Scholar]
- 32.Sandhu P., Guo Z., Baba T., Martin M. V., Tukey R. H., Guengerich F. P. (1994) Arch. Biochem. Biophys. 309, 168–177 [DOI] [PubMed] [Google Scholar]
- 33.Hanna I. H., Teiber J. F., Kokones K. L., Hollenberg P. F. (1998) Arch. Biochem. Biophys. 350, 324–332 [DOI] [PubMed] [Google Scholar]
- 34.Isin E. M., Guengerich F. P. (2007) J. Biol. Chem. 282, 6863–6874 [DOI] [PubMed] [Google Scholar]
- 35.Guengerich F. P., Krauser J. A., Johnson W. W. (2004) Biochemistry 43, 10775–10788 [DOI] [PubMed] [Google Scholar]
- 36.Patil P. V., Ballou D. P. (2000) Anal. Biochem. 286, 187–192 [DOI] [PubMed] [Google Scholar]
- 37.Guengerich F. P., Bartleson C. J. (2007) in Principles and Methods of Toxicology (Hayes A. W. ed) 5th Ed., pp. 1981–2048, CRC Press, Boca Raton, FL [Google Scholar]
- 38.Lephart E. D., Simpson E. R. (1991) Methods Enzymol. 206, 477–483 [DOI] [PubMed] [Google Scholar]
- 39.Zhou D. J., Korzekwa K. R., Poulos T., Chen S. A. (1992) J. Biol. Chem. 267, 762–768 [PubMed] [Google Scholar]
- 40.Yun C. H., Miller G. P., Guengerich F. P. (2000) Biochemistry 39, 11319–11329 [DOI] [PubMed] [Google Scholar]
- 41.Kuzmic P. (1996) Anal. Biochem. 237, 260–273 [DOI] [PubMed] [Google Scholar]
- 42.Johnson K. A., Simpson Z. B., Blom T. (2009) Anal. Biochem. 387, 20–29 [DOI] [PubMed] [Google Scholar]
- 43.Richardson T. H., Jung F., Griffin K. J., Wester M., Raucy J. L., Kemper B., Bornheim L. M., Hassett C., Omiecinski C. J., Johnson E. F. (1995) Arch. Biochem. Biophys. 323, 87–96 [DOI] [PubMed] [Google Scholar]
- 44.Kellis J. T., Jr., Vickery L. E. (1984) Science 225, 1032–1034 [DOI] [PubMed] [Google Scholar]
- 45.Guo Z., Gillam E. M., Ohmori S., Tukey R. H., Guengerich F. P. (1994) Arch. Biochem. Biophys. 312, 436–446 [DOI] [PubMed] [Google Scholar]
- 46.Schenkman J. B., Remmer H., Estabrook R. W. (1967) Mol. Pharmacol. 3, 113–123 [PubMed] [Google Scholar]
- 47.Falk J. E. (1964) Porphyrins and Metalloporphyrins: Their General, Physical and Coordination Chemistry, and Laboratory Methods, Elsevier, Amsterdam, pp. 213–230 [Google Scholar]
- 48.Fersht A. (1999) Structure and Mechanism in Protein Science, p. 158, W. H. Freeman and Company, New York, NY [Google Scholar]
- 49.Johnson K. A. (1998) Curr. Opin. Biotechnol. 9, 87–89 [DOI] [PubMed] [Google Scholar]
- 50.Nakayama K., Puchkaev A., Pikuleva I. A. (2001) J. Biol. Chem. 276, 31459–31465 [DOI] [PubMed] [Google Scholar]
- 51.Yoshida N., Osawa Y. (1991) Biochemistry 30, 3003–3010 [DOI] [PubMed] [Google Scholar]
- 52.Tan L., Muto N. (1986) Eur. J. Biochem. 156, 243–250 [DOI] [PubMed] [Google Scholar]
- 53.Hosea N. A., Guengerich F. P. (1998) Arch. Biochem. Biophys. 353, 365–373 [DOI] [PubMed] [Google Scholar]
- 54.Tomaszewski M., Charchar F. J., Maric C., Kuzniewicz R., Gola M., Grzeszczak W., Samani N. J., Zukowska-Szczechowska E. (2009) Atherosclerosis 203, 257–262 [DOI] [PMC free article] [PubMed] [Google Scholar]
- 55.Isin E. M., Guengerich F. P. (2006) J. Biol. Chem. 281, 9127–9136 [DOI] [PubMed] [Google Scholar]
- 56.Fishman J., Dixon D. (1967) Biochemistry 6, 1683–1687 [DOI] [PubMed] [Google Scholar]
- 57.Shimizu Y., Yarborough C., Osawa Y. (1993) J. Steroid Biochem. Mol. Biol. 44, 651–656 [DOI] [PubMed] [Google Scholar]
- 58.Osawa Y., Higashiyama T., Shimizu Y., Yarborough C. (1993) J. Steroid Biochem. Mol. Biol. 44, 469–480 [DOI] [PubMed] [Google Scholar]
Associated Data
This section collects any data citations, data availability statements, or supplementary materials included in this article.


