

Abstract
Hepatitis C virus (HCV) NS3 protein has two enzymatic activities of helicase and protease that are essential for viral replication. The helicase separates the strands of DNA and RNA duplexes using the energy from ATP hydrolysis. To understand how ATP hydrolysis is coupled to helicase movement, we measured the single turnover helicase translocation-dissociation kinetics and the pre-steady-state Pi release kinetics on single-stranded RNA and DNA substrates of different lengths. The parameters of stepping were determined from global fitting of the two types of kinetic measurements into a computational model that describes translocation as a sequence of coupled hydrolysis-stepping reactions. Our results show that the HCV helicase moves with a faster rate on single stranded RNA than on DNA. The HCV helicase steps on the RNA or DNA one nucleotide at a time, and due to imperfect coupling, not every ATP hydrolysis event produces a successful step. Comparison of the helicase domain (NS3h) with the protease-helicase (NS3-4A) shows that the most significant contribution of the protease domain is to improve the translocation stepping efficiency of the helicase. Whereas for NS3h, only 20% of the hydrolysis events result in translocation, the coupling for NS3-4A is near-perfect 93%. The presence of the protease domain also significantly reduces the stepping rate, but it doubles the processivity. These effects of the protease domain on the helicase can be explained by an improved allosteric cross-talk between the ATP- and nucleic acid-binding sites achieved by the overall stabilization of the helicase domain structure.
Keywords: ATPases, Coupling Factors, Energetics, Enzyme Kinetics, Enzyme Mechanisms, Hepatitis Virus, RNA Helicase, RNA Metabolism, Helicase-Protease, Translocation
Introduction
Hepatitis C virus (HCV)4 is the causative agent of non-A, non-B hepatitis, and it has infected ∼180 million individuals worldwide (1). The HCV genome is a positive RNA strand that is translated into a polypeptide of 9600 residues in length. Post-translational cleavage of the polypeptide yields the structural and non-structural proteins of the HCV. The non-structural protein NS3 is a multifunctional enzyme with protease and NTPase-helicase activities (2). The chymotrypsin-like protease activity resides in the N-terminal domain that complexes with the NS4A protein (3) and is responsible for the post-translational processing of the polyprotein at the NS3-4A-4B-5A-5B junctions (4, 5). The helicase activity resides in the C-terminal domain of the NS3 (6). It is a superfamily 2 DEXH/D helicase that has the ability to separate the strands of both dsDNA and dsRNA (7–13). The two domains of the HCV NS3 have been expressed separately into active proteins. However, when present in a single polypeptide they appear to enhance each other's activity by mechanisms that are not fully understood. The NS3-NS4A, for example, exhibits significantly higher protease activity (14), and the protease domain has been reported to increase the processivity of dsRNA unwinding (10, 13, 15).
Translocation along single-stranded nucleic acid (ssNA) is considered one of the key activities of helicases for unwinding duplex substrates. Many superfamily 1 and 2 helicases have been demonstrated to translocate along ssDNA with the same unidirectional bias they display while unwinding their duplex substrates (16–19). The ability to move along ssNA processively facilitates unwinding, because the helicase can employ this activity to unwind stretches of duplex nucleic acids longer than its binding site through sequential translocation and base pair destabilization steps. On the other hand, several DEAD box RNA helicases have been proposed to unwind duplex substrates through local duplex unwinding without processive helicase translocation (20, 21). Translocation of the HCV helicase on ssNA is not well studied. Despite the indirect evidence that it is capable of both ssDNA and ssRNA translocation (22, 23), it is not known whether the HCV helicase can translocate processively in the absence of the single-stranded/double-stranded junction in the unwinding substrates.
Helicase translocation is a periodic stepwise process driven by ATP hydrolysis. In the course of the ATPase cycle, transitions of the ATP-binding site between different states (e.g. empty, ATP-bound) are coupled to conformational changes of the nucleic acid-binding site that are responsible for the movement of the helicase in the specific direction (24–26). The ATPase cycle confers the basic level of periodicity on the translocation process. The distance traveled by the helicase between consecutive ATP hydrolysis events is described as a chemical step (27).
During stepping, the nucleic acid-binding site of the helicase alternates between strong and weak affinity states (26). Strong affinity results from the interactions of specific amino acid residues of the helicase with the bases, sugar, and phosphate backbone of the nucleic acid. There is structural and functional evidence that the NS3h protein interacts with eight nucleotides of its substrate (9, 28). Due to specific bonding and steric constraints, tight interactions between helicase and the nucleic acid strand are possible only if the helicase is located at discrete positions spaced by one nucleotide along the substrate. Because the chemical steps move the helicase between discrete positions on the nucleic acid, the size of a chemical step is expected to be an integer number of nucleotides.
Thermal fluctuations play a major role in the mobility of nanometer-scale objects, including helicases, which, like other molecular motors, have most likely evolved to take advantage of this phenomenon to aid in translocation. Therefore, translocation is expected to be a stochastic process, whereby each stepping reaction leaves the helicase molecule at the same position, moves it one or several nucleotides forward, or even in the opposite direction. The probabilities of each outcome (probability mass function) represent a detailed description of coupling between ATP hydrolysis and movement. The uncertainty of the stepping reaction is one of the reasons for observing a fractional average step size.
The step size of a helicase is often determined using ensemble single turnover kinetics or single molecule kinetics of unwinding (29–33). The kinetics of unwinding in such measurements is dictated by a sequence of rate-limiting steps that lead to the observed product. Ideally, the sequence is dominated by the chemical steps: reactions of hydrolysis-stepping cycle repeated with constant rates. In such case, the number of steps, the limiting rates, and the step size can be accurately estimated. In practice, the observed stepping in the kinetic measurements may be dictated by steps other than the chemical steps. In ensemble kinetics, the shape of the reaction kinetics is often affected by several factors that produce an appearance of stepping with step size larger than the chemical step (27, 34, 35). For example, if a subpopulation of the helicase translocates with the same step size, but a slower rate, due to partial misfolding, proteolysis, or oxidation, the step size will appear to be larger than the chemical step. Slow transitions of the helicase between states with different kinetic properties create dynamic subpopulations that can be responsible for step size overestimation. An example of such transition that results in an apparently large kinetic step size of 18 bp for the HCV NS3 helicase is the proposed binding and slow release of the product strand during dsRNA unwinding. Binding of the product strand to the secondary nucleic acid-binding site of NS3 reduces the rate of its subsequent steps until the release event restores it (36). Such events can also affect the observed step sizes by single molecule methods. Optical trap experiments with the HCV NS3 helicase have measured a large step size of 11 bp for dsRNA unwinding and substeps of 2–3 bp (33). Similarly, single molecule fluorescence resonance energy transfer studies of the HCV NS3 have measured step sizes of 3 bp and substeps of 1 bp for dsDNA unwinding (33). Recent crystal structure studies of the HCV NS3h helicase suggest a step size of 1 bp/ATP (24).
The first goal of this report was to determine the chemical step size of the HCV helicase to understand how ATP hydrolysis is coupled to movement during translocation. To that end, we measured the pre-steady-state kinetics of the two reactions that are linked to translocation: helicase dissociation from the end of linear ssNA substrates of increasing lengths and ATP hydrolysis on these substrates (37). Helicase dissociation kinetics was measured in real-time by taking advantage of the increase in the intrinsic fluorescence of NS3 after dissociation from the ssNA (9). The dissociation also leads to a reduced ATP hydrolysis rate making it possible to use pre-steady-state ATPase kinetics to study translocation. Determining the ATPase kinetics were particularly important for this study, because the Pi released served as a measure of the number of hydrolysis cycles undergone by the system, allowing us to estimate the parameters of the mechanochemical step. Helicase dissociation and ATPase kinetics were measured with ssNA substrates of different lengths. The experimental results were globally fit into a computational model that represents translocation as a sequence of coupled hydrolysis-stepping reactions. The analysis shows that in all cases the HCV helicase moves with a step size of one nucleotide.
The second goal was to study how translocation is influenced by the type of the nucleic acid backbone and by the protease domain of NS3. Using computational fitting of the dissociation and ATPase data, we found that NS3h steps nearly five times faster on ssRNA than on ssDNA. Faster stepping of NS3h on ssRNA comes at the expense of processivity. The rate of dissociation from the middle of ssRNA is 10 times greater than from ssDNA. We find that the most significant contribution of the protease domain to the helicase activity is to improve the stepping efficiency of the helicase. In the absence of the protease domain, the helicase takes a step after four unsuccessful attempts, giving the total of five ATP molecules per nucleotide translocation. In contrast, the two-domain helicase-protease enzyme stumbles on an average only once in 13 steps consuming 1.1 ATP molecules per nucleotide.
EXPERIMENTAL PROCEDURES
The [γ-32P]ATP was purchased from Amersham Biosciences. All other chemicals were purchased of reagent grade from Sigma. Tween 20 used in all buffers was passed though activated charcoal to remove fluorescent contaminants. Unless stated otherwise, all assays were conducted at 22 °C in reaction buffer containing 50 mm MOPS-Na, pH 7, 5 mm MgCl2, 5 mm dithiothreitol, and 0.1% Tween 20. All chemicals used in the Pi release experiments were ultrapure grade and phosphate-free. Dextran sulfate (Mr ∼ 10,000) used in the experiments was dialyzed extensively against Pi-free reaction buffer to remove any contaminating phosphates. Pre-steady-state kinetics was measured using a stopped-flow instrument (KinTek Corp., Austin, TX).
Proteins and Nucleic Acids
The helicase domain of HCV NS3 protein was overexpressed in Escherichia coli carrying pET21b-NS3HCV plasmid (28). NS3h (GenBankTM accession number M62321) was purified to a final concentration of 105 μm by metal-immobilization chromatography through its C-terminal hexa-His tag and stored in a buffer containing 50 mm MOPS-Na, pH 7, 0.5 mm MgSO4, 5 mm dithiothreitol, and 20% glycerol as described previously (38). NS3-4A used in the experiments is a single-chain construct where the NS4A fragment is covalently attached to the N terminus of the NS3 protein (39). The NS3-4A protein (GenBank accession number M58335) was purified to a final concentration of 9.3 μm as previously described and stored in a buffer containing 25 mm HEPES-Na, pH 7.5, 10 mm β-mercaptoethanol, 300 mm NaCl, and 10% glycerol (39). Protein concentrations were determined from absorbance at 280 nm in 8 m urea. The extinction coefficient of NS3h (47,600 m−1 cm−1) and NS3-4A (102,000 m−1cm−1) was calculated by adding molar extinction coefficients of tryptophan (5690 m−1 cm−1) and tyrosine (1280 m−1 cm−1) residues. The protein concentration was also checked using the Bradford method using bovine serum albumin as a standard (40).
The recombinant E. coli phosphate-binding protein was purified and modified with N-[2-(1-maleimidyl)ethyl]-7-(diethylamino)coumarin-3-carboxamide (MDCC) as described previously (41).
To avoid effects of secondary structure on translocation, all oligonucleotides used in this study were homopolymeric oligo(dT) and oligo(rU). The oligodeoxyribonucleotides were purchased from IDT DNA Technologies (Coralville, IA) and purified by denaturing PAGE containing 8 m urea and purified from the gel by electro-elution (Schleicher & Schüll). The oligoribonucleotides were purchased RNase-free high-performance liquid chromatography purified from Dharmacon Inc. (Lafayette, CO). The concentration of the oligonucleotides was determined by carrying out complete hydrolysis of the oligonucleotide to its individual nucleotides using snake venom phosphodiesterase (Sigma) and measuring its absorbance at 260 nm. The concentration determined represents oligonucleotide strands.
Steady-state ATPase Assay
In these experiments, 40 nm of the enzyme (NS3h or NS3-4A) was preincubated with 400 nm of single-stranded oligonucleotide (ssDNA or ssRNA). This was mixed with an equal volume of 1 mm ATP spiked with [γ-32P]ATP. The reaction was incubated for specified intervals of time (20–300 s), and stopped with 4 n HCOOH. 0.5 μl of each time point of the reaction was spotted onto a polyethyleneimine cellulose TLC plate. The hydrolyzed Pi was separated from the unhydrolyzed ATP using 0.4 m potassium phosphate (pH 3.4) as the chromatographic buffer and quantified using a PhosphorImager (Amersham Biosciences). The molar Pi was plotted against time of reaction, and the slopes provided the velocities. The velocities were divided by enzyme concentration to obtain the ATPase rate constant (s−1).
Helicase Dissociation Kinetics
To measure kinetics of HCV helicases dissociation from ssNA substrates, 40 nm of the enzyme (NS3h or NS3-4A) was preincubated with 400 nm single-stranded oligonucleotide (ssDNA or ssRNA). This was rapidly mixed with an equal volume of 1 mm ATP and 2.5 mm dextran sulfate in a stopped-flow instrument. The reaction was monitored using the protein's intrinsic tryptophan fluorescence. Protein fluorescence was excited at 280 nm, and the emission was measured using a 345 nm low pass filter and a slit size of 0.5 mm. The assay was carried out with NS3h and NS3-4A proteins and DNA and RNA substrates of different length. For each protein-substrate pair, seven or eight time courses were collected. Protein dissociation from the ssNA resulted in an increase in the intrinsic protein fluorescence. The kinetic traces were averaged and fit to an exponential equation to obtain the dissociation rate constant.
Helicase translocation rate was estimated from the effect of the substrate length on the observed dissociation rate. The estimate is based on the following assumptions. During preincubation the helicase binds to a random position of ssNA substrate. After mixing with ATP and trap, the helicase translocates in the 5′ direction, reaches the end of the substrate, and dissociates producing the observed fluorescence increase. Let us consider a scenario where a helicase with a binding site B nucleotides translocates on an ssNA of L nucleotides in length. The enzyme can occupy any of N = L − B + 1 locations on the substrate, assuming that it must make all the contacts to remain bound, without hanging from the ends. An enzyme bound to a position i has to travel N − i nt to reach the end of the substrate. For a population of enzymes, the average distance traveled is given by Equations 1 and 2.
 |
 |
Therefore the translocation rate was roughly estimated from the inverse slope of retention time versus ssNA length and dividing it by 2.
Phosphate Release Kinetics
The ATPase rate was measured in real-time from the phosphate release kinetics using a coupled enzyme assay. The methodology involves the use of phosphate-binding protein (PBP) labeled with MDCC (41, 42). When NS3h hydrolyzes ATP and releases ADP and Pi, the Pi released is bound up by the PBP. The protein binds Pi tightly (KD = 0.1 μm) and rapidly (rate constant = 1.4 × 10⁸ m−1 s−1 at 20 °C) and results in an ∼8-fold enhancement in the fluorescence emission. This approach has been used to characterize several ATPases (41, 43–50).
In these experiments, 40 nm of the enzyme (NS3h or NS3-4A) was preincubated with 400 nm of the ss RNA or ssDNA substrate along with 15 μm MDCC-PBP in the Reaction Buffer without dithiothreitol. To initiate the reaction this solution was rapidly mixed with an equal volume of 1 mm ATP. In the case of NS3-4A helicase, 2.5 mm dextran sulfate was included with the ATP solution. To remove any contaminating inorganic phosphate, Pi-mop consisting of 0.5 mm 7-methyl guanosine and 0.1 unit/ml purine nucleotide phosphorylase was added to both solutions followed by 10-min incubation at room temperature to remove any contaminating Pi in solution. The syringes of the stopped-flow instrument were also treated with Pi-mop for 30 min before the experiments. However, the Pi-mop used to treat the instrument syringes consisted of 0.5 mm 7-methyl guanosine and 1.0 unit/ml purine nucleotide phosphorylase to account for the greater volume and larger surface area of the syringes. MDCC-PBP fluorescence was excited at 425 nm, and the emission was measured using a 450 nm low pass filter, with a slit size of 1 mm. To calibrate the fluorescence signal, 15 μm MDCC-PBP was rapidly mixed with different concentrations of Pi. The observed fluorescence as a function of [Pi] was fit into a straight line, and the proportionality coefficient was used for converting MDCC-PBP fluorescence to Pi concentration.
Pi release kinetics from NS3h-catalyzed reactions was measured with ssDNA and ssRNA, and of NS3-4A with ssRNA of increasing length. For each protein-ssNA pair, seven or eight time courses were collected, converted to molar ratio [Pi]/[NS3], averaged, and fit to Equation 3,
where a is the burst amplitude, k is burst rate constant, t is time, b is the steady-state rate, and p0 is the y-intercept. Confidence intervals for the kinetic constants were estimated by fitting individual time traces.
Modeling and Data Analysis
The helicase translocation model was programmed in MATLAB (The MathWorks, Inc., Natick, MA). Mass-action reactions for dissociation and Pi release experiments generated by the model were converted into ordinary differential equations and solved using the rsys library. The solutions were used for calculating the experimentally observed helicase fluorescence and Pi concentration.
Experimental data were arranged into three datasets: NS3h/DNA, NS3h/RNA, and NS3-4A/RNA. Each dataset contained from 11 to 17 helicase dissociation and Pi release experiments performed with substrates of different length. To automatically connect the model to experiments of different types, simulations and fitting was performed using gfit, an open source program for global analysis of experimental data (51). Experiments from each dataset were globally fit into the translocation model. During fitting, model parameters related to translocation mechanism (e.g. step size and dissociation rate) were applied globally, that is, the same value was used for simulation of every experiment. Other parameters (e.g. fluorescence offset) were allowed to vary individually for each experiment.
Optimization was performed using weighted least squares objective function. To compensate for the dynamic range difference between dissociation and phosphate release experiments, statistical weights of, respectively, 50 and 0.1 were assigned. A trust-region reflective Newton algorithm was used for local gradient optimization. For global search of the parameter space, gradient optimization was coupled with a random restart algorithm, which repeated the gradient optimization from random starting values thousands of times until many best fits with close proximity to one another were found. The model, data, and the software for simulation and analysis are available on-line.
RESULTS
In this study, we have used two different constructs of the HCV helicase, the protease-helicase NS3-4A (39) and the helicase domain NS3h (28), to characterize the kinetics of translocation along ssDNA and ssRNA. NS3-4A is a single-chain construct in which the NS4A fragment is covalently attached to the N terminus of the NS3 protein. The nucleic acid substrates used in this study were homopolymeric to avoid sequence and secondary structure effects on translocation.
Translocation Mechanism
The reactions involved in helicase translocation along ssNA are shown in Fig. 1. The assays start by preincubating the helicase with a 10-fold molar excess of the ssNA substrate in the absence of ATP. Under these conditions, very few substrate molecules will have more than one helicase bound. It is assumed that the helicase binds to all sites with an equal affinity and rate constant. Addition of ATP initiates its hydrolysis and causes the helicase to step forward. After repeated hydrolysis-stepping, the helicase translocates to the end of the substrate and dissociates from it. The helicase may also dissociate from the middle of the ssNA. Free helicase hydrolyzes ATP at a lower rate and, in the absence of a trap, can re-bind the ssNA substrate.
FIGURE 1.

The model of helicase translocation along single-stranded nucleic acid. The helicase molecules are shown as small filled triangles bound at discrete positions on the ssNA substrate; the helicase-binding site, however, spans many nucleotides. The helicase bound to the ssNA hydrolyzes ATP at a rate constant kS. Each ATP hydrolysis event is accompanied by a translocation step. The size of each translocation step is a random integer with a mean μ. Helicase steps beyond the substrate's boundaries result in protein dissociation from the ssNA. The free helicase molecules hydrolyze ATP at a rate constant katp and, in the absence of a trap, re-binds the ssNA with a bimolecular rate constant kon.
Steady-state ATPase Is Stimulated by Nucleic Acids in a Length-dependent Fashion
Previously, it was shown that NS3h and NS3-4A proteins bind ssNA substrates with nanomolar Kd, have low intrinsic ATPase activity, and hydrolyze ATP at a higher rate in the presence of ssNA (9, 13, 52). Here, we have measured the steady-state ATPase rates of NS3h and NS3-4A with ssDNA and ssRNA substrates of different lengths. The ssNA-stimulated ATPase rates of both enzymes increased with increasing length of the ssNA to reach a saturating value (Fig. 2 and supplemental Table S1). The ssRNA stimulated the ATPase activity of NS3h and NS3-4A enzymes about 10 times more than the ssDNA substrate. The increase in the steady-state ssNA-stimulated ATPase activity with increasing ssNA length is consistent with the translocation mechanism that involves ATP hydrolysis, translocation, and dissociation from the end of the linear ssNA substrate (53, 54).
FIGURE 2.

Steady-state ATPase rate constant as a function of ssNA lengths. The ATPase rate constants of NS3h (A and B) and NS3-4A (C and D) were measured by a radiometric assay as described under “Experimental Procedures” in the presence of a 10-fold molar excess of ssDNA (A and C) or ssRNA (B and D). The ATPase rate constants are plotted as a function of substrate length. The ATPase rate constants at zero ssNA length are the intrinsic activity in the absence of ssNA. The ATPase rate constants measured in the presence of poly(dT) and poly(rU) are plotted against the average length of the polymers reported by the manufacturer.
Kinetics of Helicase Dissociation from Nucleic Acids of Different Length
A helicase translocating along linear ssNA will dissociate upon reaching the end of the substrate. Because the intrinsic fluorescence of the NS3 helicase is quenched upon binding to the ssNA, its movement along ssNA can be studied by a continuous fluorescence-based assay that measures the fraction of NS3 associated with the ssNA at any time (9, 17, 26, 55). In stopped-flow assays carried out at 22 °C, NS3 proteins preincubated with a 10-fold excess of ssNA were mixed with an equal volume of ATP and dextran sulfate trap to initiate the translocation process. The low NS3/ssNA ratio ensured that the majority of the NS3-ssNA complexes contained only one NS3 molecule. Excess of the dextran sulfate trap added simultaneously with ATP prevented the re-binding of NS3 to ssNA (56). Binding to the dextran sulfate trap did not change the fluorescence properties of the NS3 proteins. Therefore, the observed increase in fluorescence was due to the dissociation of the NS3-ssNA complex. The helicase dissociation assays were performed with ssDNA and ssRNA substrates of increasing length with both NS3h and NS3-4A proteins.
Dissociation Kinetics of NS3h Helicase Domain
The time-dependent increase in fluorescence due to helicase dissociation (Fig. 3A) was fit into a single exponential equation to obtain the helicase dissociation rate constants. The dissociation rate constants of NS3h-ssDNA decreased with increasing ssDNA length (Fig. 3B). The inverse of the dissociation rate constants or the retention times increased linearly up to 20–25 nt of ssDNA (Fig. 3C). The linear increase in the retention times with increase in ssDNA length is consistent with NS3h translocating unidirectionally on ssDNA. The initial slope of the retention time plot after dividing by two provides a rough estimate of the translocation rate of NS3h on DNA as 1.73 ± 0.1 nt/s (Equations 1 and 2). The decreasing slope of the retention time plot after 20–25 nt indicates finite processivity and helicase dissociation from the middle of the longer DNAs before reaching its end.
FIGURE 3.

Single-turnover dissociation kinetics of NS3h from ssDNA and ssRNA of different lengths. A, time-dependent increase in fluorescence of NS3h due to dissociation from dT14 ssDNA (gray dots) fit into an exponential equation (black line) with a rate of 0.43 ± 0.04 s−1. B, the observed NS3h exponential dissociation rates plotted as a function of ssDNA length. C, the inverse of the dissociation rate, the retention time, is plotted as a function of ssDNA length. D, time-dependent increase in fluorescence of NS3h due to dissociation from rU15 ssRNA (gray dots) fit into exponential equation (black line) with a rate of 2.11 ± 0.06 s−1. E, the observed NS3h exponential dissociation rates plotted as a function of ssRNA length. F, the retention time versus ssRNA length.
As with ssDNA, a time-dependent increase in NS3h fluorescence was observed with ssRNA upon addition of ATP (Fig. 3D). The observed dissociation rate constants decreased with increasing ssRNA length (Fig. 3E), and the retention times increased linearly without reaching a plateau for substrates of up to 45 nt (Fig. 3F). This result suggests a higher processivity of NS3h translocation on ssRNA. The translocation rate of NS3h on ssRNA estimated from the slope of retention time was 20.1 ± 0.02 nt/s, which is about 10 times faster than on ssDNA.
Dissociation Kinetics of NS3-4A Helicase-Protease
The translocation-dissociation kinetics of the full-length HCV NS3-4A protease-helicase was studied using the same assay and conditions as with the NS3h. As was seen with the NS3h, the observed dissociation rate constants of NS3-4A decreased with increasing length of ssDNA and ssRNA (Fig. 4, A and C). Retention times on ssDNA or ssRNA increased linearly with the substrate length of up to 25 nt (Fig. 4, B and D). The translocation rate of NS3-4A on ssDNA estimated from the slope was 1.31 ± 0.03 nt/s. The estimated translocation rate of NS3-4A on ssRNA was substantially higher at 12.5 ± 0.06 nt/s. Thus, both NS3h and NS3-4A translocate on ssRNA ∼10 times faster than on ssDNA.
FIGURE 4.

Single-turnover dissociation kinetics of NS3-4A from ssDNA and ssRNA of different lengths. A, plot of the protein dissociation rates as a function of increasing ssDNA length. B, the retention time versus ssDNA length. C, plot of the protein dissociation rates as a function of ssRNA length. D, the retention time as a function of ssRNA length.
Pre-steady-state ATPase Kinetics
Measurements of the helicase dissociation kinetics from different lengths of ssNA quantify the translocation steps that precede dissociation. A somewhat different view of translocation can be obtained by measuring the kinetics of another reaction linked to translocation: ATP hydrolysis. A translocating helicase hydrolyzes ATP at a higher rate, which decreases after the helicase dissociates from the substrate. To directly measure the amount of ATP used for translocation and to make an independent estimation of the rates of translocation, we measured the pre-steady-state kinetics of the ATPase reaction with different lengths of ssNA using the phosphate release assay. This assay measures the concentration of inorganic phosphate (Pi), a product of ATP hydrolysis, in real-time. The released Pi binds to the PBP that is fluorescently labeled at the genetically engineered cysteine residue resulting in an 8-fold increase of PBP fluorescence (41, 42).
To make the ATPase kinetics measurements directly comparable to the kinetics of dissociation, the PBP assays were performed in the stopped-flow instrument using the same syringe configuration, the same concentrations of enzyme, ATP, and the ssNA substrates as in the helicase dissociation assays. The reactions were initiated by rapidly mixing the helicase pre-bound to ssNA with a mixture of ATP and PBP. The observed kinetics of Pi release was biphasic with an exponential burst followed by a slower steady-state linear rate. These observations are consistent with helicase translocation on ssNA followed by dissociation that reduces the ATPase rate.
Pi Release Kinetics of NS3h Helicase
The burst phase of the Pi release kinetics with the ssDNA substrates (Fig. 5A) was subtler than the burst phase with ssRNA (Fig. 5D). However, the burst phase amplitudes increased with increasing length of ssDNA (Fig. 5B), and the burst phase rate constants (exponential rate constant) decreased with increasing ssDNA length (Fig. 5B). The inverse of the burst rate constants, the retention time, increased with ssDNA lengths (Fig. 5C). This observation is consistent with that of the protein dissociation kinetics and provides additional evidence for unidirectional translocation of NS3h on ssDNA.
FIGURE 5.

Effect of nucleic acid length on pre-steady-state ATPase kinetics. Pi release kinetics was measured in the presence of ssNA substrates of different length. A–C show data obtained with NS3h helicase and ssDNA substrates. D–F show data obtained with NS3h and ssRNA substrates. G–I show data for NS3-4A helicase and ssRNAs. A, D, and G show concentrations of Pi normalized by helicase concentration plotted as a function of time. The traces were fit into Equation 3, and the exponential burst rate constants k (triangles) and their amplitudes a (circles) are shown in B, E, and H as a function of substrate length. C, F, and I show reciprocals of the exponential rates, 1/k, the retention time, as a function of substrate length.
The translocation rate of NS3h on ssDNA as analyzed from the retention time plots was estimated to be 1.17 ± 0.03 nt/s, which is close to 1.7 ± 0.08 nt/s obtained from similar analysis of the protein dissociation kinetics (Fig. 4). The initial slope of the Pi release burst, calculated as a product of the burst amplitude and the burst rate constant, remained constant with ssDNA length (supplemental Fig. S1A). Its value was similar to the ATPase rate measured radiometrically with longer substrates (Fig. 2A and supplemental Table S1). This indicates that the length of the substrate does not affect the initial rates of ATP hydrolysis and also suggests that the majority of the helicase population is in the bound state on all substrates.
The burst phase of the NS3h Pi release kinetics with the ssRNA substrates was quite prominent (Fig. 5D). The Pi release burst amplitude increased with ssRNA length and the burst rates decreased (Fig. 5E), while the retention time increased with increased ssRNA length (Fig. 5F). The analysis of the retention time plot provided an estimate of the translocation rate of NS3h on ssRNA to be 22.4 ± 0.07 nt/s, which is in good agreement with 20.1 ± 0.02 nt/s obtained from the protein dissociation experiments. Similarly, the initial slope of the burst phase was length-independent and close in value to the saturating ATPase rate measured radiometrically (supplemental Fig. S1B and Table S1).
Pi Release Kinetics of NS3-4A
The Pi release kinetics of NS3-4A on ssDNA could not be measured reliably due to the slow ATPase rate of NS3-4A, both intrinsic and in presence of ssDNA (Fig. 2C). The ssRNA stimulated the ATPase activity of NS3-4A to a greater extent, but a distinct pre-steady-state burst of Pi release was not observed (supplemental Fig. S2). To differentiate the burst phase of the reaction from the steady-state phase, we used dextran sulfate as the protein trap, as with the protein dissociation assays (Fig. 5G). The presence of dextran-sulfate prevented the enzyme from rebinding to the ssRNA, reducing the experimental conditions to single-turnover for protein binding and translocation. The kinetics of Pi release in the presence of the trap was unaffected at the initial time points, indicating that the trap does not alter the kinetic behavior of the protein but merely prevents it from rebinding to the ssRNA once it dissociates (supplemental Fig. S2).
As was observed with NS3h, increasing ssRNA length resulted in decreasing burst rate constants of Pi release and increasing burst amplitudes (Fig. 5H). The retention times increased linearly with substrate lengths of up to 30 nt (Fig. 5I). The initial Pi release rate constant was 8.1 ± 0.6 s−1 (supplemental Fig. S1C), and this value agrees well with the radiometrically measured PolyU-stimulated ATPase rate of 8.2 ± 0.4 s−1 (Fig. 2D and supplemental Table S1). The translocation rate was estimated to be 15.6 ± 0.12 nt/s, which is in good agreement with the 12.5 ± 0.06 nt/s value obtained from the protein dissociation experiments.
The Model of Translocation
Rigorous analysis of the helicase dissociation and ATPase kinetic data is required to test the helicase mechanism and to estimate the translocation parameters. We therefore built a model of translocation that would globally fit the two types of experimental results. The model assumes that the helicase binds ssNA substrate only at discrete positions one nucleotide apart from each other (Fig. 1). The total number of positions N = L − B + 1, where L is the length of the substrate and B is the minimal binding site. Helicase molecules bound at each position are treated by the model as distinct reacting species.
The pre-steady-state experiments start with the preincubation of the helicase (400 nm) with ssNA substrate (40 nm) in the absence of ATP. Under these conditions, few substrates are occupied by more than one helicase molecule. Because the HCV helicase is known to bind the substrate with nanomolar dissociation constant (9), we assume that 100% of the helicase is bound to the substrate and the entire population is active in ATPase and translocation. Binding at each position is assumed to occur with equal affinity and rate constant kon.
Addition of ATP initiates the reactions of hydrolysis and translocation (Fig. 1). The ATP hydrolysis reaction is modeled with pseudo-first-order kinetics. The helicase may dissociate from the middle of the substrate with a rate constant koff,M. Free helicase hydrolyzes ATP with a pseudo-first-order rate constant katp,i. If permitted by the experimental conditions, the free helicase can re-bind the ssNA.
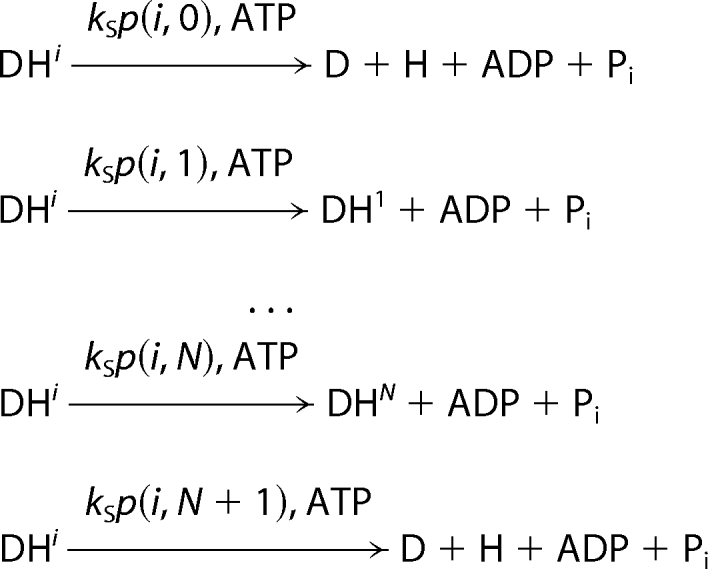
Helicase translocation is modeled as a sequence of coupled stepping-hydrolysis reactions with a rate constant kS. For a helicase (H) bound to the ssNA substrate (D) in position i (DHi), the product of stepping with an integer size S is DHi+S. Alternatively, if i + S is outside of the substrate, stepping results in dissociation. Translocation process with strong coupling, in which every hydrolysis event results in a step size S, can be described as,
 |
Translocation is most likely affected by thermal fluctuations, which are responsible for a loose coupling between hydrolysis and movement. In this case, each stepping event may produce a number of species. The probability of finding the helicase in position j after a step from position i, is given by probability mass function (PMF), p(i, j), which provides a detailed description of coupling between hydrolysis and movement,
 |
where p(i, 0) and p(i, N + 1) denote probabilities of dissociation from 3′ and 5′ ends of the ssNA, respectively and Σjp(i, j) = 1.
One hypothesis about the shape of PMF is that it is distributed normally around the initial position i with a bias (mean step size) μ and a standard deviation σ. Discrete values of stepping PMF are obtained by integrating normal probability density function over [j − 0.5, j + 0.5] to obtain the probability for the regular steps, and over (−∞, 0.5] and [N + 0.5, ∞) for the steps that lead to dissociation from 3′ and 5′ ends, respectively,
 |
where erf is the error function.
Normally distributed stepping probabilities can model a range of behaviors from deterministic unidirectional translocation (σ = 0, μ ≥ 1) to ATP-dependent diffusion (σ > 0, μ = 0). However, as σ approaches zero, the effect of the mean step size on translocation becomes increasingly discrete until the system becomes equivalent to Reactions 1 and 2 with a step size of the nearest μ integer.
Another possible form of PMF describes a stepping reaction from position i with a continuous mean step size μ that produces two products at adjacent positions j above and below i + μ,
 |
where ⌊μ⌋ is the largest integer ≤ μ and ⌈μ⌉ is the smallest integer ≥ μ.
Simulation and Global Fitting of the Kinetics Data
The helicase translocation mechanism includes helicase-nucleic acid complexes, each bound at all possible positions along the substrate, which are considered to be distinct reacting species. The number of possible positions depends on the length of the substrate and the minimal helicase-binding site on the ssNA. Because the substrate length varies from experiment to experiment, and the minimal binding site is a parameter that can change during optimization, the model uses a rule-based approach to represent a system with a variable number of species and reactions (57). To simulate each experiment, appropriate reacting species and reactions were automatically generated according to the rules programmed in MATLAB. Using the native rsys library for MATLAB, the ordinary differential equations were generated from the reactions and solved.
To fit the experimental data, the output of the model has to be directly comparable to the measured variables. Accordingly, concentrations of the reacting species obtained from solving the equations were converted into units of measured variables, which introduced additional parameters related to the measurement technique (nuisance parameters). Helicase fluorescence observed in dissociation assay was simulated as proportional to free helicase concentration with an offset. The signal of Pi release assay was simulated by offsetting the phosphate concentration. Because the effects of nucleic acid backbone and the protease domain of NS3 are not included in the model, the data for NS3h and ssDNA, NS3h and ssRNA, and NS3-4A and ssRNA were analyzed separately.
Initially, the experimental data were fit into a translocation model of deterministic stepping, where each ATP hydrolysis event is accompanied by a step of a constant size (Reactions 1 and 2). The fit, however, was not successful (data not shown) suggesting a variation of the step size. Next, models with stochastic step size variation were tested. While fitting the data into the translocation model with normally distributed stepping PMF (Equation 4), the mean step size, μ, and its standard deviation, σ, had a tendency toward 1 and 0, respectively. With σ approaching zero, however, the result of the simulation becomes a step function of μ hampering further optimization.
In contrast, the model with two-position PMF (Equation 5) produced good global fits for all three data sets (Table 1 and supplemental Fig. S3). The confidence intervals in the table were computed asymptotically. Note that, although their values are small, this type of estimate can be inaccurate for non-linear models. However, because the best fitting parameters were determined by an extensive search using a random restart algorithm, it provided a good coverage for the space of feasible parameter values. Random restart was continued until the same best optimum was rediscovered many times. The parameter sets that were away from the optimum had significantly worse objective function values. Vicinities of the best parameter sets were further searched using a version of simulated annealing algorithm. These results provide a reasonable level of confidence that the reported parameters are accurate.
TABLE 1.
Parameters of translocation
Confidence intervals were estimated asymptotically; model parameters without confidence intervals were kept constant during fitting.
| NS3h |
NS3–4A |
||
|---|---|---|---|
| ssDNA | ssRNA | ssRNA | |
| Model parameters | |||
| Binding site, B (nt) | 8 | 8 | 8 |
| Mean step size, μ (nt) | 0.2 ± 7e−4 | 0.19 ± 3e−3 | 0.93 ± 0.03 |
| Stepping-hydrolysis rate constant, ks (s−1) | 7.56 ± 0.02 | 37.3 ± 0.5 | 7.6 ± 0.1 |
| Intrinsic ATPase, ki (s−1) | 1.42 ± 7e−3 | 1.92 ± 0.05 | 0.69 ± 0.02 |
| Dissociation from middle of NA, koff (s−1) | 0.096 ± 1e−3 | 0.98 ± 0.01 | 0.61 ± 0.02 |
| NA binding, kon (μ−1 s−1) | 0.051 ± 1.3e−3 | 0.059 ± 3e−3 | 0a |
| Derived parameters | |||
| Translocation rate, ksμ (nt/s) | 1.5 | 7.1 | 7.1 |
| Processivity, ksμ/koff (nt) | 15.8 | 7.2 | 11.6 |
| ATP consumption, 1/μ (ATP/nt) | 5 | 5.3 | 1.1 |
a kon for NS3-4A/ssRNA dataset was fixed at zero, because Pi release kinetics for this pair was measured in the presence of trap, which prevented rebinding. When allowed to vary, kon converged to near-zero values.
Parameter B, the minimal binding site, is used by the model as an integer, thus preventing its optimization by gradient methods. Random restart optimization helped to overcome this limitation by testing all feasible values of B and showing that binding sites ranging from 7 to 9 nt are consistent with the NS3h data and that the binding site of NS3-4A may range from 8 to 12 nt. The size of the NS3h-binding site is known independently. Both the crystal structure and a functional fluorimetric titration assay reported the size of 8 nt (9, 28). During final optimization of all datasets, the binding site was constrained to 8 nt, although its value for NS3-4A could be larger due to additional contacts between nucleic acid and the protease domain. Although the kinetic behavior for each helicase-substrate combination is different, the values of some parameters matched between datasets. NS3h stepping on ssDNA and ssRNA occurs with the same efficiency of 20%. The rate of nucleic acid binding by NS3h is similar for ssDNA and ssRNA. These findings suggest that similarities between translocation mechanisms of NS3h and NS3-4A on ssDNA and on ssRNA run deeper than we expected. The fitting results show that, for all three datasets, the mean step size is <1 nt (Table 1). Because the two-position PMF was used to model the stepping process and because stepping of individual helicase molecules by a non-integer number of nucleotides is unlikely, this result suggests that the helicase translocates making 1-nt steps and μ should be interpreted as stepping efficiency, the probability of making a successful step after hydrolyzing one ATP molecule. The stepping efficiency of NS3h on either type of substrate is only 20%. In contrast, NS3-4A steps with near certainty moving one base forward 93% of the time. The stepping-hydrolysis rate constant of NS3h is nearly five times faster than that of NS3-4A on ssRNA; however, due to its lower average step size, the translocation rates of both proteins on ssRNA are the same (Table 1). The translocation rate of NS3h on ssDNA is however five times slower.
DISCUSSION
Helicases translocate along nucleic acids and unwind the strands of the double-stranded nucleic acids by coupling ATP hydrolysis with stepping. To quantify this process, we collected experimental data reflecting both helicase movement and ATP hydrolysis. The kinetics of helicase dissociation from ssNA of increasing lengths monitored translocation, because the helicase dissociates from the end of the ssNA at a faster rate than from the middle. The pre-steady-state kinetics of Pi accumulation provided two types of information: (a) the number of stepping-hydrolysis and intrinsic hydrolysis cycles undergone by the helicase and (b) the proportion of helicase bound to the substrate and undergoing hydrolysis-stepping. Because the observed kinetics depends on the parameters of translocation in a non-trivial manner, we analyzed the experimental data by globally fitting the two types of experiments carried out under identical conditions into the detailed translocation model (Fig. 1).
Helicase Stepping Mechanism and Efficiency
The translocation model assumes that the helicase molecules bind ssNA at discrete positions spaced by one nucleotide. By hydrolyzing ATP, the helicase moves by an integer number of nucleotides to another position on the ssNA. To test whether the size of the step is constant for every hydrolysis event, the data were fit into a model of deterministic stepping process (Reactions 1 and 2). The fit was unsuccessful, suggesting that the step size varies. Because ssNA substrates used in the experiments were homopolymers, sequence-dependent variation of the step size can be excluded. Position-dependent variation is also unlikely, because it would require helicase interaction with the substrate outside of the nucleic acid-binding site.
Therefore, we hypothesized that the step size changes randomly due to thermal fluctuations. Two distributions of step sizes were considered. The translocation model with normally distributed step sizes (Equation 4) showed a singularity as the mean and the standard deviation of step sizes approached zero and failed to fit the data. On the other hand, the model with a binary distribution of step sizes (Equation 5) behaved robustly and produced successful fits of all datasets. It describes the step sizes of two integers closest to the floating value of the mean step size parameter.
The mean step sizes estimated by global fitting were <1 nt (Table 1). The modeling indicated that the helicase moves with a fundamental step size of 1 nt, but the stepping efficiency is not 100%. A fundamental step size of 1 nt is consistent with the recently published crystal structures of the NS3h-DNA complexes in various ATP-ligand states (24) and DNA unwinding studies (33). For the mean step size 0 < μ < 1, the model describes a process with a step size of 1, where μ can be interpreted as the stepping efficiency. The mean step size, μ, of NS3h on ssDNA and ssRNA is 0.15 and 0.2 nt, respectively, and that of NS3-4A is 0.93 nt. We attribute the fractional step size to the uncertainty of the stepping reaction. Thermal fluctuations play a major role in the mobility of nanometer scale objects, including helicases, which, along with other molecular motors have most likely evolved to take advantage of this phenomenon. Therefore translocation is expected to be a stochastic process, where each stepping reaction leaves the helicase molecule at the same position and moves it one or several nucleotides forward, or even in the opposite direction. The NS3h makes a step forward, on an average, only after four unsuccessful attempts; thus, consuming a total of five ATP molecules per nucleotide translocated. In contrast to NS3h, the coupling of ATPase to translocation is tighter in NS3-4A, which fails to make a step forward, on an average, only once in 13 steps consuming 1.1 ATP molecules per nucleotide translocated.
Role of Protease Domain in Translocation
Our results show that the chemomechanical coupling in the isolated helicase domain NS3h is not perfect and that NS3h steps forward with 20% efficiency during every ATP hydrolysis. On the other hand, the protease-helicase NS3-4A steps forward with a 93% efficiency during every ATP hydrolysis. Thus, the protease domain in the NS3-4A improves the coupling between ATPase and helicase translocation. It has been suggested that the protease domain facilitates the helicase activity by making contacts with the nucleic acid (13). Perhaps the additional interactions between the protease and nucleic acid improve the coupling. Alternatively, the protease domain may cause changes in the helicase active site to improve the allosteric crosstalk between the ATP and nucleic acid-binding sites or stabilize the helicase domain to increase the stepping efficiency. Interestingly, the RNA stepping-hydrolysis rate of NS3-4A is about five times slower than that of the NS3h. The reduction of this rate could be a direct result of tighter coupling. A mechanism may exist that prevents stepping if the helicase is in a state that is unfavorable to its successful completion. This hypothesis is supported by the fact that NS3h and NS3-4A make successful steps at the same rate (translocation rate, ks×μ of 7 nt/s, Table 1).
Processivity of Translocation
Helicase processivity is the ratio between the rate of translocation and the rate of dissociation from the middle of substrate (Table 1). In the absence of ATP, binding of the helicase to nucleic acid is strong; hence, dissociation of the helicase from the NS3-ATP-nucleic acid ternary complex is the most likely cause for the limited processivity. The nucleic acid-binding properties of NS3h and NS3-4A are modulated by ATP to different extents. NS3h-ATP complex was shown to bind ssRNA approximately two times stronger than ssDNA (52, 58). However, during translocation, NS3h dissociates prematurely from ssRNA 10 times faster than from ssDNA. Because of the faster stepping rate on ssRNA, its processivity on RNA is only 2-fold lower than on DNA.
In the case of NS3-4A, ATP binding results in only a 5-fold decrease in RNA affinity (13).5 Full-length NS3-4A helicase dissociates from ssRNA 40% slower than NS3h domain and, because their translocation rates are equal, NS3-4A has proportionally higher processivity. It is possible that this modest decrease of dissociation rate is due to interaction between ssRNA and the protease domain. The processivity of HCV NS3h or NS3-4A proteins is comparable to or better than some DNA helicases such as PcrA (59) but lower than other helicases such as E. coli uvrD and T7 gp4 (17, 43, 45).
Role of Translocation Activity in Duplex Nucleic Acid Unwinding
We demonstrate here that NS3h and NS3-4A are ATP-dependent ssNA translocases. This is consistent with a recent report that shows ssDNA translocation activity of the NS3h (60). Translocation along ssNA is considered a key activity for unwinding duplex nucleic acid and for displacing proteins bound to nucleic acids (17, 18, 45, 61, 62). However, several DEAD box RNA helicases have been proposed to unwind duplex substrates without translocation wherein unwinding is achieved by multiple molecules of helicases locally separating the duplex region (20, 21). The finding that HCV helicase can translocate along ssNA without requiring the ss/ds junction indicates that HCV helicase can unwind duplex nucleic acids catalytically by moving unidirectionally along ssNA. Recent single molecule and ensemble kinetics studies have shown that HCV helicase unwinds nucleic acids by an active mechanism that involves destabilization of base pairs at the ss/ds junction (63–65). Thus, the simplest unwinding mechanism involves translocation-induced sequential destabilization and separation of base pairs.
Role of the Single-stranded RNA Translocation Activity in HCV Viral Replication
The ssNA translocation activity in addition to facilitating duplex unwinding could play a broader biological role in viral replication. Although there are currently no studies available showing the exact function of NS3 in viral replication, mutagenesis and knockdown studies indicate that the protein is indispensable for viral survival (66–68). The protease activity of NS3-4A is essential for the viral poly-protein processing (4, 5, 69) and also subsequently in downplaying the host immune responses (70–73). The helicase and ssRNA translocation activity of HCV helicase may play a role in any of the following processes: (i) generation of the minus (−) strand of the viral genome where it could assist the NS5B (RNA polymerase) by removing local secondary structures within the RNA genome during replication; (ii) generation of the plus (+) strand from the double-stranded replicative form acting as the replicative helicase unwinding the dsRNA enabling RNA polymerization by NS5B; (iii) packaging the viral genome into viral heads to generate mature virions; and (iv) remodeling RNA-protein complexes. In each of these scenarios, the helicase has to translocate on ssRNA either to unwind the duplex RNA or to displace RNA-protein complexes or to package RNA. The fact that NS3-4A carries out the ssRNA translocation function efficiently indicates a possible role of the helicase in multiple activities, a strategy often employed by viral pathogens. Thus, targeting the ssRNA translocation function could be an additional avenue for developing anti-HCV drugs.
Supplementary Material
Acknowledgments
We thank all members of the Patel laboratory for discussions and criticisms. We also thank Dr. Arvind Ayyer, Dept. of Physics, Rutgers University, for discussions.
This work was supported, in whole or in part, by National Institutes of Health Grant GM55310.

The on-line version of this article (available at http://www.jbc.org) contains supplemental Figs. S1–S3 and Table S1.
V. Rajagopal and S. S. Patel, manuscript in preparation.
- HCV
- hepatitis C virus
- ds
- double strand
- ss
- single strand
- ssNA
- single-stranded nucleic acid
- MOPS
- 4-morpholinepropanesulfonic acid
- MDCC
- N-[2-(1-maleimidyl)ethyl]-7-(diethylamino)coumarin-3-carboxamide
- nt
- nucleotide(s)
- PBP
- phosphate-binding protein
- PMF
- probability mass function.
REFERENCES
- 1.( 2000) Wkly. Epidemiol. Rec. 75, 18– 1910686829 [Google Scholar]
- 2.Tai C. L., Chi W. K., Chen D. S., Hwang L. H. ( 1996) J. Virol. 70, 8477– 8484 [DOI] [PMC free article] [PubMed] [Google Scholar]
- 3.Hahm B., Han D. S., Back S. H., Song O. K., Cho M. J., Kim C. J., Shimotohno K., Jang S. K. ( 1995) J. Virol. 69, 2534– 2539 [DOI] [PMC free article] [PubMed] [Google Scholar]
- 4.Bartenschlager R., Ahlborn-Laake L., Mous J., Jacobsen H. ( 1994) J. Virol. 68, 5045– 5055 [DOI] [PMC free article] [PubMed] [Google Scholar]
- 5.Bartenschlager R. ( 1999) J. Viral. Hepat 6, 165– 181 [DOI] [PubMed] [Google Scholar]
- 6.Kim D. W., Gwack Y., Han J. H., Choe J. ( 1995) Biochem. Biophys. Res. Commun. 215, 160– 166 [DOI] [PubMed] [Google Scholar]
- 7.Gwack Y., Kim D. W., Han J. H., Choe J. ( 1997) Eur. J. Biochem. 250, 47– 54 [DOI] [PubMed] [Google Scholar]
- 8.Wardell A. D., Errington W., Ciaramella G., Merson J., McGarvey M. J. ( 1999) J. Gen. Virol. 80, 701– 709 [DOI] [PubMed] [Google Scholar]
- 9.Levin M. K., Patel S. S. ( 2002) J. Biol. Chem. 277, 29377– 29385 [DOI] [PubMed] [Google Scholar]
- 10.Pang P. S., Jankowsky E., Planet P. J., Pyle A. M. ( 2002) EMBO J. 21, 1168– 1176 [DOI] [PMC free article] [PubMed] [Google Scholar]
- 11.Lam A. M., Keeney D., Eckert P. Q., Frick D. N. ( 2003) J. Virol. 77, 3950– 3961 [DOI] [PMC free article] [PubMed] [Google Scholar]
- 12.Frick D. N., Rypma R. S., Lam A. M., Gu B. ( 2004) J. Biol. Chem. 279, 1269– 1280 [DOI] [PMC free article] [PubMed] [Google Scholar]
- 13.Beran R. K., Serebrov V., Pyle A. M. ( 2007) J. Biol. Chem. 282, 34913– 34920 [DOI] [PubMed] [Google Scholar]
- 14.Beran R. K., Pyle A. M. ( 2008) J. Biol. Chem. 283, 29929– 29937 [DOI] [PMC free article] [PubMed] [Google Scholar]
- 15.Beran R. K., Lindenbach B. D., Pyle A. M. ( 2009) J. Virol. 83, 3268– 3275 [DOI] [PMC free article] [PubMed] [Google Scholar]
- 16.Byrd A. K., Raney K. D. ( 2004) Nat. Struct. Mol. Biol. 11, 531– 538 [DOI] [PubMed] [Google Scholar]
- 17.Fischer C. J., Maluf N. K., Lohman T. M. ( 2004) J. Mol. Biol. 344, 1287– 1309 [DOI] [PubMed] [Google Scholar]
- 18.Niedziela-Majka A., Chesnik M. A., Tomko E. J., Lohman T. M. ( 2007) J. Biol. Chem. 282, 27076– 27085 [DOI] [PubMed] [Google Scholar]
- 19.Raney K. D., Benkovic S. J. ( 1995) J. Biol. Chem. 270, 22236– 22242 [DOI] [PubMed] [Google Scholar]
- 20.Yang Q., Jankowsky E. ( 2006) Nat. Struct. Mol. Biol. 13, 981– 986 [DOI] [PubMed] [Google Scholar]
- 21.Yang Q., Del Campo M., Lambowitz A. M., Jankowsky E. ( 2007) Mol. Cell 28, 253– 263 [DOI] [PubMed] [Google Scholar]
- 22.Tackett A. J., Chen Y., Cameron C. E., Raney K. D. ( 2005) J. Biol. Chem. 280, 10797– 10806 [DOI] [PubMed] [Google Scholar]
- 23.Levin M. K., Wang Y. H., Patel S. S. ( 2004) J. Biol. Chem. 279, 26005– 26012 [DOI] [PubMed] [Google Scholar]
- 24.Gu M., Rice C. M. ( 2010) Proc. Natl. Acad. Sci. U.S.A. 107, 521– 528 [DOI] [PMC free article] [PubMed] [Google Scholar]
- 25.Liu D., Wang Y. S., Gesell J. J., Wyss D. F. ( 2001) J. Mol. Biol. 314, 543– 561 [DOI] [PubMed] [Google Scholar]
- 26.Levin M. K., Gurjar M., Patel S. S. ( 2005) Nat. Struct. Mol. Biol. 12, 429– 435 [DOI] [PubMed] [Google Scholar]
- 27.Patel S. S., Donmez I. ( 2006) J. Biol. Chem. 281, 18265– 18268 [DOI] [PubMed] [Google Scholar]
- 28.Kim J. L., Morgenstern K. A., Griffith J. P., Dwyer M. D., Thomson J. A., Murcko M. A., Lin C., Caron P. R. ( 1998) Structure 6, 89– 100 [DOI] [PubMed] [Google Scholar]
- 29.Ali J. A., Lohman T. M. ( 1997) Science 275, 377– 380 [DOI] [PubMed] [Google Scholar]
- 30.Ali J. A., Maluf N. K., Lohman T. M. ( 1999) J. Mol. Biol. 293, 815– 834 [DOI] [PubMed] [Google Scholar]
- 31.Lucius A. L., Vindigni A., Gregorian R., Ali J. A., Taylor A. F., Smith G. R., Lohman T. M. ( 2002) J. Mol. Biol. 324, 409– 428 [DOI] [PubMed] [Google Scholar]
- 32.Dumont S., Cheng W., Serebrov V., Beran R. K., Tinoco I., Jr., Pyle A. M., Bustamante C. ( 2006) Nature 439, 105– 108 [DOI] [PMC free article] [PubMed] [Google Scholar]
- 33.Myong S., Bruno M. M., Pyle A. M., Ha T. ( 2007) Science 317, 513– 516 [DOI] [PMC free article] [PubMed] [Google Scholar]
- 34.Lohman T. M., Tomko E. J., Wu C. G. ( 2008) Nat. Rev. Mol. Cell Biol. 9, 391– 401 [DOI] [PubMed] [Google Scholar]
- 35.Levin M. K., Patel S. S. ( 2002) in Molecular Motors ( Schliwa M. ed) Wiley-VCH Verlag GmbH, Weinheim, Germany [Google Scholar]
- 36.Serebrov V., Beran R. K., Pyle A. M. ( 2009) J. Biol. Chem. 284, 2512– 2521 [DOI] [PMC free article] [PubMed] [Google Scholar]
- 37.Fischer C. J., Lohman T. M. ( 2004) J. Mol. Biol. 344, 1265– 1286 [DOI] [PubMed] [Google Scholar]
- 38.Levin M. K., Patel S. S. ( 1999) J. Biol. Chem. 274, 31839– 31846 [DOI] [PubMed] [Google Scholar]
- 39.Howe A. Y., Chase R., Taremi S. S., Risano C., Beyer B., Malcolm B., Lau J. Y. ( 1999) Protein Sci. 8, 1332– 1341 [DOI] [PMC free article] [PubMed] [Google Scholar]
- 40.Bradford M. M. ( 1976) Anal. Biochem. 72, 248– 254 [DOI] [PubMed] [Google Scholar]
- 41.Brune M., Hunter J. L., Corrie J. E., Webb M. R. ( 1994) Biochemistry 33, 8262– 8271 [DOI] [PubMed] [Google Scholar]
- 42.Webb M. R. ( 2007) Mol. Biosyst. 3, 249– 256 [DOI] [PubMed] [Google Scholar]
- 43.Kim D. E., Narayan M., Patel S. S. ( 2002) J. Mol. Biol. 321, 807– 819 [DOI] [PubMed] [Google Scholar]
- 44.Soultanas P., Dillingham M. S., Wiley P., Webb M. R., Wigley D. B. ( 2000) EMBO J. 19, 3799– 3810 [DOI] [PMC free article] [PubMed] [Google Scholar]
- 45.Tomko E. J., Fischer C. J., Niedziela-Majka A., Lohman T. M. ( 2007) Mol. Cell 26, 335– 347 [DOI] [PMC free article] [PubMed] [Google Scholar]
- 46.Brune M., Hunter J. L., Howell S. A., Martin S. R., Hazlett T. L., Corrie J. E., Webb M. R. ( 1998) Biochemistry 37, 10370– 10380 [DOI] [PubMed] [Google Scholar]
- 47.White H. D., Belknap B., Webb M. R. ( 1997) Biochemistry 36, 11828– 11836 [DOI] [PubMed] [Google Scholar]
- 48.Donmez I., Patel S. S. ( 2008) EMBO J. 27, 1718– 1726 [DOI] [PMC free article] [PubMed] [Google Scholar]
- 49.Masaike T., Muneyuki E., Noji H., Kinosita K., Jr., Yoshida M. ( 2002) J. Biol. Chem. 277, 21643– 21649 [DOI] [PubMed] [Google Scholar]
- 50.McLaughlin S. H., Smith H. W., Jackson S. E. ( 2002) J. Mol. Biol. 315, 787– 798 [DOI] [PubMed] [Google Scholar]
- 51.Levin M. K., Hingorani M. M., Holmes R. M., Patel S. S., Carson J. H. ( 2009) Methods Mol. Biol. 500, 335– 359 [DOI] [PMC free article] [PubMed] [Google Scholar]
- 52.Levin M. K., Gurjar M. M., Patel S. S. ( 2003) J. Biol. Chem. 278, 23311– 23316 [DOI] [PubMed] [Google Scholar]
- 53.Young M. C., Kuhl S. B., von Hippel P. H. ( 1994) J. Mol. Biol. 235, 1436– 1446 [DOI] [PubMed] [Google Scholar]
- 54.Young M. C., Schultz D. E., Ring D., von Hippel P. H. ( 1994) J. Mol. Biol. 235, 1447– 1458 [DOI] [PubMed] [Google Scholar]
- 55.Preugschat F., Averett D. R., Clarke B. E., Porter D. J. ( 1996) J. Biol. Chem. 271, 24449– 24457 [DOI] [PubMed] [Google Scholar]
- 56.Porter D. J. ( 1998) J. Biol. Chem. 273, 14247– 14253 [DOI] [PubMed] [Google Scholar]
- 57.Faeder J. R., Blinov M. L., Hlavacek W. S. ( 2009) Methods Mol. Biol. 500, 113– 167 [DOI] [PubMed] [Google Scholar]
- 58.Locatelli G. A., Spadari S., Maga G. ( 2002) Biochemistry 41, 10332– 10342 [DOI] [PubMed] [Google Scholar]
- 59.Dillingham M. S., Wigley D. B., Webb M. R. ( 2000) Biochemistry 39, 205– 212 [DOI] [PubMed] [Google Scholar]
- 60.Matlock D. L., Yeruva L., Byrd A. K., Mackintosh S. G., Langston C., Brown C., Cameron C. E., Fischer C. J., Raney K. D.Biochemistry 49, 2097– 2109 [DOI] [PMC free article] [PubMed] [Google Scholar]
- 61.Morris P. D., Raney K. D. ( 1999) Biochemistry 38, 5164– 5171 [DOI] [PubMed] [Google Scholar]
- 62.Morris P. D., Byrd A. K., Tackett A. J., Cameron C. E., Tanega P., Ott R., Fanning E., Raney K. D. ( 2002) Biochemistry 41, 2372– 2378 [DOI] [PubMed] [Google Scholar]
- 63.Cheng W., Dumont S., Tinoco I., Jr., Bustamante C. ( 2007) Proc. Natl. Acad. Sci. U.S.A. 104, 13954– 13959 [DOI] [PMC free article] [PubMed] [Google Scholar]
- 64.Donmez I., Rajagopal V., Jeong Y. J., Patel S. S. ( 2007) J. Biol. Chem. 282, 21116– 21123 [DOI] [PubMed] [Google Scholar]
- 65.Garai A., Chowdhury D., Betterton M. D. ( 2008) Phys. Rev. E. Stat Nonlin Soft Matter Phys. 77, 061910 [DOI] [PubMed] [Google Scholar]
- 66.Lam A. M., Frick D. N. ( 2006) J. Virol. 80, 404– 411 [DOI] [PMC free article] [PubMed] [Google Scholar]
- 67.Murayama A., Date T., Morikawa K., Akazawa D., Miyamoto M., Kaga M., Ishii K., Suzuki T., Kato T., Mizokami M., Wakita T. ( 2007) J. Virol. 81, 8030– 8040 [DOI] [PMC free article] [PubMed] [Google Scholar]
- 68.Kolykhalov A. A., Mihalik K., Feinstone S. M., Rice C. M. ( 2000) J. Virol. 74, 2046– 2051 [DOI] [PMC free article] [PubMed] [Google Scholar]
- 69.Tomei L., Failla C., Santolini E., De Francesco R., La Monica N. ( 1993) J. Virol. 67, 4017– 4026 [DOI] [PMC free article] [PubMed] [Google Scholar]
- 70.Evans J. D., Seeger C. ( 2006) Hepatology 43, 615– 617 [DOI] [PubMed] [Google Scholar]
- 71.Sillanpaa M., Kaukinen P., Melen K., Julkunen I. ( 2008) J. Gen. Virol. 89, 432– 443 [DOI] [PubMed] [Google Scholar]
- 72.Johnson C. L., Owen D. M., Gale M., Jr. ( 2007) J. Biol. Chem. 282, 10792– 10803 [DOI] [PubMed] [Google Scholar]
- 73.Khu Y. L., Tan Y. J., Lim S. G., Hong W., Goh P. Y. ( 2004) Biochem. J. 384, 401– 409 [DOI] [PMC free article] [PubMed] [Google Scholar]
Associated Data
This section collects any data citations, data availability statements, or supplementary materials included in this article.