Abstract
Protein domains usually fold without or with only transiently populated intermediates, possibly to avoid misfolding, which could result in amyloidogenic disease. Whether observed intermediates are productive and obligatory species on the folding reaction pathway or dispensable by-products is a matter of debate. Here, we solved the crystal structure of a small protein domain, SAP97 PDZ2 I342W C378A, and determined its folding pathway. The presence of a folding intermediate was demonstrated both by single and double-mixing kinetic experiments using urea-induced (un)folding as well as ligand-induced folding. This protein domain was found to fold via a triangular scheme, where the folding intermediate could be either on- or off-pathway, depending on the experimental conditions. Furthermore, we found that the intermediate was present at equilibrium, which is rarely seen in folding reactions of small protein domains. The folding mechanism observed here illustrates the roughness and plasticity of the protein folding energy landscape, where several routes may be employed to reach the native state. The results also reconcile the folding mechanisms of topological variants within the PDZ domain family.
Keywords: Pre-steady-state Kinetics, Protein Chemistry, Protein Domains, Protein Folding, Protein Structure, Folding Pathways, PDZ Domain
Introduction
The role and even the presence of intermediates in the folding reactions of protein domains are under constant debate (1, 2). Domains that fold without populated intermediates appear to have been selected for during evolution, possibly to avoid misfolding (3). Yet the polymeric nature of proteins implies their folding energy landscape to be rough (4), and clearly, intermediates do occur, sometimes as high energy species, which can only be indirectly monitored (5–7) but sometimes as low energy species, which can be observed directly (8–14). One problem with studying these intermediates is that they are only transiently populated and thus difficult to isolate and characterize. A successful strategy to isolate folding intermediates has been to destabilize the native state by mutation, which works if the intermediate state is less destabilized by the modification (9, 11, 15, 16). Further, general mechanisms of folding may be deduced if several members of a protein family are compared, for example regarding the influence of sequence and topology on the folding reaction (17–20). We have used this strategy on the PDZ domain family of proteins (21–24) and demonstrated that the folding reaction of all members investigated so far involves an intermediate, which at least in one case is on-pathway (6), often high energy, but off-pathway and low energy compared with the denatured state for a circularly permutated bacterial PDZ domain (25). Here we describe the folding reaction of SAP97 PDZ2 I342W C378A, referred to as pseudo-wild type PDZ2 (pwPDZ2). A triangular scheme explains the folding of this pwPDZ2. The intermediate in the scheme is of low energy and either on- or off-pathway depending on experimental conditions. The folding reaction of pwPDZ2 thus reflects the plasticity of the energy landscape for protein folding. We also discuss how these data reconcile the folding mechanism within the PDZ domain family, with general implications for the folding of protein domains.
EXPERIMENTAL PROCEDURES
Expression and Purification
The cDNA used for expression of the SAP97 PDZ2 domain coded for residues 311–407 in human SAP97. The construct was cloned into EcoRI/BamHI sites of a modified pRSET vector (Invitrogen). Mutations I342W and C378A were introduced in the original construct as described previously (26). The expressed protein contained an N-terminal His tag (MHHHHHLVPRGS) in addition to the I342W/C378A mutations. We have shown previously for other PDZ domains that the His tag does not affect the binding and stability of the PDZ domains (22, 26, 27). Mutation I342W served as a probe for equilibrium and kinetic experiments, and Cys378 was removed to avoid formation of interdomain S-S bridges.
The SAP97 PDZ2 pseudo-wild type construct expressing an N-terminal His tag and mutations I342W and C378A, hereafter referred to as pwPDZ2, was used to transform Escherichia coli BL 21 DE3, pLysS cells. Transformed E. coli cells were selected by growing cells overnight on agar plates containing ampicillin (100 μg/ml) and chloramphenicol (35 μg/ml). Colonies from the agar plate were taken to initiate a 10-ml preculture and then a 1-liter culture (50 μg/ml ampicillin), each grown at 37 °C. Protein expression was induced by adding 1 mm isopropyl-β-thiogalactopyranoside when the A600 was ∼0.4. After induction, the culture was grown overnight at 30 °C. The cells were collected by centrifugation (7,000 × g for 10 min) and resuspended in buffer (50 mm Tris/HCl, pH 8.5, 400 mm NaCl). The cells were disrupted by ultrasonication, followed by centrifugation (35,000 × g) for 1 h. The supernatant thus obtained was filtered successively through 0.45- and 0.2-μm filters (Sarstedt). Filtered supernatant was loaded onto a nickel (II)-charged chelating Sepharose FF column (GE Healthcare); equilibrated with 50 mm Tris/HCl, pH 8.5, 400 mm NaCl; and washed with 300 ml of the same buffer. The bound protein was eluted with 250 mm imidazole, pH 7.9. The fractions containing the PDZ were pooled, concentrated, and loaded onto a Q column (GE Healthcare), equilibrated with 50 mm potassium phosphate, pH 7.0. The protein did not bind to the column and appeared in the unbound fraction. This unbound fraction was concentrated and applied onto a C18 reverse phase FPLC column, equilibrated with buffer A (0.1% trifluoroacetic acid). The bound protein was eluted at 60% buffer B (100% acetonitrile, 0.01% trifluoroacetic acid). The fractions containing the pwPDZ2 were lyophilized and redissolved in deionized water. The purity of pwPDZ2 was checked by SDS-PAGE stained with Coomassie Brilliant Blue. The mass of the purified PDZ domain was confirmed by matrix-assisted laser desorption ionization time-of-flight mass spectrometry. Alternatively, as a last purification step before crystallization, the Q column flow-through was loaded onto an S column (GE Healthcare) pre-equilibrated with 50 mm Tris/HCl, pH 8.5. Elution was performed in a gradient from 0 to 500 mm NaCl in 50 mm Tris/HCl, pH 8.5. Fractions containing pwPDZ2 were identified by SDS-PAGE. For crystallization, thrombin digestion was carried out to remove the His tag of pwPDZ2. To remove any remaining His-tagged protein, the digested sample was passed through nickel (II)-Sepharose beads in 50 mm Tris/HCl, pH 8.4, 500 mm NaCl. The nonbound fraction contained the cleaved protein, which was further purified over a benzamidine column (GE Healthcare) to remove thrombin. For crystallization purposes the protein was then concentrated in 20 mm Tris/HCl, pH 8.8, 50 mm NaCl in a Vivaspin (Vivascience, Sartorius group) concentrator (molecular mass cut-off, 5,000 Da).
Crystallization and Structure Determination
3 μl of protein solution (4.5 mg/ml pwPDZ2 without His tag in 20 mm Tris/HCl, pH 8.8, 50 mm NaCl), and 1 μl of reservoir solution (100 mm Tris/HCl, pH 8.4, 2.4 m ammonium sulfate) were mixed in a sitting drop vapor diffusion setup. The crystals were observed after 4 days and grew to a size of 100–300 μm within 2 weeks. The crystals were transferred to 105 mm Tris/HCl, pH 8.4, 2.52 m ammonium sulfate, 10% (v/v) glycerol and flash frozen in liquid N2. The data were collected at Beamline I-911-2 at Max-Lab (Lund, Sweden).
The data for the pwPDZ2 crystals were collected to a resolution of 1.8 Å, but only data up to 2 Å resolution contained enough information for model building. The data were processed using the program XDS (28). Phases were obtained by molecular replacement with the program phaser (29) and the SAP97 PDZ2 C378G protein structure (Protein Data Bank entry 2AWU (30)) as a search model. The model was improved by cycles of manual model building in coot (31) and automated refinement in Refmac version 5.5.0066 (32, 33). The geometry of the final model was analyzed using Molprobity (34), and the figures were drawn using Pymol (35).
Folding Experiments
Urea-induced equilibrium denaturation experiments were followed on an SLM 4800 spectrofluorimeter (SLM Aminco, Urbana, IL). Excitation of the engineered Trp residue (I342W) was done at 280 nm, and emission was monitored at 350 nm. The experiments were carried out in 50 mm potassium phosphate, pH 7.5, at 25 and 37 °C. A decrease in Trp emission was observed upon denaturation, and the transition followed a two-state behavior. The data were fitted to the standard equation for solvent denaturation (36).
Kinetic folding and unfolding rate constants were measured on an SX-20 MV stopped flow spectrometer (upgraded SX-17) (Applied Photophysics, Leatherhead, UK). For refolding experiments, 33 μm protein was dissolved in buffer (50 mm potassium phosphate, pH 7.5) having 6 m urea. Refolding was initiated by 11-fold dilution of protein in buffer-urea solutions. Unfolding experiments were done similarly except that protein was dissolved in buffer without urea and mixed rapidly with buffer-urea solutions. Thus, the final concentration of pwPDZ2 was kept at 3 μm, and the temperature was maintained at either 25 or 37 °C for all of the kinetic measurements. The excitation was done at 280 nm, and the change in fluorescence was monitored at ∼330 nm using an interference filter. To obtain rate constants for the slowest phases, folding kinetics were recorded in the SLM 4800 spectrometer following manual mixing of protein-urea and buffer-urea solutions. Here, emission at 350 nm was monitored. Biphasic kinetics were observed for both unfolding and refolding reactions, and the two observed rate constants were fitted to equations derived from a sequential scenario (on-pathway or off-pathway) (Equation 1) or triangular scheme (Equation 2).
 |
 |
The logarithm of each of the microscopic rate constants in Equation 1 and 2 was assumed to depend linearly on the urea concentration.
See Ref. 37 for more details on folding kinetics.
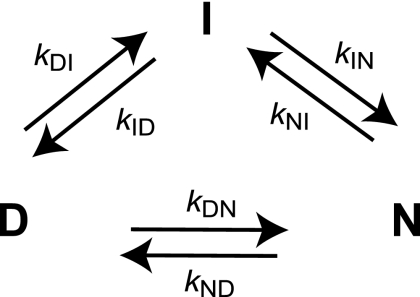
Stopped flow ligand-induced refolding experiments were performed in 50 mm potassium phosphate, pH 7.5, at 37 °C with different concentrations of peptide (LQRRRETQV) at a constant concentration of pwPDZ2 (3 μm). The binding-induced folding was followed by monitoring the change in fluorescence using the 330-nm interference filter. (excitation λ = 280 nm). The traces thus obtained were fitted to a single exponential equation, and the observed rate constants were plotted against the peptide concentration. Equation 5 (6) was fitted to the data to estimate the microscopic rate constant for the I → N transition (see scheme in Fig. 6).
KD in Equation 5 is the dissociation constant between the native conformation and the peptide ligand.
FIGURE 6.
Triangular scheme describing the folding reaction of pwPDZ2. The intermediate in the folding reaction of pwPDZ2 can be either on- or off-pathway, depending on the experimental conditions. A triangular scheme reconciles all of the experimental data on SAP97 PDZ2 as well as those of other members of the PDZ domain family.
RESULTS
Structure of pwPDZ2
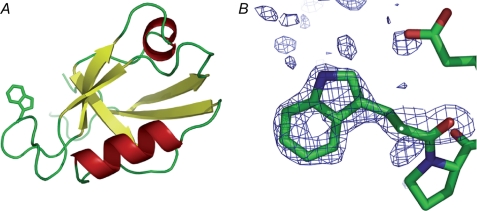
To have a fluorescent probe to measure folding, we changed Ile342 to Trp. To rule out any major perturbations of our Trp label on the structure, we solved the crystal structure of this pwPDZ2 (Protein Data Bank entry 2x7z). The pwPDZ2 crystallized in a new space group, P4322, compared with previous SAP97 PDZ2 structures, probably because of a new contact between residues Trp342 and Pro405. Diffraction data to 2.0 Å resolution was collected enabling the structure to be solved by molecular replacement and refined to a resolution of 2.0 Å. The data collection and refinement statistics are shown in Table 1. The pwPDZ2 protein has the expected PDZ domain fold (Fig. 1A). Positive difference electron density for Trp342 was clear after the first refinement cycle in Refmac (Fig. 1B). Comparison with other available structures of SAP97 PDZ2 showed that there were no major conformational changes induced by the I342W mutation. Most of the small differences observed can be explained by crystal packing effects or increased flexibility of a specific region. These regions concern among others the carboxylate-binding loop where the electron density is poor. The high similarity of the crystal structure of pwPDZ2 to the structure of the same protein without the I342W mutation (30, 38) and their similar stabilities (26) validate its use as a pseudo-wild type protein for folding studies.
TABLE 1.
Data collection and refinement statistics
| Data collection statistics | |
| Space group | P4322 |
| Unit cell dimensions (Å) | a = b = 47.91, c = 123.29 |
| Resolution (Å) | 29.9-2.0 (2.05-2.00) |
| Rsym (%) | 7.5 (22.2) |
| I/σ(I) | 31.5 (15.4) |
| Completeness (%) | 96.6 (96.8) |
| Redundancy | 20.4 (20.8) |
| Refinement statistics | |
| No. of unique reflections (test set) | 9802 (516) |
| Rwork/Rfree (%) | 19.4/23.2 |
| Molecules/asymmetric unit | 1 |
| No. of atoms | |
| Protein | 738 |
| Other | 88 |
| Average B factor | |
| Protein | 16.8 |
| Other | 23.9 |
| Root mean square deviation from ideality | |
| Bond lengths (Å) | 0.022 |
| Bond angles (°) | 1.69 |
FIGURE 1.
Crystal structure of the SAP97 PDZ2 I342W C378A double mutant (pwPDZ2; Protein Data Bank entry 2x7z). A, ribbon representation of the crystal structure of pwPDZ2. The side chain of Trp342 is shown as all-atom model. B, annealed Fo − Fc omit map of Trp342 shown at the level of 3.5 σ.
Because the pwPDZ2 was crystallized without peptide, the structure was expected to be similar to other peptide-free structures and slightly different from peptide-bound structures because a conformational change was observed upon peptide binding (30, 38). These conformational differences were indeed observed when comparing the mutant protein structure to the SAP97 PDZ2 protein in complex with the HPV18 E6 C-terminal peptide (Protein Data Bank entry 2I0L) (39). Interestingly, the pwPDZ2 structure was similar to the structures of SAP97 PDZ2 with GluR-A C-terminal peptide bound (Protein Data Bank entries 2AWW and 2G2L), whereas it was different from the two apo structures (Protein Data Bank entry 2AWU and 2AWX) (30). Unfortunately, with resolution ranging from 1.8 to 2.44Å, Rwork from 18 to 24.2%, and Rfree values between 25.4 and 32.6%, it appears difficult to make any definite statements about small conformational differences between the different structures of SAP97 PDZ2 (40).
The salt bridge between residues Lys324 and Asp396 that was described for the unliganded SAP97 PDZ2 domain (30) was not observed in the pwPDZ2 structure. Instead, Lys324 forms H-bonding interactions with the Thr394 side chain and the carbonyl oxygen of Thr394. These interactions were described for the liganded form of SAP97 PDZ2 by von Ossowski et al. (30).
Folding Kinetics of pwPDZ2
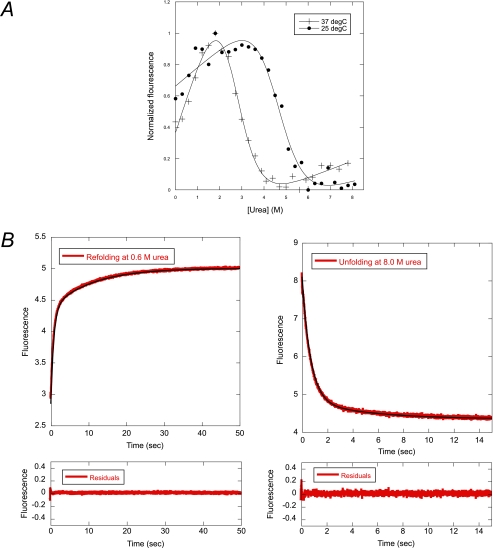
Urea-induced unfolding of pwPDZ2 was followed by the fluorescence of the engineered tryptophan residue, I342W. The experiments were conducted in such a way that the concentration of protein was kept constant (3 μm) at varying urea concentrations. At equilibrium, we have shown that the wild type and pwPDZ2 were stable and folded under the experimental conditions (26). Here we repeated these equilibrium denaturation experiments to obtain data at both 25 and 37 °C (Fig. 2A and Table 2).
FIGURE 2.
Urea denaturation of pwPDZ2. A, equilibrium denaturation of the pwPDZ2 domain. B, time resolved urea induced unfolding and refolding traces. The traces were fitted to a double exponential function.
TABLE 2.
Equilibrium parameters obtained in the different experiments
Note that some of the experimental errors are very large (e.g. for the fits from chevron plots, Fig. 3, and for kNI from the ligand induced folding experiment, used to calculate the Δ GI-N). The parameters presented here, which are calculated from kinetic parameters, should therefore only be used for a qualitative interpretation. Fitting errors are shown for the equilibrium data.
| Experiment | ΔGD-N | mD-N | ΔGI-N | ΔGD-I | mD-I |
|---|---|---|---|---|---|
| kcal mol−1 | kcal mol−1m−1 | kcal mol−1 | kcal mol−1 | kcal mol−1m−1 | |
| Equilibrium 25 °C (Fig. 2) | 5.0 ± 1.1 | 1.09 ± 0.24 | |||
| Equilibrium 37 °C (Fig. 2) | 3.3 ± 0.3 | 1.26 ± 0.12 | |||
| Chevron 25 °C off-pathway (Fig. 3) | 4.1 | 1.25 | 0.6 | 0.7 | |
| Chevron 37 °C triangular (Fig. 3) | 4.2 | 1.75 | 1.3 | 1.1 | |
| Ligand-induced folding 37 °C (Fig. 5) | 1.8 |
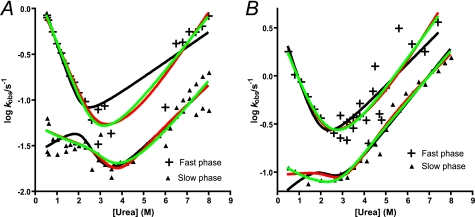
The unfolding and refolding kinetic experiments were conducted in 50 mm potassium phosphate at 25 and 37 °C. Both the refolding and unfolding time courses were biphasic at all concentrations of urea (Fig. 2B). Chevron plots, which are semi-logarithmic plots of observed rate constants (refolding/unfolding) as a function of denaturant (urea) concentration are shown in Fig. 3. When double exponential (un)folding is observed there are, in the simplest case, three reaction schemes that may be consistent with the data (8). These three scenarios are (i) a two-step folding with an on-pathway intermediate, (ii) a two-step folding with an off-pathway intermediate (both scenarios are fitted with Equation 1), and (iii) a triangular scheme where the intermediate is on-pathway but where direct formation of the native state from the denatured state is also possible (Equation 2). It is clear from Fig. 3 that the urea dependence of the slow phase is different at the two temperatures, and in theory the three different scenarios could be distinguished based on the urea dependence of the two rate constants (8, 9, 37, 41). Whereas the kinetics are best described by a scheme with an off-pathway intermediate at 25 °C, a parallel scheme or an on-pathway scenario fit data best at 37 °C (Fig. 3 and Table 3). In other words, these data suggest that the intermediate switches between being on- and off-pathway depending on the experimental temperature. The fitted rate constants in Table 3 are in good agreement with stability measurements at equilibrium (Table 2), but single-jump kinetics alone is not sufficient to conclusively settle on this mechanism.
FIGURE 3.
Urea dependence of the two observed (un)folding rate constants of pwPDZ2. Time-resolved folding and unfolding were recorded by fluorescence at 25 (A) and 37 °C (B). At 37 °C the observed rate constants were best described by an on-pathway or triangular scheme, whereas an off-pathway scheme fitted well at 25 °C. Black line, off-pathway; red line, on-pathway; green line, triangular scheme. See “Experimental Procedures” and “Results” for more details.
TABLE 3.
Best fit folding parameters
Parameters and fitting errors for an off-pathway scheme at 25 °C and a triangular scheme at 37 °C, from simultaneous fits of the fast and slow phases to Equations 2 and 3, respectively (Fig. 3). The large errors in the fitting result from the large number of parameters and a limited data set. The double jump experiment (Fig. 4) was used to verify the kinetic schemes.
| kDI | kID | kDN | kND | kIN | kNI | mDI | mID | mDN | mND | mIN | mNI | |
|---|---|---|---|---|---|---|---|---|---|---|---|---|
| s−1 | s−1 | s−1 | s−1 | s−1 | s−1 | kcal mol−1m−1 | kcal mol−1m−1 | kcal mol−1m−1 | kcal mol−1m−1 | kcal mol−1m−1 | kcal mol−1m−1 | |
| Off-pathway 25 °C | 0.07 ± 1.6 | 0.026 ± 0.028 | 2.1 ± 2.2 | 0.002 ± 0.001 | 0.5 ± 5 | 0.22 ± 0.09 | 1.0 ± 0.13 | 0.31 ± 0.05 | ||||
| Triangular 37 °C | 2.5 ± 4.1 | 0.020a | 0.9 ± 6.5 | 0.0009 ± 0.007 | 0.11 ± 0.06 | 0.014 ± 0.013 | 0.72 ± 0.49 | 0.44b | 1.4 ± 2.5 | 0.39 ± 2.5 | 0.30 ± 0.33 | 0.37 ± 0.21 |
a Calculated from the five fitted rate constants.
b Calculated from the five fitted m values.
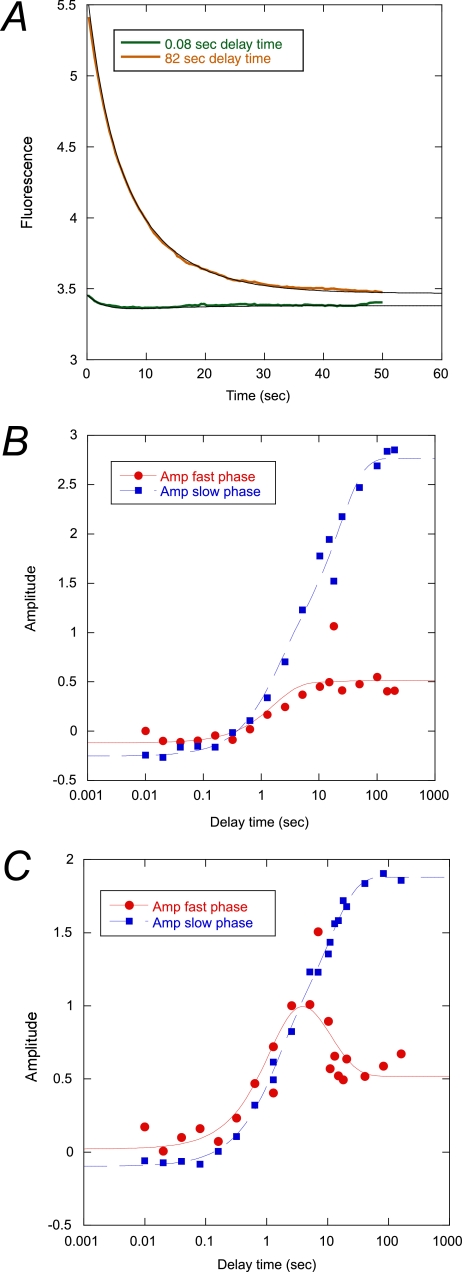
To investigate the formation of the intermediate in more detail, we performed double mixing experiments in the stopped flow spectrometer. Acid-urea denatured pwPDZ2 was first mixed with buffer-urea to induce refolding at 1 m urea. Then after different delay times, the refolding reaction was interrupted by mixing with urea to a final concentration of 5.5 m, and the resulting biphasic unfolding trace was monitored by fluorescence (Fig. 4A). The amplitude of the respective phase was plotted against delay time (Fig. 4, B and C). The amplitude of the fast phase (red) reflects formation of the intermediate, and the amplitude of the slow phase (blue) reflects formation of the native state during the delay time (42, 43). An on-pathway scenario would predict the native state to form in a single exponential reaction, with an initial lag phase (9). However, because the native state forms in a biphasic manner, it shows that the intermediate is off-pathway (or present in a triangular scheme) both at 25 and 37 °C. An extensive discussion about the differences between the two mechanisms may be found in Refs. 37 and 43. Together with single-jump data, we can thus conclude that the native state is formed mainly through a direct D → N transition at 25 °C (with I being off-pathway) but that the I → N route is opened up at 37 °C.
FIGURE 4.
Interrupted refolding experiments. A, example of experimental traces at short and long delay times at 37 °C. Amplitudes of the traces were plotted against delay time at 25 (B) and 37 °C (C). Briefly, acid denatured protein in 10 mm sodium formate was mixed with a buffer-urea solution to a final concentration of 1 m urea in 50 mm potassium phosphate, pH 7.5. After a certain delay time (plotted on the x axis), the refolding reaction was subjected to a second buffer jump to a final concentration of 4.5 m urea in 50 mm potassium phosphate, pH 7.5. The resulting unfolding traces were fitted to a double exponential function with shared rate constants at the respective temperature (0.33 and 0.12 s−1 at 37 °C and 0.063 and 0.016 s−1 at 25 °C). The two amplitudes thus obtained were plotted against the delay time. These data were in turn fitted to a double exponential function (solid lines). See Table 4 for best fit parameters.
Furthermore, because the intermediate phase is not disappearing at long delay times, it is clear that the intermediate is populated at equilibrium. The rate constants obtained from fitting a double exponential function to the amplitude versus delay time plots agree well with those from the chevron plots (Fig. 3 and Table 4). From the microscopic rate constants, it can be calculated that roughly 10% of the PDZ2 molecules are in the intermediate form at 37 °C.
TABLE 4.
Best fit parameters from interrupted refolding experiments (Fig. 4)
Also shown is a comparison with observed rate constants from the single jump experiments in Fig. 3.
| Experiment/phase | Double jump experiment |
Single jump at 1 m urea |
||||
|---|---|---|---|---|---|---|
| kobs1 | Amplitude 1 | kobs2 | Amplitude 2 | kobs1 | kobs2 | |
| s−1 | s−1 | s−1 | s−1 | |||
| 37 °C slow phase | 0.77 ± 0.16 | 0.84 ± 0.12 | 0.090 ± 0.013 | 1.14 ± 0.12 | 0.91 | 0.095 |
| 37 °C fast phase | 0.77a | 1.26 ± 0.19 | 0.090a | 0.77 ± 0.21 | ||
| 25 °C slow phase | 0.60 ± 0.30 | 1.1 ± 0.3 | 0.045 ± 0.013 | 1.9 ± 0.3 | 0.43 | 0.049 |
| 25 °C fast phase | 0.60a | 0.61 ± 0.15 | 0.045a | 0.03 ± 0.17 | ||
a The amplitude of the fast phase from the double jump experiment yields large fitting errors upon free fitting. Therefore the rate constants obtained from free fitting of the slow phases were used to constrain the fitting of the amplitudes from the fast phase.
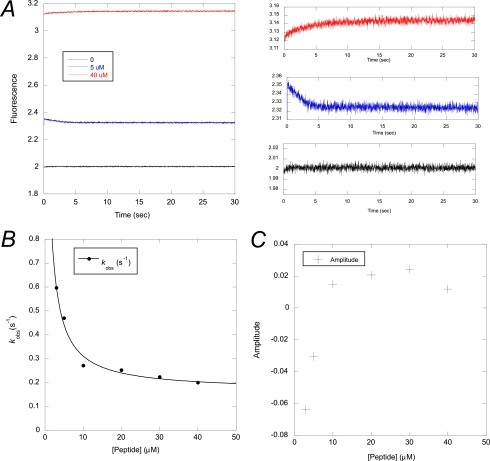
Finally, the presence of the intermediate at equilibrium was corroborated by a ligand-induced folding experiment. pwPDZ2 was mixed with a peptide ligand, and the change in fluorescence was monitored with time. Careful analysis of the binding trace revealed that except for the previously characterized fast binding phases (26), there was a very slow phase present, which was plotted against ligand concentration (Fig. 5). Both the rate constant and the amplitude of this slow phase displayed a dependence on ligand concentration, which is consistent with a ligand-induced folding reaction (i.e. a slow folding event followed by a faster bimolecular binding reaction, which leads to a decrease of kobs with increasing peptide ligand concentration). The reason that the amplitude changes sign is that the fluorescence yield of the intermediate is slightly different from that of the native state as well as that of the peptide-bound native state. Qualitatively, at low peptide concentration the amplitude of the coupled folding and binding phase is negative because the decrease in fluorescence upon conversion of the intermediate to native dominates over the increase in fluorescence from binding of peptide to the native state. At higher peptide concentration, the equilibrium is shifted such that all intermediate is reacting to the peptide-bound native state with a resulting increase in fluorescence upon binding. The rate constant estimated for the I → N transition in the ligand binding-induced folding experiment, 0.16 ± 0.03 s−1 (Fig. 5B), is in good agreement with that obtained from fitting of the triangular scheme to observed rate constants for (un)folding, 0.11 ± 0.06 s−1 (Fig. 3B and Table 3). The errors in relative populations and fitted rate constants are too large to accurately determine fluorescence yields of the intermediate relative to the native state. We can say, however, that they are fairly similar, which is consistent with data if the fluorescence yield of the intermediate is at least 10% higher than that of the native state. Note that although the kinetic amplitudes were small in this experiment (Fig. 5, A and C), the accuracy is very high because (i) kobs approaches a first order rate constant (0.16 s−1) at high peptide ligand concentration and (ii) the signal-to-noise is high for the kinetic traces (Fig. 5A).
FIGURE 5.
Ligand-binding induced folding experiment. A, experimental traces at 0, 5, and 40 μm peptide (LQRRRETQV). The initial “burst phase” is the previously characterized binding of peptide to the native state (26). B, observed rate constants for the ligand-induced folding phase decreased as a function of peptide concentration consistent with a slow folding step followed by a rapid bimolecular association (6, 36). C, the amplitudes for the ligand-induced folding phase switch from negative to positive, which is consistent with the proposed mechanism if the fluorescence of the intermediate is at least 10% higher than that of the native state.
DISCUSSION
The polymeric nature of proteins implies that their folding energy landscapes should be rough. A corollary of such roughness is that folding may involve alternative routes when going from the denatured to the native state. Thus, intermediates are not necessarily obligatory species but rather kinetic traps arising from the ruggedness of the folding landscape. Implicit in this view is the notion of plasticity of the folding trajectory: proteins can be rerouted through the energy landscape by mutational, topological, solvent, or other perturbations. Indeed, in the present work we report parallel folding pathways in pwPDZ2 and observe that the flux through the respective path (Fig. 6) can be modulated by temperature. The intermediate may be mainly off-pathway as observed at 25 °C or follow a triangular scheme where the intermediate is now on-pathway through the opening of a route from I to N (at 37 °C).
It is of interest to compare the folding pathway of pwPDZ2 with other previously characterized PDZ domains. We have studied the folding pathways of a number of PDZ domains (6, 21–25, 44). In fact, none of the PDZs characterized thus far fold in a pure two-state manner. The canonical (mammalian) proteins typically fold via a high energy intermediate (22) and through a structurally conserved second transition state (21). On the other hand, in the folding reaction of a circularly permutated bacterial PDZ domain, a low energy off-pathway intermediate is present (25). In light of these previous data, the folding of the SAP97 PDZ2 domain may be viewed as a missing link between these two extreme folding pathways and reconciles apparently contrasting results. Because energy landscapes are funneled, folding may occur via alternative folding nuclei (45, 46). When and if the forces stabilizing such nuclei are balanced, as in the case of pwPDZ2, small perturbations of reaction conditions may result in rerouting through an alternative folding pathway.
Both the single-jump unfolding kinetics (Figs. 2 and 3) and the double-jump experiment (Fig. 4) suggest that the intermediate is present at equilibrium and making up roughly 10% of the total protein. The presence of such a high energy species suggests that SAP97 PDZ2 displays conformational sampling (47). However, the interconversion between the states is slow, and as shown by the ligand binding experiment in Fig. 5, the peptide ligand binds only to the more stable ground state and is not a ligand for the intermediate state. It therefore remains to be shown whether the intermediate plays any functional role by binding to a yet unidentified ligand or whether it is only there as a benign species, which is neither deleterious nor beneficial for the physiological function of SAP97.
Footnotes
This work was supported by grants from the Swedish Research Council (to P. J. and M. S.), O. E. and Edla Johansson's Foundation, Carl Trygger's Foundation, Jeansson's Foundation, Clas Groschinskys Minnesfond (to P. J.), and the Swedish Foundation for Strategic Research (to M. S.).
The atomic coordinates and structure factors (code 2x7z) have been deposited in the Protein Data Bank, Research Collaboratory for Structural Bioinformatics, Rutgers University, New Brunswick, NJ (http://www.rcsb.org/).
REFERENCES
- 1.Brockwell D. J., Radford S. E. (2007) Curr. Opin. Struct. Biol. 17, 30–37 [DOI] [PMC free article] [PubMed] [Google Scholar]
- 2.Krantz B. A., Mayne L., Rumbley J., Englander S. W., Sosnick T. R. (2002) J. Mol. Biol. 324, 359–371 [DOI] [PubMed] [Google Scholar]
- 3.Fersht A. R. (1995) Proc. Natl. Acad. Sci. U.S.A. 21, 10869–10873 [DOI] [PMC free article] [PubMed] [Google Scholar]
- 4.Bryngelson J. D., Onuchic J. N., Socci N. D., Wolynes P. G. (1995) Proteins 21, 167–195 [DOI] [PubMed] [Google Scholar]
- 5.Fersht A. R. (2000) Proc. Natl. Acad. Sci. U.S.A. 97, 14121–14126 [DOI] [PMC free article] [PubMed] [Google Scholar]
- 6.Ivarsson Y., Travaglini-Allocatelli C., Jemth P., Malatesta F., Brunori M., Gianni S. (2007) J. Biol. Chem. 282, 8568–8572 [DOI] [PubMed] [Google Scholar]
- 7.Sánchez I. E., Kiefhaber T. (2003) J. Mol. Biol. 325, 367–376 [DOI] [PubMed] [Google Scholar]
- 8.Capaldi A. P., Shastry M. C., Kleanthous C., Roder H., Radford S. E. (2001) Nat. Struct. Biol. 8, 68–72 [DOI] [PubMed] [Google Scholar]
- 9.Jemth P., Gianni S., Day R., Li B., Johnson C. M., Daggett V., Fersht A. R. (2004) Proc. Natl. Acad. Sci. U.S.A. 101, 6450–6455 [DOI] [PMC free article] [PubMed] [Google Scholar]
- 10.Khorasanizadeh S., Peters I. D., Roder H. (1996) Nat. Struct. Biol. 3, 193–205 [DOI] [PubMed] [Google Scholar]
- 11.Mayor U., Guydosh N. R., Johnson C. M., Grossmann J. G., Sato S., Jas G. S., Freund S. M., Alonso D. O., Daggett V., Fersht. A. R. (2003) Nature 421, 863–867 [DOI] [PubMed] [Google Scholar]
- 12.Parker M. J., Spencer J., Clarke A. R. (1995) J. Mol. Biol. 253, 771–786 [DOI] [PubMed] [Google Scholar]
- 13.Sauder J. M., MacKenzie N. E., Roder H. (1996) Biochemistry 35, 16852–16862 [DOI] [PubMed] [Google Scholar]
- 14.Wildegger G., Kiefhaber T. (1997) J. Mol. Biol. 270, 294–304 [DOI] [PubMed] [Google Scholar]
- 15.Religa T. L., Markson J. S., Mayor U., Freund S. M., Fersht A. R. (2005) Nature 437, 1053–1056 [DOI] [PubMed] [Google Scholar]
- 16.Spence G. R., Capaldi A. P., Radford S. E. (2004) J. Mol. Biol. 341, 215–226 [DOI] [PubMed] [Google Scholar]
- 17.Clarke J., Cota E., Fowler S. B., Hamill S. J. (1999) Structure 7, 1145–1153 [DOI] [PubMed] [Google Scholar]
- 18.Ferguson N., Capaldi A. P., James R., Kleanthous C., Radford S. E. (1999) J. Mol. Biol. 286, 1597–1608 [DOI] [PubMed] [Google Scholar]
- 19.Gianni S., Guydosh N. R., Khan F., Caldas T. D., Mayor U., White G. W., DeMarco M. L., Daggett V., Fersht A. R. (2003) Proc. Natl. Acad. Sci. U.S.A. 100, 13286–13291 [DOI] [PMC free article] [PubMed] [Google Scholar]
- 20.Travaglini-Allocatelli C., Gianni S., Brunori M. (2004) Trends Biochem. Sci. 29, 535–541 [DOI] [PubMed] [Google Scholar]
- 21.Calosci N., Chi C. N., Richter B., Camilloni C., Engström A., Eklund L., Travaglini-Allocatelli C., Gianni S., Vendruscolo M., Jemth P. (2008) Proc. Natl. Acad. Sci. U.S.A. 105, 19241–19246 [DOI] [PMC free article] [PubMed] [Google Scholar]
- 22.Chi C. N., Gianni S., Calosci N., Travaglini-Allocatelli C., Engström A., Jemth P. (2007) FEBS Lett. 581, 1109–1113 [DOI] [PubMed] [Google Scholar]
- 23.Gianni S., Calosci N., Aelen J. M., Vuister G. W., Brunori M., Travaglini-Allocatelli C. (2005) Protein Eng. Des. Sel. 18, 389–395 [DOI] [PubMed] [Google Scholar]
- 24.Gianni S., Geierhaas C. D., Calosci N., Jemth P., Vuister G. W., Travaglini-Allocatelli C., Vendruscolo M., Brunori M. (2007) Proc. Natl. Acad. Sci. U.S.A. 104, 128–133 [DOI] [PMC free article] [PubMed] [Google Scholar]
- 25.Ivarsson Y., Travaglini-Allocatelli C., Morea V., Brunori M., Gianni S. (2008) Protein Eng. Des. Sel. 21, 155–160 [DOI] [PubMed] [Google Scholar]
- 26.Chi C. N., Bach A., Engström A., Wang H., Strømgaard K., Gianni S., Jemth P. (2009) Biochemistry 48, 7089–7097 [DOI] [PubMed] [Google Scholar]
- 27.Gianni S., Engström A., Larsson M., Calosci N., Malatesta F., Eklund L., Ngang C. C., Travaglini-Allocatelli C., Jemth P. (2005) J. Biol. Chem. 280, 34805–34812 [DOI] [PubMed] [Google Scholar]
- 28.Kabsch W. (1993) J. Appl. Crystallogr. 26, 795–800 [Google Scholar]
- 29.McCoy A. J., Grosse-Kunstleve R. W., Adams P. D., Winn M. D., Storoni L. C., Read R. J. (2007) J. Appl. Crystallogr. 40, 658–674 [DOI] [PMC free article] [PubMed] [Google Scholar]
- 30.von Ossowski I., Oksanen E., von Ossowski L., Cai C., Sundberg M., Goldman A., Keinänen K. (2006) FEBS J. 273, 5219–5229 [DOI] [PubMed] [Google Scholar]
- 31.Emsley P., Cowtan K. (2004) Acta Crystallogr. D Biol. Crystallogr. 60, 2126–2132 [DOI] [PubMed] [Google Scholar]
- 32.Murshudov G. N., Vagin A. A., Dodson E. J. (1997) Acta Crystallogr. D Biol. Crystallogr. 53, 240–255 [DOI] [PubMed] [Google Scholar]
- 33.Collaborative Computational Project, Number 4 (1994) Acta Cryst. D Biol Crystallogr. 50, 760–76315299374 [Google Scholar]
- 34.Davis I. W., Leaver-Fay A., Chen V. B., Block J. N., Kapral G. J., Wang X., Murray L. W., Arendall W. B., 3rd, Snoeyink J., Richardson J. S., Richardson D. C. (2007) Nucleic Acids Res. 35, W375–W383 [DOI] [PMC free article] [PubMed] [Google Scholar]
- 35.DeLano W. L. (2002) The PyMOL Molecular Graphics System, DeLano Scientific, San Carlos, CA [Google Scholar]
- 36.Fersht A. (1999) Structure and Mechanism in Protein Science: A Guide to Enzyme Catalysis and Protein Folding, W.H. Freeman and Company [Google Scholar]
- 37.Gianni S., Ivarsson Y., Jemth P., Brunori M., Travaglini-Allocatelli C. (2007) Biophys. Chem. 128, 105–113 [DOI] [PubMed] [Google Scholar]
- 38.Liu Y., Henry G. D., Hegde R. S., Baleja J. D. (2007) Biochemistry 46, 10864–10874 [DOI] [PubMed] [Google Scholar]
- 39.Zhang Y., Dasgupta J., Ma R. Z., Banks L., Thomas M., Chen X. S. (2007) J. Virol. 81, 3618–3626 [DOI] [PMC free article] [PubMed] [Google Scholar]
- 40.Kleywegt G. J., Jones T. A. (1997) Methods Enzymol. 277, 208–230 [DOI] [PubMed] [Google Scholar]
- 41.Travaglini-Allocatelli C., Gianni S., Morea V., Tramontano A., Soulimane T., Brunori M. (2003) J. Biol. Chem. 278, 41136–41140 [DOI] [PubMed] [Google Scholar]
- 42.Gianni S., Travaglini-Allocatelli C., Cutruzzolà F., Brunori M., Shastry M. C., Roder H. (2003) J. Mol. Biol. 330, 1145–1152 [DOI] [PubMed] [Google Scholar]
- 43.Kiefhaber T. (1995) Proc. Natl. Acad. Sci. U.S.A. 92, 9029–9033 [DOI] [PMC free article] [PubMed] [Google Scholar]
- 44.Jemth P., Gianni S. (2007) Biochemistry 46, 8701–8708 [DOI] [PubMed] [Google Scholar]
- 45.Haglund E., Lindberg M. O., Oliveberg M. (2008) J. Biol. Chem. 283, 27904–27915 [DOI] [PubMed] [Google Scholar]
- 46.Oliveberg M., Wolynes P. G. (2005) Q. Rev. Biophys. 38, 245–288 [DOI] [PubMed] [Google Scholar]
- 47.Boehr D. D., Wright P. E. (2008) Science 320, 1429–1430 [DOI] [PubMed] [Google Scholar]


