Abstract
Solution-phase hydrogen/deuterium exchange monitored by mass spectrometry is an excellent tool to study protein-protein interactions and conformational changes in biological systems, especially when traditional methods such as X-ray crystallography or nuclear magnetic resonance are not feasible. Peak overlap among the dozens of proteolytic fragments (including those from autolysis of the protease) can be severe, due to high protein molecular weight(s) and the broad isotopic distributions due to multiple deuterations of many peptides. In addition, different subunits of a protein complex can yield isomeric proteolytic fragments. Here, we show that depletion of 13C and/or 15N for one or more protein subunits of a complex can greatly simplify the mass spectra, increase the signal-to-noise ratio of the depleted fragment ions, and remove ambiguity in assignment of the m/z values to the correct isomeric peptides. Specifically, it becomes possible to monitor the exchange progress for two isobaric fragments originating from two or more different subunits within the complex, without having to resort to tandem mass spectrometry techniques that can lead to deuterium scrambling in the gas phase. Finally, because the isotopic distribution for a small to medium-size peptide is essentially just the monoisotopic species (12Cc1Hh14Nn16Oo32Ss), it is not necessary to deconvolve the natural abundance distribution for each partially deuterated peptide during HDX data reduction.
Keywords: Fourier Transform, Ion Cyclotron Resonance Mass Spectrometry, FTMS, Protein Complexes, Troponin
Introduction
Nuclear magnetic resonance (NMR)1, 2 and X-ray crystallography3, 4 have traditionally been used to study protein structure and protein-protein interactions. They provide spatial resolution at the atomic level (X-ray diffraction) or at the amino acid level (NMR). However, NMR requires high protein amount and concentration, and relatively low molecular weight (typically <100 kDa), and X-ray diffraction requires crystallization of the sample, does not resolve flexible domains of molecules, and crystal packing forces can induce non-native conformations. Over the past two decades, solution-phase hydrogen/deuterium exchange (HDX) monitored by mass spectrometry has emerged as a complementary technique to the abovementioned methods.5–10 Unlike chemical labeling techniques required for fluorescence, electron paramagnetic resonance, etc, in which only local structural information in the vicinity of the label is extracted, HDX of the protein backbone gives insights on the overall structure of a protein complex.
However, a major drawback of the HDX technique is back-exchange during the desalting and separation of the proteolytic fragments. We have used supercritical fluid chromatography (SFC)11 or fast reversed-phase liquid chromatography12 to address that problem. Another problem for HDX is the identification/assignment of the observed m/z values to their appropriate proteolytic fragments in the primary sequence of the subunits that constitute a complex. Each fragment peptide exhibits an isotopic distribution of masses, due primarily to naturally abundant 13C, 15N, and 34S. As the number of proteolytic fragments increases with increasing protein complex molecular weight, the isotopic distributions overlap. High resolution mass analyzers such as Fourier-transform ion cyclotron resonance (FT-ICR)13–18 help to resolve the complexity of the resulting mass spectra. However, deuteration after incubation in heavy water broadens each natural-abundance isotopic distribution and thus increases the number and extent of overlaps, further complicating peptide identification.
Moreover, the similarity in amino acid composition between segments of the subunits of a complex can yield several isomeric (i.e. isobaric) peptides after proteolytic digestion. For example, two peptides that differ in amino acid composition only by isoleucine vs. leucine, or by aspartic acid & glutamine vs. glutamic acid & asparagine, are isomers, and thus have essentially identical molecular weights. Traditionally, tandem mass spectrometry techniques (MS/MS) have been used to identify the sequence and therefore the origin of the fragment. However, those techniques often require a relatively high abundance of the precursor ion, without significant overlap with other peptides in the mass spectrum, and are thus generally not applicable to the complex peptide mixtures generated in HDX experiments. Moreover, traditional slow-heating of a partially deuterated precursor gas-phase peptide causes deuterium scrambling,19 thereby vitiating the desired identification of the site(s) of solution-phase deuteration. Recently, Abzalimov et al.20 claimed that electron transfer dissociation (ETD) could be used without scrambling, but their work was performed with a model protein and the applicability to a wider range of samples remains debatable.
Algorithms designed to better deconvolve overlapped isotopic distributions include NITPICK,21, The Deuterator,22 and our own analysis package.23 In addition, Slysz et al. demonstrated that the use of diluted heavy water can limit the width of the isotopic distributions without significantly affecting deuterium labeling.24 In the present method, we show how isotopic depletion can reduce overlap between peptide isotopic distributions, as well as unequivocally distinguish isobaric peptides from different proteins in a complex. Isotopic depletion may be achieved by growing the cells that express the protein of interest in a minimal medium in which the only source of carbon is 13C-depleted glucose (99.9% 12C) and the only source of nitrogen is 15N-depleted ammonium sulfate (99.95% 14N). In 1997, Marshall et al. showed that isotopic depletion of p16 tumor suppressor protein (~16 kDa) narrows and shifts the isotopic distribution to lower mass, and increases signal-to-noise ratio, because the same signal is now distributed among fewer peaks. In addition, the monoisotopic peak that contributed only 0.081% of the isotopic abundance in a non-depleted protein became the most abundant isotopologue for the doubly depleted protein.25, 26 Initially applied to electrosprayed proteins,25, 26 isotopic depletion has been extended to whole cell bacterial proteins analyzed by matrix-assisted laser desorption ionization,27 and to high-throughput proteomics.28 The implications of isotopic depletion for mass measurement of large biomolecules have been analyzed theoretically.29 Isotopic depletion has also been used to enhance the quality of MS/MS spectra such as collision-induced dissociation (CID) and electron capture dissociation (ECD), for which an increase in the number of the identified fragment ions and a 2–4 fold signal enhancement were reported.30, 31 Charlebois et al. performed solution-phase HDX on ubiquitin but fragmented the protein in the gas phase with ECD in an attempt to localize the site(s) of deuterium incorporation. However, further comparison to NMR exchange rates was needed to determine the extent of deuterium scrambling in the gas phase.30
In the course of our solution-phase H/D exchange study of the sites of interaction between the subunits of the troponin complex and their calcium-induced conformational changes (beyond the scope of the present manuscript), we have isotopically depleted some of the subunits. Troponin (Tn) is a 77 kDa heterotrimeric complex involved in the calcium regulation of muscle contraction. It is composed of TnC, the calcium binding subunit; TnI, the inhibitory subunit; and TnT, the unit that anchors the complex to the thin filament of the muscle sarcomere. The structure and function of troponin have been extensively reviewed.32–34 Here we show how isotopic depletion reduces the complexity and improves the signal-to-noise ratio of the mass spectra that result from proteolytic digestion of the troponin complex following H/D exchange. Most important, isotopic depletion enables the unique identification of the several isomeric/isobaric fragments and thereby allows for monitoring of their solvent exposure via HDX.
Experimental Methods
Materials
13C depleted glucose (~99.9% 12C), 15N depleted ammonium sulfate (~99.95% 14N), deuterium oxide D2O (99.9%), formic acid, and protease type XIII from Aspergillus satoi were obtained from Sigma Aldrich (St. Louis, MO, USA). Tris, MOPS, NaCl, KCl, MgCl2, MgSO4 urea, and ultrahigh-purity HPLC solvents (water and acetonitrile) for mass spectrometric analysis were obtained from VWR international (Suwanee, GA, USA).
Protein Expression and Purification
Plasmid vectors, which carry the genes of the troponin complex subunits, were expressed and purified separately from E. coli bacteria (BL21 DE3 strain) as described previously.35–37 Proteins with natural abundance isotopes were expressed in Luria Broth (LB) medium. In addition, TnC and TnI were isotopically depleted in either 13C (single depletion) or both 13C and 15N (double depletion). For depleted proteins, the expression was carried out in minimal medium (M9) in which the only source of carbon is 13C-depleted glucose and the only source of nitrogen is 15N-depleted ammonium sulfate. The M9 medium was prepared in 10 mM phosphate buffer at pH 7.5, 10 mM NaCl, 20 mM (NH4)2SO4, 2 mM MgSO4, 0.1 mM CaCl2, 5 µM FeCl3, 4 g/L glucose, and 3 mM vitamin B1. The BL21 cells were grown in the presence of ampicillin at 37 ° C. At an optical density (OD) of ~0.6 at 600 nm, the expression was induced with isopropyl β-D-1-thiogalactopyranoside and allowed to proceed for an additional 4 h. The medium was centrifuged and the pellet was resuspended in the appropriate lysis buffer for purification according to protocols previously described 35–37
Complex Reconstitution
Four different troponin complexes were reconstituted: a) all troponin subunits C, T and I with natural abundance isotopes; b) only TnC was isotopically depleted in 13C; c) only TnI was isotopically depleted in 13C; and d) both TnC and TnI were isotopically depleted in 13C. The final reconstitution buffer was: 50 mM MOPS in the presence of 0.1 M KCl and 3 mM MgCl2 at pH 7.2.
Sample Preparation and Mass Spectrometric Analysis
Each of the abovementioned complexes (4 µM) was digested for 2 min with protease XIII prepared in 2% formic acid at 4.5 mg/mL.38 The final pH of the solution was ~2.3. The digest was injected onto a ProZap C18 column and eluted at 300 µL/min with a short, 1.5 min gradient (2% to 95% acetonitrile) to minimize back-exchange.12 The eluent was post-column split (1:100) and introduced into a hybrid 14.5 T LTQ-FT-ICR mass spectrometer by micro-electrospray ionization.39 The same procedure was followed for the HDX experiments; however, the complexes were incubated for either 1 min or 8 h in deuterated buffer prior to quench and digestion. FT-ICR mass spectrometry provides sub-ppm mass accuracy and ultrahigh mass resolving power (m/Δm50% = 200,000 at m/z 400, in which m is the ion mass and Δm50% is the mass spectral peak full width at half-maximum peak height). Data were collected by X-calibur software (Thermo-Fisher) and analyzed by a custom procedure.23 All steps of the HDX experiment were automated by a robot (LEAP technologies) to eliminate human error and standardize timing.40 Every experiment was run in triplicate to determine reproducibility.
Results and Discussion
Isotopic Depletion of Intact TnC Protein: Identification of Oxidation and Sodiation
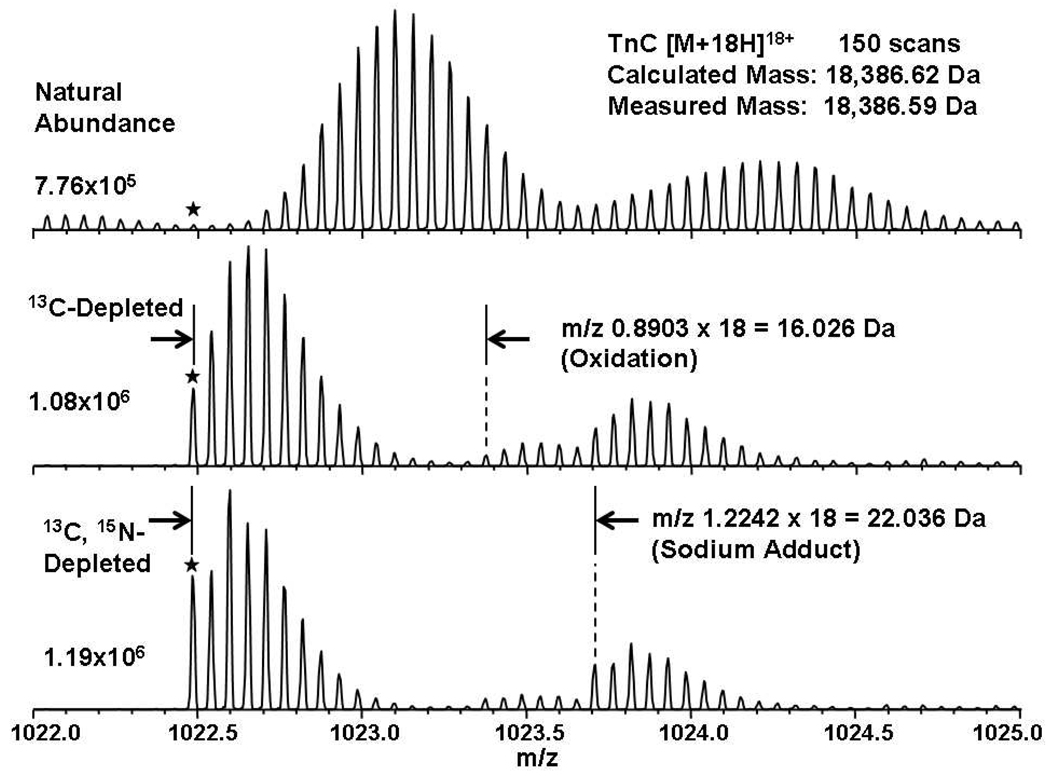
To verify that a given purified protein was successfully depleted, direct infusion electrospray ionization FT-ICR mass spectra were collected for the [M+18H]18+ quasimolecular ion from TnC and its singly and doubly depleted counterparts (Figure 1). As predicted, the isotopic distribution of the depleted proteins shifts to lower m/z and exhibits higher signal-to-noise ratio due to fewer peaks from heavy atoms, at the same protein concentration. In addition, the monoisotopic mass (*) is clearly distinguishable in the mass spectra of the depleted proteins, but not at natural abundance. We could thus easily calculate the experimental mass based on the monoisotopic peak without the need for traditional software programs that fit the entire isotopic distribution to calculate the mass. The experimental isotopic distributions for the depleted proteins were essentially identical (not shown) to those calculated by IsoPro41 for assumed 99.9% 12C and 99.95% 15N isotopic compositions.
Figure 1.
Positive-ion electrospray 14.5 T FT-ICR mass spectra of directly infused TnC. Each spectrum is obtained from the sum of 150 time-domain transients for the 18+ charge state of the protein. The star represents the monoisotopic mass in each spectrum. The number listed at left represents the maximum absolute abundance in each spectrum. Note how single- (and especially double-) isotopic depletion facilitates resolution and identification of oxidized and sodiated forms.
In addition, isotopic depletion enables resolution of the unmodified protein and its chemical modifications and adducts. The spectrum of natural abundance TnC shows only two isotopic distributions, whereas the spectra of singly- and doubly-depleted TnC exhibit three distinct distributions, each with 18+ charge state. The lowest mass distribution is that of the native protein and has the highest abundance. The monoisotopic mass for the next highest mass distribution (and least abundant) is higher by m/z 0.89 (i.e., ~16 Da) than that for the unmodified TnC, and thus represents TnC with a single methionine oxidized either before mass analysis (TnC has 11 Met), or during the electrospray process. Similarly, the monoisotopic mass of the highest-mass isotopic distribution is higher by m/z 1.22 (i.e., ~22 Da) than the unmodified TnC monoisotopic mass, typical of a singly-sodiated species. Therefore, isotopic depletion aids in the identification of chemical modifications and adducts by reducing overlap between their isotopic distributions.
Isotopic Depletion: Proteolysis vs. Autolysis
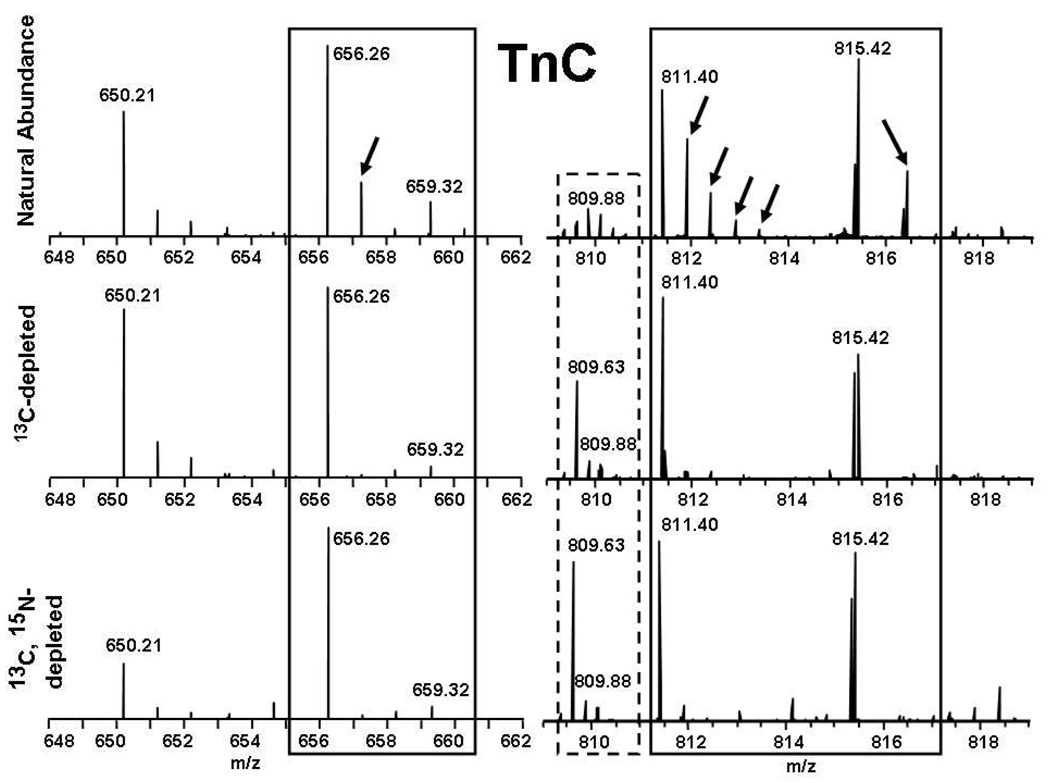
Mass spectral segments corresponding to a few of the peptides from a proteolytic digest of natural abundance TnC and its singly and doubly depleted counterparts are shown in Figure 2. Figure 2 (top) shows that for a peptide of ~800 Da in mass (e.g., [RMLGQNP+H]+), species containing one 13C or 15N are readily apparent at ~1 Da above the monoisotopic mass. For peptides of higher mass (e.g., [KNADGYIDLEELKI+2H]2+), peaks corresponding to 1–4 13C and/or 15N are evident. However, 13C-depletion (middle) or combined 13C, 15N-depletion (bottom) effectively eliminate the heavy-atom contributions for such peptides, leaving just the monoisotopic species. Thus, it becomes easy to distinguish natural-abundance peptides from undepleted protein(s) (and from autolysis of the protease used in solution-phase HDX experiments) from isotopically-depleted peptides. For example, the distribution with monoisotopic m/z 650.21 must arise from the protease, because its isotopic distribution is the same in all three spectra. Conversely, species with monoisotopic m/z values of 656.26, 659.32, 811.40 and 815.42 (delineated by solid rectangles) must arise from proteolysis of TnC because their heavy-atom components disappear on isotopic depletion.
Figure 2.
Positive-ion ESI 14.5 T FT-ICR mass spectra for various peptides generated by protease XIII digestion of natural abundance (top), singly depleted (middle), and doubly depleted TnC (bottom). The peaks delineated by the rectangles represent fragment ions that belong to the digested protein TnC, whereas the species with monoisotopic m/z 650.21 is an autolysis product of the protease (see text). Note the increased abundance of the monoisotopic peak of the distribution (dashed reactangle).
Isotopic depletion also serves to better clearly define low-abundance peptides in a crowded spectrum. For example, the peptide with monoisotopic m/z 809.63 delineated by a dashed rectangle is prominent in the mass spectra of singly and doubly depleted TnC; but not readily apparent in the mass spectrum from the natural abundance protein digest.
Single- vs. Double-Isotopic Depletion
Whether for direct infusion or a proteolytic digest, we observed no major difference between the mass spectra of proteolytic peptides from singly and doubly depleted TnC. Unlike intact proteins, which can contain dozens of nitrogen atoms, 15N depletion does not significantly affect the isotopic distribution for a small to medium-size peptide, because 15N is only 0.37% naturally abundant (vs. 1.11% for 13C 42), and peptides and proteins contain almost four times as many carbons as nitrogens. Therefore, from here on, we shall focus exclusively on experiments performed with singly 13C-depleted Tn subunits.
Isotopic Depletion: Which Peptide Corresponds to which Protein?
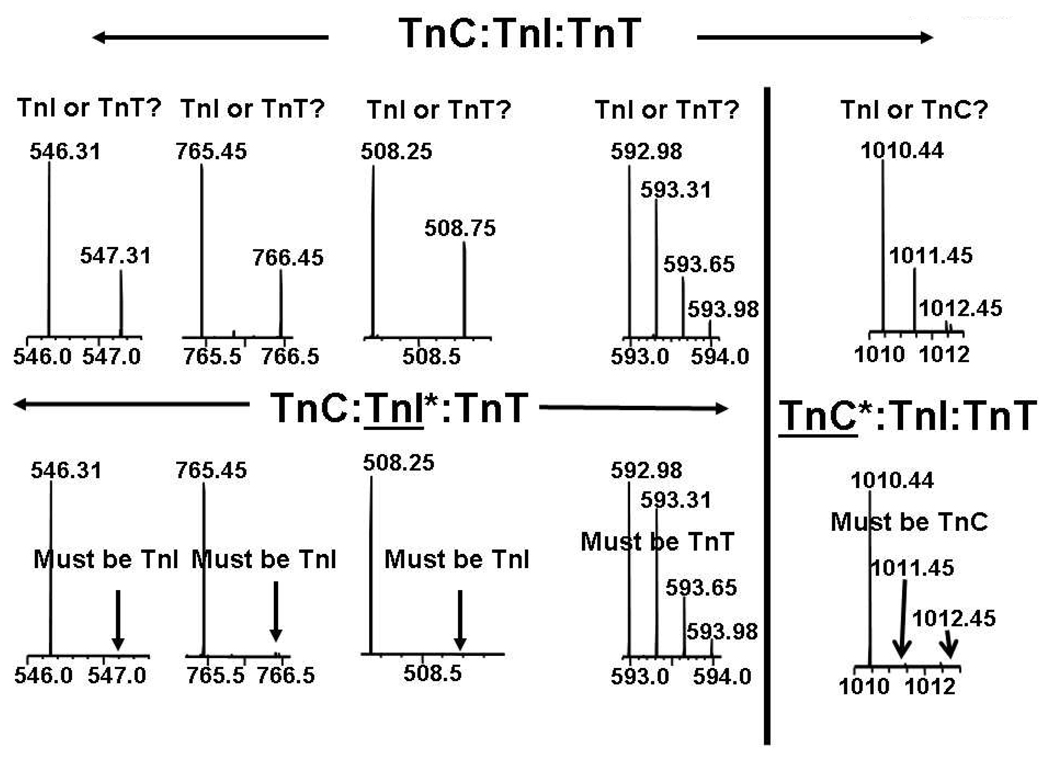
From protease XIII digest of natural abundance Tn, 45 proteolytic fragments could be uniquely assigned by our software tool to TnC (93% sequence coverage), 46 fragments to TnI (76% sequence coverage), and 85 fragments to TnT (75% sequence coverage). However, due to sequence and amino acid similarities, multiple isobaric/isomeric peptide fragments were produced. Therefore, 16 m/z values could be assigned to two or more isomeric (i.e., isobaric, because they have the same amino acid composition) fragments, some of which are found in biologically important areas in different subunits of the Tn complex (Table 1). For instance, the peptide with monoisotopic m/z = 592.983+ could be either TnT fragment 76–91 or TnI fragment 155–170. The latter is also known as the switch peptide, an important fragment in the Tn complex. To resolve that ambiguity, we performed parallel digestions of TnC-depleted and TnI-depleted Tn (see Figure 3 and Table 1). The analysis is simple: near-disappearance of heavy atom-containing species indicates that that peptide belongs to the depleted subunit(s). For example, each of the species with monoisotopic m/z 546.31, 765.45 and 508.25, and 592.98 could originate from TnI or TnT. However, the disappearance of heavy atoms from the m/z 546.31, 765.45 and 508.25 isotopic distributions for Tn depleted in TnI proves that those proteolytic peptides must originate from the TnI subunit of Tn. Conversely, the isotopic distribution associated with monoisotopic m/z 592.98 is unaffected by TnI depletion, and thus must originate from TnT. Similarly, the distribution with monoisotopic m/z 1010.44 must originate from TnC because its heavy atom components disappear from Tn depleted in TnC.
Table 1.
Selected peptides with m/z values that could be assigned to more than one fragment originating from two or more subunits. The sequence, segment location, and theoretical monoisotopic mass of each neutral peptide fragment with sub-ppm mass accuracy assignment are provided.
| m/z | Monoisotopic Mass (Da) |
TnC Fragment | TnI Fragment | TnT Fragment |
|---|---|---|---|---|
| 546.3133 (1+) | 545.3060 | ITEIA (123–127) 545.3061 |
TLIEA (109–113) 545.3061 |
|
| 765.4505 (1+) | 764.4431 | LTQKIY (129–134) 764.4432 |
VPPKIPD (80–86) 764.4432 |
|
| 508.2514 (2+) | 1,014.4882 | RAYATEPHA (28–36) 1,014.4883 |
IEAHFENR (111–118) 1,014.4883 |
|
| 592.9820 (3+) | 1,775.9240 | MMQALLGTRAKESLDL (155–170) 1,775.9272 |
MPNLVPPKIPDGERVD (76–91) 1,775.9238 |
|
| 575.3221 (1+) | 574.3148 | IMLQA (119–123) 574.3148 |
MLQIA (156–160) 574.3148 |
|
| 1,010.4427 (1+) | 1,009.4354 | DKNADGYID (105–113) 1,009.4352 |
EERYDVEA (109–116) 1,009.4352 |
- |
| 488.2720 (1+) | 487.2642 | VEQL (9–12) 487.2642 |
LQDL (94–97) 487.2642 |
LNEL (104–107) 487.2642 |
Figure 3.
Mass spectral segments corresponding to each of five proteolytic peptides from the troponin complex, with all the subunits at natural abundance (top), isotopically depleted TnI (bottom left), and isotopically depleted TnC (bottom). In each case, the natural-abundance peptide could arise from isomeric peptides from either of two of the three Tn subunits, but isotopic depletion (and thus elimination of all but the monoisotopic peak) for either TnI or TnC clearly identifies the correct subunit (see text).
Isotopic Depletion Combined with Retention Time for Fragment Identification
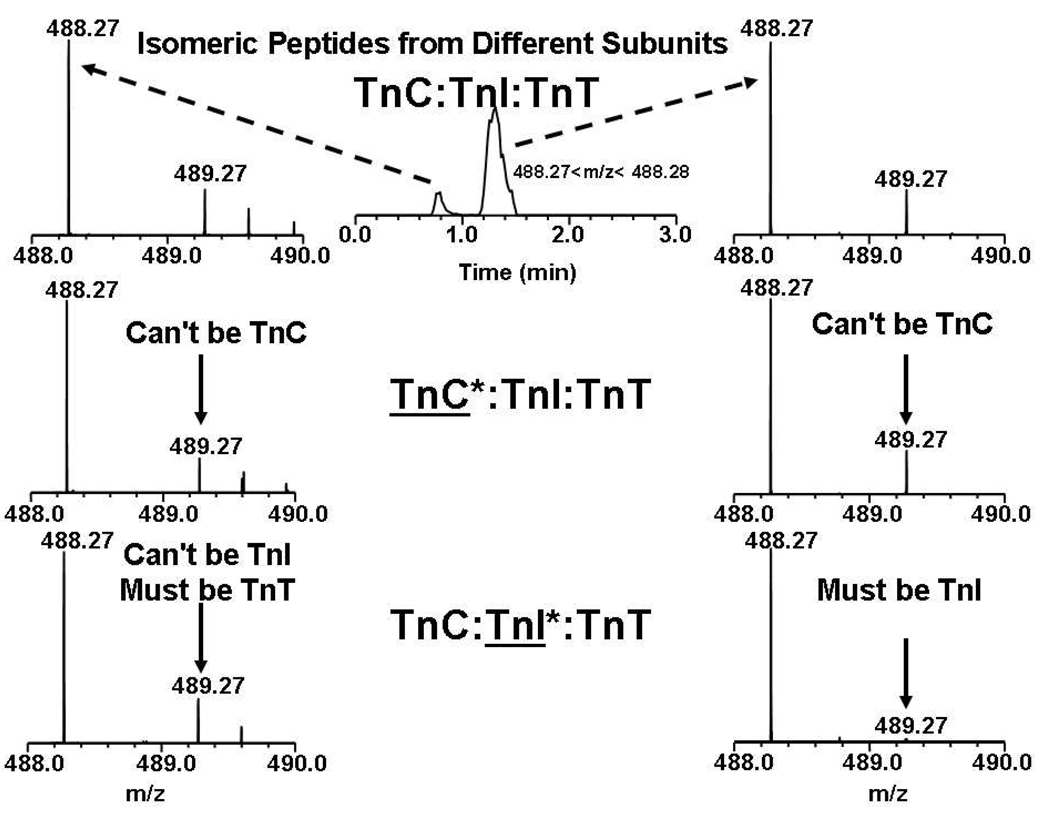
Suppose that isomeric proteolytic peptides can originate from two or more subunits of a protein complex. In that case, mass alone is insufficient, but the issue can be resolved by combining mass measurement with LC retention time. Consider the peptide with monoisotopic m/z 488.27 that could be assigned to the TnC, TnI or TnT subunits (see Table 1). Figure 4 shows that reversed-phase chromatography resolves two peptides of identical m/z 488.27 but different retention time. The isotopic distribution for the peptide that elutes first is unaffected by TnC or TnI depletion, and thus must originate from TnT. However, the isotopic distribution for the peptide that elutes second loses its heavy atom components when TnI (but not TnC) is depleted, and must thus originate from TnI. Therefore, the combination of LC retention time and isotopic depletion allows for correct matching of peptides and subunits, even when peptides from two different subunits are isomers.
Figure 4.
Mass spectral segments corresponding to either of two isomeric proteolytic peptides from the troponin complex with all three subunits at natural abundance (top), with depleted TnC (middle) and with depleted TnI (bottom). The total ion current chromatogram is shown at the top center. Again, isotopic depletion serves to identify the correct subunit for each isomeric peptide (see text).
Monitoring H/D Exchange for Isobaric Fragments
In our efforts to study conformational changes and interaction sites between the subunits of the ternary Tn complex, we had to establish the sites of interaction between two subunits before proceeding with the entire complex. We therefore reconstituted a binary complex (TnC + TnI), in which TnC was depleted. In contrast to the ternary complex, m/z 488.27 from proteolysis of the binary TnC:TnI complex could arise from either of two fragment ions, one corresponding to TnC and the other to TnI (Figure 5). Isotopic depletion combined with LC retention time allowed us to follow the progress of H/D exchange for the above-mentioned isobaric fragments. We were able to monitor the deuterium incorporation of the VEQL (9–12) fragment ion that belongs to the depleted protein TnC versus the isomeric LQDL (94–97) fragment ion that belongs to the non-depleted protein TnI, after 1 min and 8 hours of exchange. The isotopic distribution of the depleted fragment showed fewer heavy-atom peaks, was shifted to lower m/z and had higher S/N ratio compared to the non-depleted protein fragment. For both fragments, the exchange was fast: the 1-min-exchange spectra were similar to the 8-hour-exchange ones. However, the difference in the isotopic distribution patterns allowed the clear, unambiguous monitoring of the isobaric peptides without the use of MS/MS. Note that for a small to medium-size isotopically depleted peptide, the isotopic distribution is essentially just the monoisotopic species (12Cc1Hh14Nn16Oo32Ss). Therefore, it is not necessary to deconvolve the natural abundance distribution for each partially deuterated peptide during HDX data reduction. Isotopic depletion (13C or 13C,15N) should also be useful in quantitation of proteins generated under different conditions with naturally abundant vs. isotopically enriched nutrients or labels, by eliminating deconvolution in the determination of 16O/18O or 14N/15N ratios.
Figure 5.
Mass spectral segments for proteolytic peptides from TnC (left, isotopically depleted) and TnI (right, natural abundance), following hydrogen/deuterium exchange for 0, 1, and 8 min. The number-average mass (*) for the unexchanged isotopically depleted peptide is simply the monoisotopic mass, so that subsequent incorporation of deuterium can be calculated directly from the number-average mass, without the need to deconvolve the natural abundance isotopic distribution (see text).
Reduction in Mass Spectral Complexity
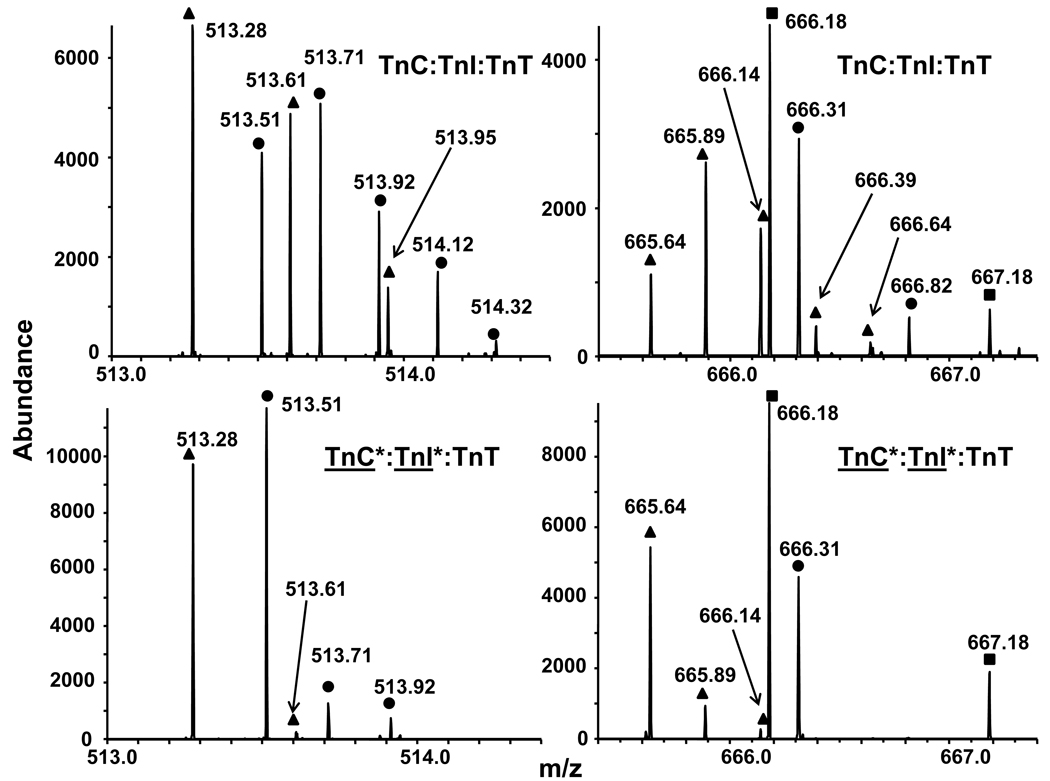
HDX experiments are limited by the overlap between isotopic distributions of different peptides, due to the large number of proteolytic fragments of high molecular weight proteins as well as the additional peaks resulting from convolution of the natural abundance isotopic distribution with that from deuterium incorporation. Figure 6 shows two mass spectral segments obtained following proteolysis of natural abundance Tn (top) and Tn depleted in TnC and TnI (bottom). Isotopic depletion reduced the number of peaks from 17 to 11, with corresponding increase in S/N ratio. The three consecutive peaks at m/z 513.51, 513.61 and 513.71 in the top spectrum are separated by 0.1 Da, and could be assigned (e.g., by automated software) as a 10+ charge state peptide. However, isotopic depletion eliminates such misassignment because the relative abundances among those three peaks change dramatically on isotopic depletion (and thus cannot arise from the same peptide).
Figure 6.
Mass spectral segments for proteolytic peptides from TnC:TnI:TnT. Top: All three subunits are at natural abundance. Bottom: Subunits TnC and TnI have been isotopically depleted. The assignment of the distributions from the natural abundance complex (top: circles, squares, and triangles) is greatly facilitated from the much simpler assignment for the isotopically depleted peptides (bottom: circles and triangles only).
Moreover, isotopic depletion can relax the need for high mass resolving power. For instance, direct resolution of the peaks at m/z 513.92 and 513.95 (separated by 30 mDa) and at m/z 666.14 and 666.18 (separated by 40 mDa) would require relatively high resolving power (m/Δm50% = 17,000). FT-ICR MS serves as an excellent tool for HDX experiments because of its ability to resolve isotopic peaks differing by as little as 1.1 mDa. Isotopic depletion serves either to extend FT-ICR MS analysis of HDX to larger protein complexes or to improve the performance of lower-resolution mass analyzers for protein complexes of the same size.
Acknowledgments
The authors thank Erik Stapleton for help in protein expression and purification, and Jeremiah Tipton, Christopher Hendrickson, and Greg Blakney for helpful discussions. This work was supported by NIH (GM 78359), The American Heart Association, NSF (DMR-06-54118), and the State of Florida.
References
- 1.Zuiderweg ERP. Biochemistry. 2002;41:1–7. doi: 10.1021/bi011870b. [DOI] [PubMed] [Google Scholar]
- 2.Wider G. Biotechniques. 2000;29:1278–1294. doi: 10.2144/00296ra01. [DOI] [PubMed] [Google Scholar]
- 3.Parker MW. Journal of Biological Physics. 2003;29:341–362. doi: 10.1023/A:1027310719146. [DOI] [PMC free article] [PubMed] [Google Scholar]
- 4.Campbell ID. Nature Reviews Molecular Cell Biology. 2002;3:377–381. doi: 10.1038/nrm800. [DOI] [PubMed] [Google Scholar]
- 5.Wales TE, Engen JR. Mass Spectrometry Reviews. 2006;25:158–170. doi: 10.1002/mas.20064. [DOI] [PubMed] [Google Scholar]
- 6.Smith DL, Deng YZ, Zhang ZQ. Journal of Mass Spectrometry. 1997;32:135–146. doi: 10.1002/(SICI)1096-9888(199702)32:2<135::AID-JMS486>3.0.CO;2-M. [DOI] [PubMed] [Google Scholar]
- 7.Englander SW. Journal of the American Society for Mass Spectrometry. 2006;17:1481–1489. doi: 10.1016/j.jasms.2006.06.006. [DOI] [PMC free article] [PubMed] [Google Scholar]
- 8.Komives EA. International Journal of Mass Spectrometry. 2005;240:285–290. [Google Scholar]
- 9.Kaltashov YA. International Journal of Mass Spectrometry. 2005;240:249–259. [Google Scholar]
- 10.Chalmers MJ, Busby SA, Pascal BD, He YJ, Hendrickson CL, Marshall AG, Griffin PR. Analytical Chemistry. 2006;78:1005–1014. doi: 10.1021/ac051294f. [DOI] [PubMed] [Google Scholar]
- 11.Emmett MR, Kazazic S, Marshall AG, Chen W, Shi SD, Bolanos B, Greig MJ. Anal Chem. 2006;78:7058–7060. doi: 10.1021/ac060693n. [DOI] [PubMed] [Google Scholar]
- 12.Zhang HM, Bou-Assaf GM, Emmett MR, Marshall AG. Journal of the American Society for Mass Spectrometry. 2009;20:520–524. doi: 10.1016/j.jasms.2008.11.010. [DOI] [PMC free article] [PubMed] [Google Scholar]
- 13.Marshall AG, Hendrickson CL, Emmett MR. Abstracts of Papers of the American Chemical Society. 1998;215:U96–U96. [Google Scholar]
- 14.Marshall AG, Hendrickson CL, Jackson GS. Mass Spectrometry Reviews. 1998;17:1–35. doi: 10.1002/(SICI)1098-2787(1998)17:1<1::AID-MAS1>3.0.CO;2-K. [DOI] [PubMed] [Google Scholar]
- 15.Marshall AG, Hendrickson CL, Emmett MR. Abstracts of Papers of the American Chemical Society. 2000;220:U98–U98. [Google Scholar]
- 16.Marshall AG, Hendrickson CL. International Journal of Mass Spectrometry. 2002;215:59–75. [Google Scholar]
- 17.Marshall AG, Blakney GA, Chalmers MJ, Emmett MR, Gaskell SJ, Hendrickson CL, Lam TT, Lanman JK, Li H, Mischak H, Prevelige PJ, Quinn JP, Xu FM. Abstracts of Papers of the American Chemical Society. 2003;225:U146–U146. [Google Scholar]
- 18.Hendrickson CL, Emmett MR, Nilsson CL, Marshall AG. Abstracts of Papers of the American Chemical Society. 2004;228:U157–U157. [Google Scholar]
- 19.Jorgensen TJD, Gardsvoll H, Ploug M, Roepstorff P. Journal of the American Chemical Society. 2005;127:2785–2793. doi: 10.1021/ja043789c. [DOI] [PubMed] [Google Scholar]
- 20.Abzalimov RR, Kaplan DA, Easterling ML, Kaltashov IA. Journal of the American Society for Mass Spectrometry. 2009;20:1514–1517. doi: 10.1016/j.jasms.2009.04.006. [DOI] [PMC free article] [PubMed] [Google Scholar]
- 21.Renard BY, Kirchner M, Steen H, Steen JAJ, Hamprecht FA. Bmc Bioinformatics. 2008;9:355–370. doi: 10.1186/1471-2105-9-355. [DOI] [PMC free article] [PubMed] [Google Scholar]
- 22.Pascal BD, Chalmers MJ, Busby SA, Mader CC, Southern MR, Tsinoremas NF, Griffin PR, Griffin PR. Bmc Bioinformatics. 2007;8:156–167. doi: 10.1186/1471-2105-8-156. [DOI] [PMC free article] [PubMed] [Google Scholar]
- 23.Kazazic S, Zhang H-M, Schaub TM, Emmett MR, Hendrickson CL, Blakney GT, Marshall AG. J. Am. Soc. Mass Spectrom. 2010;21:000–000. doi: 10.1016/j.jasms.2009.12.016. [DOI] [PMC free article] [PubMed] [Google Scholar]
- 24.Slysz GW, Percy AJ, Schriemer DC. Analytical Chemistry. 2008;80:7004–7011. doi: 10.1021/ac800897q. [DOI] [PubMed] [Google Scholar]
- 25.Marshall AG, Senko MW, Li W, Li M, Dillon S, Guan S, Logan TM. Journal of the American Chemical Society. 1997;119:433–434. [Google Scholar]
- 26.Marshall AG, Emmett MR, Freitas MA, Hendrickson CL, Zhang Z. Mass Spectrometry in Biology & Medicine. 2000:31–52. [Google Scholar]
- 27.Stump MJ, Jones JJ, Fleming RC, Lay JO, Wilkins CL. Journal of the American Society for Mass Spectrometry. 2003;14:1306–1314. doi: 10.1016/S1044-0305(03)00577-4. [DOI] [PubMed] [Google Scholar]
- 28.Pasa-Tolic L, Jensen PK, Anderson GA, Lipton MS, Peden KK, Martinovic S, Tolic N, Bruce JE, Smith RD. Journal of the American Chemical Society. 1999;121:7949–7950. [Google Scholar]
- 29.Zubarev RA, Demirev PA. Journal of the American Society for Mass Spectrometry. 1998;9:149–156. [Google Scholar]
- 30.Charlebois JP, Patrie SM, Kelleher NL. Analytical Chemistry. 2003;75:3263–3266. doi: 10.1021/ac020690k. [DOI] [PubMed] [Google Scholar]
- 31.Akashi S, Takio K, Matsui H, Tate S, Kainosho M. Analytical Chemistry. 1998;70:3333–3336. doi: 10.1021/ac980215f. [DOI] [PubMed] [Google Scholar]
- 32.Parmacek MS, Solaro RJ. Progress in Cardiovascular Diseases. 2004;47:159–176. doi: 10.1016/j.pcad.2004.07.003. [DOI] [PubMed] [Google Scholar]
- 33.Gordon AM, Homsher E, Regnier M. Physiological Reviews. 2000;80:853–924. doi: 10.1152/physrev.2000.80.2.853. [DOI] [PubMed] [Google Scholar]
- 34.Gomes AV, Potter JD, Szczesna-Cordary D. Iubmb Life. 2002;54:323–333. doi: 10.1080/15216540216037. [DOI] [PubMed] [Google Scholar]
- 35.Dong WJ, Chandra M, Xing J, She MD, Solaro RJ, Cheung HC. Biochemistry. 1997;36:6754–6761. doi: 10.1021/bi9622276. [DOI] [PubMed] [Google Scholar]
- 36.Dong WJ, Xing J, Villain M, Hellinger M, Robinson JM, Chandra R, Solaro RJ, Umeda PK, Cheung HC. Journal of Biological Chemistry. 1999;274:31382–31390. doi: 10.1074/jbc.274.44.31382. [DOI] [PubMed] [Google Scholar]
- 37.She MD, Xing J, Dong WJ, Umeda PK, Cheung HC. Journal of Molecular Biology. 1998;281:445–452. doi: 10.1006/jmbi.1998.1933. [DOI] [PubMed] [Google Scholar]
- 38.Zhang HM, Kazazic S, Schaub TM, Tipton JD, Emmett MR, Marshall AG. Analytical Chemistry. 2008;80:9034–9041. doi: 10.1021/ac801417d. [DOI] [PMC free article] [PubMed] [Google Scholar]
- 39.Emmett MR, White FM, Hendrickson CL, Shi SDH, Marshall AG. Journal of the American Society for Mass Spectrometry. 1998;9:333–340. doi: 10.1016/S1044-0305(97)00287-0. [DOI] [PubMed] [Google Scholar]
- 40.Kazazic S, Emmett MR, Blakney GT, Hendrickson CL, Marshall AG. [Google Scholar]
- 41.Senko MW. 1998 [Google Scholar]
- 42.Gross J. Mass Spectrometry: a Textbook. Springer: Heidelberg; 2004. [Google Scholar]


