Abstract
Background
Defects in the pulmonary valve (PV) occur in a variety of forms of congenital heart diseases. Quantitative information on PV collagen fiber architecture, and particularly its response to diastolic forces, is necessary for the design and functional assessment of approaches for PV repair and replacement. This is especially the case for novel tissue engineered PV, which rely on extensive in-vivo remodeling for long-term function.
Methods
Porcine PV and aortic valves (AV) were fixed 0 to 90 mmHg transvalvular under a 0 to 90 mmHg transvalvular pressure. After dissection from the root, small angle light scattering (SALS) measurements were conducted to quantify the collagen fiber architecture and changes with increasing applied transvalvular pressure over the entire cusp. Histomorphologic measurements were also performed to assess changes in cuspal layer thickness with pressure.
Results
While the PV and AV displayed anticipated structural similarities, they also presented important functionally related differences. In the unloaded state, the AV cusp demonstrated substantial regional variations in fiber alignment, whereas the PV was surprisingly uniform. Further, the AV demonstrated substantially larger changes in collagen fiber alignment with applied transvalvular pressure compared to the PV. Overall, the AV collagen fiber network demonstrated greater ability to respond to applied transvalvular pressure. A decrease in crimp amplitude was the predominant mechanism for improvement in the degree of orientation of the collagen fibers in both valves.
Conclusions
This study clarified the major similarities and differences between the PV and AV. While underscoring how the PV can serve as an appropriate replacement of the diseased aortic valve, the observed structural differences may also indicate limits to the PV's ability to fully duplicate the AV. Moreover, quantitative data from this study on PV functional architecture will benefit development of tissue engineered PV by defining the critical fiber architectural characteristics.
INTRODUCTION
The composition and structural organization of the extracellular matrix of cardiac valves is the major determinant of valvular mechanical function. Thus, an improved understanding of the cardiac valve extracellular matrix is essential for both understanding cardiac valve pathology and physiology and for designing materials for valve repair or replacement. The biomechanical demands on this matrix are particularly high, as there are approximately 40 million openings and closures of the valve per year (equivalent to approximately 3 billion cycles in a single lifetime). The normal semilunar valves present minimal resistance to opening and a negligible pressure gradient during systolic forward flow. In diastole, these same structures must close promptly and completely to prevent valvular regurgitation and must resist pressure differences between the diastolic arterial or pulmonary artery pressure and the ventricular diastolic pressure. The composition and heterogeneous architecture of the valvular extracellular matrix is uniquely designed to provide a high degree of flexibility during systole, but also a high degree of strength to resist the diastolic pressure load. Moreover, the aortic valve (AV) estimated working tension has been estimated to be approximately 60 N/m [2, 17], yet the tissue fails at approximately 1500 N/m [30] indicating a twenty-fold tensile load safety factor. Although there have been some prior studies of the semi-lunar valve extracellular matrix, particularly of the AV [20, 21, 31], there has been relatively less attention focused on the collagen fiber architecture which provide much of the strength of the pulmonary valve (PV).
Several studies have compared the structural and mechanical properties of the PV and the AV. It has been determined that the porcine PV and the AV cusps are morphologically similar [5]. Analogous to the AV, the PV consists of three layers: fibrosa, spongiosa, and ventricularis. The fibrosa, located immediately below the pulmonary artery surface, is primarily composed of Type I collagen fibers [28]. The ventricularis, which is immediately below the ventricular surface, is composed of elastin and collagen. The spongiosa, located between the fibrosa and the ventricularis, is rich in glycosaminoglycans and water [28]. The thickness of the PV, 0.397±0.114mm, is less than that of the AV, 0.605±0.196mm [26, 27].
Porcine bioprostheses are fixed with glutaraldehyde before implantation in an in order to arrest decomposition and stabilized the cellular and tissue constituents of tissue [29, 37]. Christie and Barratt-Boyes measured the biaxial properties of both AV and PV cusps in extension in the fresh state and then in the same samples after fixation with glutaraldehyde [5]. The results showed that when fresh, the valve cusps had a similar response to load in the circumferential direction, but the PV was more extensible in the radial direction. Fixation decreased the tissue extensibility and increased the stiffness of the PV cusp much less than in the aortic cusps. This was interpreted to mean that the PV collagen content is significantly less than that in the aortic leaflets. Reduced collagen content would be expected to enhance hemodynamic performance because of increased leaflet stretch and reduced stiffness. However, lower collagen levels may reduce implant durability.
The PV also is pertinent to the Ross Procedure. In the Ross procedure the defective AV is replaced with the patient's PV [6]. When placed in the aortic position, the pulmonary root withstands larger forces imposed on it by systemic pressures. It was also found that the pulmonary root is more distensible than the aortic root when subjected to aortic diastolic pressure. The large expansion of the pulmonary root may not allow the cusps to properly coapt and lead to valvular insufficiency [14, 15]. Thus, the resulting geometric changes may affect long term valve function [30]. The underlying pathologies regarding the long-term durability of the PV in the aortic position requires an improved study of the native PV, which is the first step towards developing improved implants.
A better understanding of the PV microstructure would also help the future development of a tissue engineered approaches to their replacement (TEPV) [22]. Mechanical prosthetic valves are very durable, but they require anticoagulation to reduce the risk of thrombosis and thromboembolism [9, 10, 32]. Biological valves, whether they are of allograft or heterograft origin, remain subject to progressive calcific and noncalcific structural deterioration after implantation, which limit the valve durability [7, 9, 10, 25, 24]. Neither prosthetic nor biologic valves have any growth potential, and this limitation represents a major source of morbidity for pediatric patients who must undergo multiple re-operations to replace valves and/or valved conduits as the patients grow. Thus, a tissue engineered heart valve is an innovative solution to overcome the limitations of the bioprosthetic valves, since it can recapitulate normal heart valve functional architecture and can account for somatic growth.
In view of the importance of the PV in a variety of forms of congenital heart disease and the use of the PV to help lay the basis for design and functional assessment of TEPVs, the collagen architecture of the PV and its response to diastolic forces were investigated. Using a porcine model, the normal PV architectural response to loading was quantified and compared to the normal AV from a previous study [20].
MATERIALS AND METHODS
Valve preparation
Because human and pig cardiovascular structures show remarkable anatomical similarity, these animals are good candidates for fundamental studies where obtaining human tissues is not practical [23]. Thus, fresh PV (along with the intact pulmonary root) were harvested from porcine hearts (~8–9 months old) obtained from a local slaughter house, placed into phosphate buffered saline, transported to our laboratory on ice and frozen at −80 °C for later use. Based on a previous study by Woo et al. [35], short-term, low-temperature storage induces negligible effects on the connective tissue mechanical behavior. At time of testing, the PVs were quickly thawed, and the surrounding myocardium was trimmed away from the pulmonary root.
A detailed description of the experimental set-up and protocol for the fixation of semi-lunar heart valves under a steady transvalvular pressure has been previously described [20]. Briefly, each PV was mounted into a fixation tank. A reservoir and fixation tank were first filled with room temperature phosphate buffered solution, then the reservoir was vertically raised in order to achieve the desired pressure level to simulate the diastolic transvalvular pressure on the valve. Next, a fifty percent glutaraldehyde in distilled water was titrated into the reservoir to achieve a 0.5% net concentration to preserve the collagen fiber structure at the current pressure level. Consequently, the valves were left in the “closed” position for 24 hours to assess the effect of diastolic pressure. Pairs of PV were pressurized and fixed at 0, 1, 2, 4, 10, 20, 60, and 90 mmHg, chosen to match the previously studied AV [20]. After 24 hours, each PV was removed from the fixation tank, and the cusps removed by cutting along their attachments to the pulmonary root and stored in the fresh fixation solution at 4 °C. Note that the data from our previous AV study was included, which used identical apparatus, methods, and pressure levels [20]. In particular, identical pressure levels were used to facilitate direct comparisons of the PV and AV microstructures.
Small angle light scattering (SALS) measurements
A detailed description of the SALS technique has been previously presented [18, 19]. Briefly, a 4 mW HeNe continuous unpolarized laser (λ = 632.8 nm) was passed through the tissue specimen. The angular distribution of the scattered light pattern, which represented distribution of fiber angles within light beam envelope, was obtained. Quantifiable information based on the scattered light pattern included an orientation index (OI) and the local preferred fiber direction. The OI was used to quantify the angular distribution of the collagen fibers and is defined as the angle that contains one half of the total area under the scattered light pattern distribution. To simplify physical interpretation, a normalized orientation index (NOI) was calculated using
| (1) |
Note that NOI ranges from 0% for a complete random fiber network to 100%, and is thus a simple linear percentile scale representing the overall degree of fiber alignment.
To prepare specimens for SALS tests, the glutaraldehyde-fixed cusps were dehydrated in graded solutions of glycerol/saline of 50, 75, 87, and 100% for an hour each. This process optically cleared the cusps by removing the water, which caused optical diffusion, within the cusps [36]. We have shown that the graded glycerol solution did not measurably distort the cuspal shape [20]. After SALS measurements were completed, the cusps were rehydrated for histological analysis using reversed graded glycerol/saline solutions.
Histological and morphological analysis
Transverse sections were cut from both commissure and belly regions, with the sections aligned so that the long edge was parallel to the local preferred fiber direction. Picro sirius red stain was used to enhance the natural birefringence collagen fibers [13]. Under polarized light microscopy, collagen fibers of the PV displayed the characteristic periodic light-distinguishing bands that corresponded to collagen crimp periods. In the present study, we defined the crimp period as the distance between two adjacent crimp peaks, and we defined crimp amplitude as the vertical distance from the midpoint to the peak of the crimp structure. To automate crimp measurements, the average intensities of crimp period bands from the histological images were subjected to power Fourier power spectral density analysis using MatLab (The MathWorks, Natick, Massachusetts). Spectral decomposition of the averaged image intensity revealed a distinct peak, which directly corresponded to the frequency of collagen crimp period. Note that the power spectral density analysis accounted for variation in the quality of the digital image that may be mistakenly interpreted as either “noise” or a false frequency peak.
Cuspal thickness was quantified in order to determine changes in layer geometry in response to pressure loading. To highlight the trilayered cusp structure, Movat's Pentachrome was used to stain collagen, elastin, and glycosaminoglycans with yellow, black and blue colors, respectively. Each stained section was imaged with a bright field microscope, from which the total cusp thickness and each layer thickness were measured. The software allowed the user to outline each layer, and then the software computed the distances between each layer.
Effects of tissue creep during fixation
Under a constant load, soft tissues may continue to slowly deform, exhibiting what is termed creep [8]. Since the valves were fixed for a long period (24 hours), creep could cause distortion in the collagen fiber network. In order to confirm that the measured gross fiber structure accurately reflected the instantaneous structural response of the PV to applied pressures, the following measurements were performed on a subset of specimens from the present study group. Four fiducial markers were placed on the cusp surface, and then, subjected to glutaraldehyde fixation under 10 mmHg and 60 mmHg of pressure for 24 hours. Two Hawkeye (HS07-AF) boroscopes (Edmund Optics, Barrington, NJ) were used to track the marker positions during the fixation period. The resulting 3D marker coordinates, which were used to quantify cuspal stretch and thus tissue creep, were reconstructed using established techniques [12].
Effects of root distension
Deformation of the valve cusps results from both transvalvular pressure and distention of the surrounding root. In bioprosthetic valves fixed with root distension only, we have found that this aphysiologic loading patterns results in distorted collagen fiber patterns [33]. This finding suggests that root deformations can have a pronounced effect on cuspal collagen structure. Thus, to investigate the role of aortic and pulmonary root distension alone (i.e. without on the resulting cuspal collagen fiber architecture, a second set of specimens were prepared wherein the root and annulus were physically restricted to the unloaded dimensions. As before, the PV and the AV were exposed to pressures of 20 mmHg and 90 mmHg, respectively, and fixed with glutaraldehyde for 24 hours. The pulmonary and aortic cusps were then subjected to SALS.
Statistical analysis
All results presented were expressed as the mean ± standard error of the means (SEM), where differences were considered statistically significant when p<0.05. Since only two groups (PV and AV) were compared at any given time, t-tests were used to evaluate any differences. A statistically significant difference was designated by an asterisk (*). Also, a statistical analysis was performed with One Way Analysis of Variances (ANOVA) (SigmaStat 3.0, SPSS Inc., Chicago, IL) to show that NOI values were statistically different from the 0 mmHg meant at all non-zero pressure levels and regions. The Holm-Sidak Test, which can be used for pair wise comparisons and comparisons versus a control group, was used for the post hoc comparison. All AV results noted with a cross (†) are results previously presented by Sacks et al. [20].
RESULTS
General characteristics
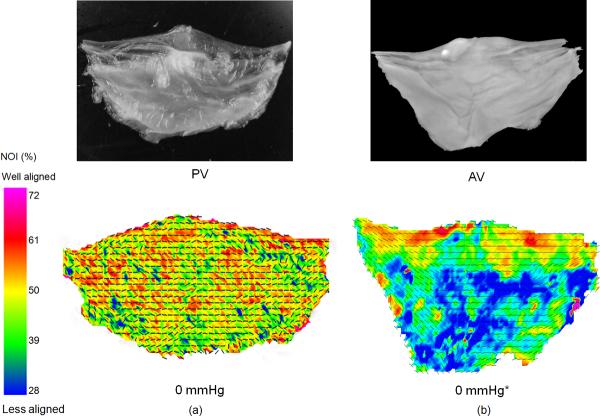
The collagen fiber alignment of the PV and the AV in the unloaded, stress free state (0 mmHg) was distinctly different (Fig. 1). The PV demonstrated an overall higher degree of alignment throughout the cusp compared to the AV, which varied regionally. In particular, the PV did not exhibit the initially high degree of orientation in the coaptation region characteristic of the AV, although the preferred fiber direction of both valves generally coursed along the circumferential direction.
Figure 1.
A comparison of the overall fiber orientation at the stress free state for the PV and the AV. (a) A photograph of the PV leaflet and the resulting SALS data demonstrating that the PV was rather uniformly circumferential alignment with no clear regional variations. (b) Same representative data for the AV, which demonstrated clear regional variations and a more curvilinear fiber alignment over the cusp. The preferred fiber direction for both the PV and the AV coursed along the circumferential direction. The PV valve also had a higher fiber alignment as indicated by their respective NOI values.
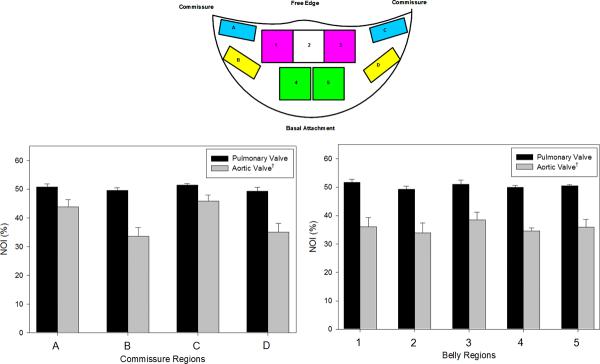
Following our AV analysis [20], the SALS data for each cusp was divided in to upper (Regions A and C) and lower (Regions B and D) commissure regions and upper (Regions 1, 2, and 3) and lower (Region 4 and 5) belly regions (Fig. 2, inset). The mean and standard errors of preferred fiber direction and the NOI values were computed each region at each diastolic pressure level. In the unloaded state (0 mmHg transvalvular pressure), the PV had a higher NOI value than the AV in each region analyzed, indicated better fiber alignment in the PV in the stress free state (Fig. 2). Results of this analysis demonstrated that there were distinct differences between the PV and the AV in the commissure regions (Regions A–D).
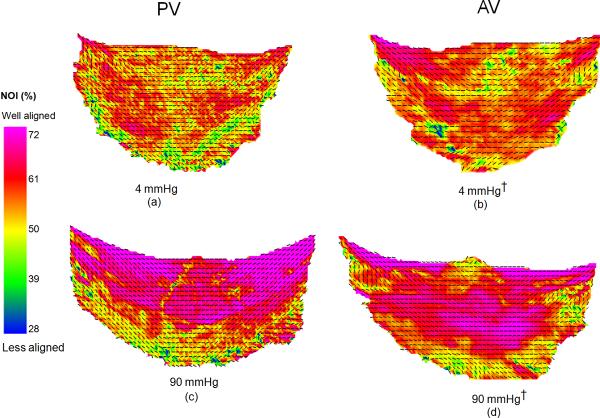
Figure 2.
Collagen fiber architecture maps: (a) PV at 4 mmHg, (b) AV at 4 mmHg, (c) PV at 4 mmHg, and (d) AV at 90 mmHg. There was a drastic improvement in fiber orientation between 4 and 90 mmHg for the PV and minimal improvement in the fiber orientation between 4 and 90 mmHg for the AV. The overall fiber orientation of the PV and the AV was similar at 90 mmHg.
Changes in collagen fiber structure with increasing pressure
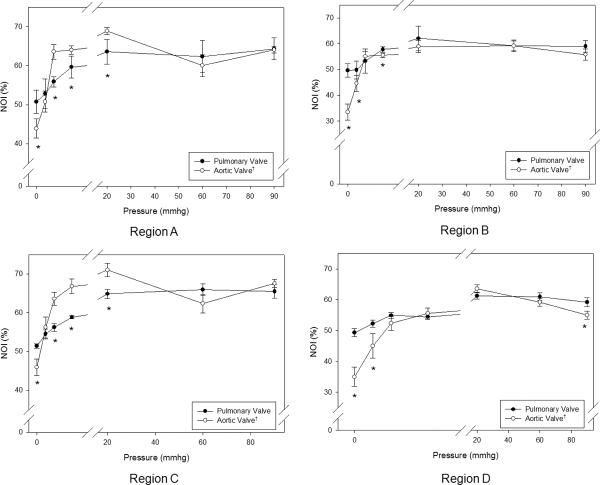
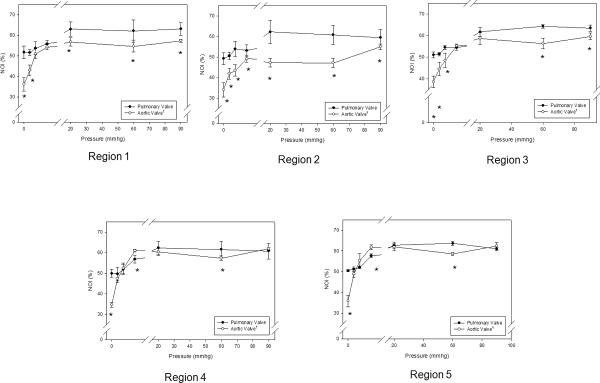
When loaded with sufficient transvalvular pressure to just induce coaptation (~4 mmHg), both valves exhibit a substantial increase in the overall degree of collagen fiber alignment (Figs. 3-a,b). Similarly, at diastolic transvalvular pressure levels (~90 mmHg) both valves exhibited similar increases to collagen fiber alignment (Figs. 3-c,d). When examined regionally, pressure increases lead to the collagen fiber alignment continued to increase up to 20 mmHg for the PV and 4 mmHg for the AV (Fig. 4). The same trends were also found in the upper (Region 1, 3) and lower (Region 4, 5) belly regions of the cusps, and Region 2, except that the AV fiber alignment was lower in this region due to the Nodulus of Aranti (Fig. 5). There was not a statistically significant difference among regions of the PV (p > 0.05); however, there was a significant change in fiber alignment at each pressure level (p < 0.05).
Figure 3.
Regional NOI values for all cusps in the stress-free state, as defined by the upper (A and C) and lower (B and D) commissure regions and upper (1, 2, and 3) and lower (4 and 5) belly regions. Note that Region 2 contained the Nodulus of Aranti. The NOI valves of the PV were consistently higher than those of the AV in both regions. Here, a * indicates a p < 0.05.
Figure 4.
Regional changes (as defined in Figure 3) in NOI values for all commissure regions with transvalvular pressure for both the PV and the AV. The PV had a higher NOI than the AV. The PV displayed gradual realignment up to 20 mmHg, whereas the AV experienced a drastic increase in alignment up to 4 mmHg, and both valve approached approximately the same NOI at 90 mmHg. Region C, Region B, Region C, and Region D all displayed the same trends as Region A. Also, note that for all transvalvular pressures, the paired regions on symmetric sides of the cusps (A–C and B–D) showed approximately the same responses for all pressures.* indicates a p value of < 0.05.
Figure 5.
Regional changes in NOI values for all belly regions with transvalvular pressure of both the PV and the AV experienced an increase in NOI with increased pressure using the regions defined in Figure 3. All belly regions displayed the same trends found in the commissure regions. Region 2 had a lower NOI in the AV due to the Nodulus of Aranti in this region, but the Nodulus of Aranti did not affect Region 2 of the PV. Again, for all transvalvular pressures, the paired regions on symmetric sides of the cusps (1–3 and 4–5) showed approximately the same responses for all pressures. * indicates a p value of < 0.05.
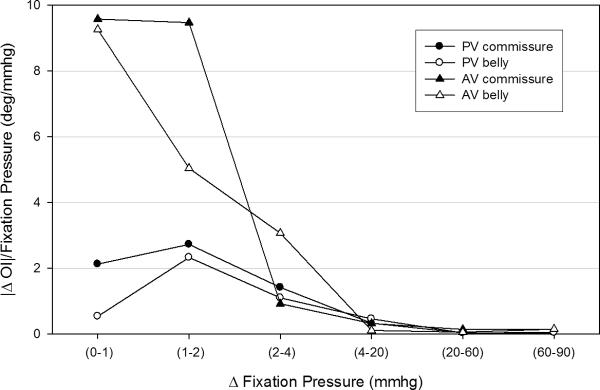
To gain a better understanding of how the AV and PV cuspal fiber architectures adapt to increasing diastolic pressure, the rate of fiber alignment at each pressure level for both commissure and belly regions was computed (Fig. 6). The largest change (over 2 degrees/mmHg) in the PV occurred at the 1–2 mmHg level, where the commissure region aligned slightly faster than the belly region. However, both regions behaved similarly after the 1–2 mmHg level and showed negligible rates of change after 20 mmHg. The largest change (over 8 degrees/mmHg) in the AV occurred at the 0–1 mmHg level, and the commissure and belly regions started out at the same rate of realignment in contrast to the PV. The commissure and belly regions realigned at different rates, with the commissure regions becoming almost fully realigned by 2 mmHg while the belly regions displayed a more gradual realignment with increased pressure. All cuspal regions showed negligible rates of change past 4 mmHg.
Figure 6.
The regional rates of change for the PV and the AV were clearly different. (a) The commissure and belly region of the PV behaved similarly with the largest change (over 2 degrees/mmHg) in the PV occurred at the 1–2 mmHg level and minimal rates of change past 20 mmHg. The largest change (over 8 degrees/mmHg) in the AV occurred at the 0–1 mmHg level. The commissure region realigned at a faster rate than the belly region. There were negligible rates of change in both the commissure and belly region after 4 mmHg.
Changes in collagen fiber crimp with pressure
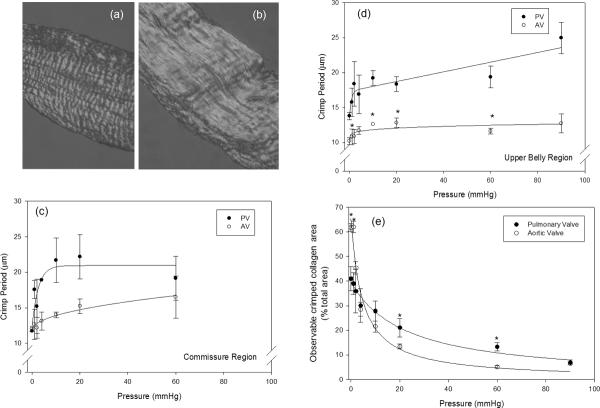
In the stress free state, collagen fibers are highly crimped (Fig. 7-a), and with increasing transvalvular pressure the collagen fibers will straighten (Fig. 7-b). Thus, consistent with a sinusoidal geometry as the transvalvular pressure increases the collagen fibers straighten, so that the collagen crimp period increases and amplitude decreases. Crimp measurements indicated that the commissure and belly regions of both the PV and AV cusps displayed distinct differences (Figs. 7-c,d). In the unloaded state (0 mmHg transvalvular pressure), both PV and AV cusps had similar collagen crimp periods, typically ~12 μm. At subsequent transvalvular pressure levels, the PV demonstrated a more pronounced increase in crimp period as compared to the AV. In contrast after 4 mmHg the increase in crimp period of the AV ceased.
Figure 7.
Representative images of the PV collagen fiber crimp structure (a) at 0mmHg and (b) at 10 mmHg, showing marked fiber straightening crimp with pressure. (c) Changes in crimp presented as the percentage of the total image area at each pressure, showing that the decrease crimp for the PV was gradual, whereas the decrease in the amount of crimp for the AV was drastic between 0 and 4 mmHg. In (d) and (e) are the measured PV and the AV crimp period of the commissure and belly regions, respectively. Between 0 and 20 mmHg and 0 and 4 mmHg of pressure for the PV and the AV, respectively, the undulations continually began to diminish, with minimal change thereafter. (* indicates a p value of < 0.05).
Deeper insight into the changes into the differences in the collagen crimp with transvalvular pressure between the PV and AV cusps were obtained when the percent belly region tissue area displaying crimp structures were compared (Fig. 7-e). This parameter, utilized in bioprosthetic heart valve studies [11], essentially quantifies the number of fibers that are straight at each pressure level. At 0 mmHg there was approximately 40% and 60% of crimp present in the PV and the AV, respectively. That is, about half of the tissue area from both cusps presented visible crimped collagen fibers. Yet, as the transvalvular pressure increased the PV demonstrated a more gradual decrease in the amount of crimp compared to the AV. After 20 mmHg for the PV and AV, most of the crimp had disappeared. By 90 mmHg both valves demonstrated similar values of approximately 6%. Note that in the commissure region, there were no distinct trends and the amount of collagen crimp in under non-zero transvalvular pressures in this region was negligible.
Changes in layer dimensions
In the present study, determining the layer boundary's dimensions proved tractable in the resulting histology images. Increasing pressure caused a decrease in cuspal thickness of the PV and the AV. There was a change in tissue thickness between the low (0–4 mmHg) and the high (10–90 mmHg) pressures (Table 1). Also, change in layer thickness was investigated as a percentage of the total thickness (Table 1). The results suggested that the change in total thickness was a result of the decrease in thickness of the fibrosa and the spongiosa layers. It was evident that the ventricularis thickness did not change with increased pressure. Also, the fibrosa of the AV consisted of approximately 68% of the layer thickness at low pressures, and approximately 63% of the layer thickness at low pressures. This was significantly different from the fibrosa of the PV, which accounted for 43% of the thickness of the cusp at low pressures and 42% of the thickness of the cusp at high pressures.
Table 1.
Total PV and AV layer thickness decreased with increased pressure. Each layer also experienced a decrease in layer thickness. However, only the fibrosa and the spongiosa displayed a statistically significant decrease in thickness. When comparing the percentage of the layer thickness to the total thickness, the fibrosa and spongiosa decreased slightly when exposed to high pressures (10–90 mmHg), but the ventricularis in both the PV and the AV did not change. The fibrosa of the AV was much thicker than the fibrosa of the PV, and the spongiosa and the ventricularis accounted for the same percentage of layer thickness in both the PV and the AV.
| Pressure | Total Thickness (μm) | Fibrosa Thickness (μm) | Spongiosa Thickness (μm) | Ventricularis Thickness (μm) | Fibrosa Thickness/Total Thickness (%) | Spongiosa Thickness/Total Thickness (%) | Ventricularis Thickness/Total Thickness (%) |
|---|---|---|---|---|---|---|---|
| Low Pressures (PV) | 265.7 ± 11.6 | 115.6 ± 4.7 | 88.3 ± 4.1 | 55.8 ± 3.9 | 43.7807 ± 2.2614 | 33.4346 ± 2.0069 | 20.6788 ± 1.3247 |
| High Pressures (PV) | 188.8 ± 8.5 | 80.8 ± 5.1 | 58.7 ± 3.2 | 49.3 ± 1.9 | 42.6070 ± 2.7319 | 31.0071 ± 1.5684 | 26.3860 ± 2.1458 |
| Low Pressures (AV) | 388.7 ± 21.7 | 262.2 ± 18.0 | 81.6 ± 1.0 | 89.9 ± 6.9 | 68.6278 ± 10.6403 | 21.7671 ± 2.3320 | 23.2899 ± 2.5742 |
| High Pressures (AV) | 228.8 ± 9.3 | 142.7 ± 6.9 | 35.8 ± 3.7 | 60.9 ± 6.9 | 63.0517 ± 5.9976 | 15.0023 ± 2.5084 | 26.0279 ± 3.9846 |
Effects of root distension
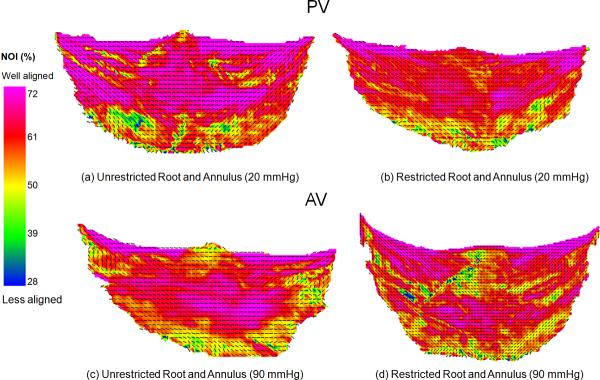
Restricting the root and annulus of both the PV and the AV caused similar changes (Fig. 8). In general, there appeared to be a slight decrease in collagen fiber alignment in both commissural and belly regions of the restricted PV and the AV. Regionally, only Region B was statistically different (p = 0.002) in the PV, and only Region C was statistically significant (p = 0.029) in the AV. Region 2 was almost identical in both the restricted and unrestricted tests.
Figure 8.
(a) Fiber architecture map of unrestricted PV at 20 mmHg of pressure, considered the reference state for the PV. (b) Restricting the pulmonary root and annulus caused minor changes in the fiber architecture. In general, there appeared to be slight decrease in NOI in the restricted PV in both the commissure and belly regions. (c) Fiber architecture map of unrestricted AV at 90 mmHg of pressure. This is considered the reference condition for the AV. (d) Restricting the root and annulus of the AV produced the same trends found in the restricted pulmonary root and annulus. Also note that restricting the root and annulus of the PV and the AV caused an uneven stress distribution on the cusps, which resulted in random alignment of the collagen fibers.
Creep during valve fixation
Over the 24 hour time period, the tissue stretch in both the radial and the circumferential directions were found to be constant during fixation with glutaraldehyde. At 10 mmHg, there was 0.96% stretch in the circumferential direction and a 2.4% stretch in the radial direction over 24 hours, and at 60 mmHg, there was a 2.0% stretch in the circumferential direction and a 0.93% stretch in the radial direction over 24 hours. However, there was no significant amount of creep at 10 mmHg (p = 0.333) or at 60 mmHg (p = 1.000). Also, there is no difference in the amount of creep between each pressure level (p = 0.343). This indicated that there was not a constant deformation as a result of the applied constant load during the tissue fixation period. Thus, the gross collagen fiber architecture measured using SALS represented the effects of instantaneous pressure loading.
DISCUSSION
An improved understanding of the extracellular matrix composition and fiber architecture and its relation to the function of the PV has important clinical implications. The involvement of the PV in a number of forms of congenital heart disease, the ongoing use of the PV as an AV substitute in the Ross procedure, and the potential development of TEPV, and understanding of the abnormal development and function of the PV all required a baseline understanding of the extracellular structure and function of the normal valve. The results of the current study clearly demonstrated important differences between the normal porcine PV and AV, and provided a new understanding of the differences in how these two semi-lunar valves responded to similar hemodynamic loading conditions.
Collagen fiber architecture of the PV and the AV cusps
While the PV and the AV had similar overall fiber architecture, they also exhibited distinct differences that likely have functional importance. The PV collagen fiber network was more aligned at 0 mmHg than the AV and exhibited relatively homogenous collagen fiber architecture over the whole cusp in the stress free state (Fig. 1). In contrast, the AV exhibited higher collagen fiber alignment in the region of coaptation, along with low but also variable alignment in the upper and lower commissure and belly regions (Fig. 1).
Expectedly, all regions of the PV and the AV experienced an increase in collagen fiber alignment with increased pressure (Figs. 4,5). Yet, each region of the PV consistently had better fiber alignment than the AV at each pressure level. The PV ceased to increase fiber alignment after 20 mmHg, whereas the AV ceased fiber alignment after 4 mmHg. Interestingly, the collagen fiber architectures of the PV and the AV were similar at high pressures (60 and 90 mmHg, Figs. 4,5), lending support to the use of the PV ability to support systemic pressure levels. Yet, despite these similarities, the rate of fiber alignment of the PV and the AV displayed important differences (Fig. 6). Overall, the rate of fiber alignment in the PV was a more gradual process compared to the AV. The largest change in the PV occurred at the 1–2 mmHg level as opposed to the 0–1 mmHg level in the AV. The commissure and belly regions of the PV behaved similarly as opposed to those of the AV, with negligible change after 20 mmHg and 4 mmHg, respectively. The differences suggest that the AV and PV respond differently to pressure loading, mainly in the rate of alignment.
Crimp period
At 0 mmHg, ~40% of the area of the PV and ~60% of the area of the AV was occupied by visible crimp structures (Fig. 7-a). while by 90 mmHg, only 6% of the crimp structure was present in both the cusps. Also, both the commissure and belly regions of the PV and the AV experienced an increase in crimp period with increased pressure (Fig. 7). In the stress free state, the fiber structure was highly crimped throughout most of the cusp. After 20 mmHg (PV) and 4 mmHg (AV), there was negligible change in crimp period, and by 90 mmHg, most of the collagen crimp had diminished. Collectively, these results suggest that the PV's more gradual change in crimp period is an adaptive design to its functional demands, yet also demonstrates how the PV could sufficiently operate in the AV position.
Effects on layer dimensions
There was a change in cuspal layer thickness between the low (0–4 mmHg) and the high (10–90 mmHg) pressure ranges of both the PV and the AV (Table 1). The fibrosa and the spongiosa experienced a small decrease in layer thickness, but the ventricularis did not change in thickness due to its elastin constituent (Table 1). The glycosaminoglycans of the spongiosa were compressed and water content might be expelled, which possibly contributed to the significant decrease in total thickness of both the PV and the AV at higher pressures. The fibrosa of the AV was proportionally thicker than the fibrosa of the PV with the spongiosa and ventricularis accounting for approximately the same percentage of layer thickness in the PV and the AV (Table 1). The increase in fibrosa thickness in the AV is likely the result of the high pressures that the AV experiences. With increased pressure, the AV may need to increase collagen content in order to properly support the increased stress. It has been demonstrated that the ventricularis layer supports stresses in the radial direction, but the circumferentially oriented collagen fibers of the fibrosa dominated the stress-strain response of the cusp [3, 26]. Thus, the increased fibrosa layer thickness was a result of increased collagen production of the AV's extracellular matrix in response to increased pressures.
Relation to cuspal tissue biomechanics
It has been previously reported that under 60 N/m equibiaxial tension (i) the radial and circumferential strains of fresh PV cusps were 90.3 ± 5.7% and 10.0 ± 1.9%, respectively; (ii) For fresh AV cusps, corresponding radial and circumferential strains were 74.5 ± 7.8% and 12.4 ± 1.8%, respectively [5]. These results can be explained by our structural findings. Specifically, the small changes in collagen fiber alignment (Fig. 5,6) and crimp area (Fig. 9) for the PV together suggest that the PV collagen fibers straighten faster when the valve is loaded. This is consistent with lower circumferential strains found for the PV as noted above. Moreover, our observations suggest that the PV collagen fiber network has less structural reserve compared to the AV.
Effects of restriction of pulmonary and aortic root
The mechanical properties of pulmonary artery and the aorta may have affected the observed changes. It is believed that a pressurized root (diastolic state) retained the root geometry in such a way that it provided improved outflow [1], [34] and an increased orifice area [16], [34]. Also, the proper root geometry aided in synchronous cusp opening, while reducing the amount of strain in the commissure region [4], [34]. It was also shown that dilation of the aortic root transferred stress to the valve cusps, increasing collagen fiber orientation [34]. Restricting the pulmonary root and annulus caused slight changes (Fig. 12). In general, there appeared to be a slight decrease the alignment of the collagen fibers for all regions in the restricted PV and the AV (Fig. 12-b,d). These results are in corroboration with the previous studies [34]. Although there was not a statistically significant difference between the restricted and unrestricted root and annulus, the distention of the root and annulus do play a minor role in the increased collagen fiber orientation. Restricting the root and annulus of the PV and the AV also caused an uneven stress distribution on the cusps, which resulted in random alignment of the collagen fibers. Therefore, the dilation of the pulmonary root was important in achieving optimum fiber behavior. It can be concluded that the collagen fiber behavior was a function of both pressure and root/annulus dilation.
Study Limitations
Porcine PVs and AVs were used throughout this study as opposed to human valves and differences exist between species. However, human and porcine valves show remarkable anatomical similarities and have similar overall physiological function. Consequently, our results presented herein for the porcine PV and AV are representative. Also, note that our morphological study is limited to 2 dimensions, since 3 dimensional information was not available at the time of this study.
Summary
At aortic pressures (90 mmHg), the PV and the AV achieved similar fiber architectures, lending support for the use of the PV as a replacement for a diseased AV. However, this study also underscored important differences in the PV architecture that may lay the basis for the PV's inherent limitations in the AV position. A decrease in crimp amplitude was the predominant mechanism for the differences in the collagen fiber architecture between the valves. The AV cusp demonstrated greater regional variations and changes in collagen structure with applied transvalvular pressure. Overall, the AV collagen fiber network demonstrated greater ability to respond to applied transvalvular pressure. Furthermore, this study can guide development of the TEPV by establishing the functional architecture of the valve “design endpoint.”
ACKNOWLEDGEMENTS
This work is supported by NIH grant R01 HL 68816. JL was supported by a Beginning Grant-in-Aid (0565346U) from the American Heart Associate (Pennsylvania/Delaware Affiliate). The authors would like to thank Mr. Brett Zubiate for help with the testing device and Mr. Greg Fulchiero for his help in developing the methodology for calculation of collagen fiber crimp.
REFERENCES
- 1.Barratt-Boyes BG, Christie GW, Raudkivi PJ. The stentless bioprosthesis: surgical challenges and implications for long-term durability. Eur J Cardiothorac Surg. 1992;6(Suppl 1):S39–42. discussion S43. [PubMed] [Google Scholar]
- 2.Billiar KL, Sacks MS. Biaxial mechanical properties of the natural and glutaraldehyde treated aortic valve cusp--Part I: Experimental results. Journal of Biomechanical Engineering. 2000a;122(1):23–30. doi: 10.1115/1.429624. [DOI] [PubMed] [Google Scholar]
- 3.Broom N, Christie GW. The Structure/Function Relationship of Fresh and Gluteraldehyde-Fixed Aortic Valve Leaflets. In: Cohn LH, Gallucci V, editors. Cardiac Bioprosthesis. Yorke Medical Books; New York: 1982. pp. 477–491. [Google Scholar]
- 4.Butterfield M, Fisher J, Davies GA, Kearney JM. Leaflet geometry and function in porcine bioprostheses. Eur J Cardiothorac Surg. 1991;5(1):27–32. doi: 10.1016/1010-7940(91)90079-y. discussion 33. [DOI] [PubMed] [Google Scholar]
- 5.Christie GW, Barratt-Boyes BG. Mechanical properties of porcine pulmonary valve leaflets: how do they differ from aortic leaflets? Ann Thorac Surg. 1995;60(2 Suppl):S195–9. doi: 10.1016/0003-4975(95)00279-t. [DOI] [PubMed] [Google Scholar]
- 6.Concha M, Aranda PJ, Casares CM, et al. The Ross Procedure. Journal of Cardiovascular Surgery. 2004;19(4):401–409. doi: 10.1111/j.0886-0440.2004.04080.x. [DOI] [PubMed] [Google Scholar]
- 7.Forbess JM, Shah AS, St. Louis JD, et al. Determinants of duribility. Ann Thorac Surg. 2001;71:54. doi: 10.1016/s0003-4975(00)01788-4. [DOI] [PubMed] [Google Scholar]
- 8.Fung YC. Biomechanics: Mechanical Properties of Living Tissues. 2nd ed. Springer Verlag; New York: 1993. p. 568. [Google Scholar]
- 9.Hammermeister K, Sethi G, Henderson W, Oprian C, Kim T, Rahimtoola SH. A comparison of outcomes in men 11 years after heart-valve replacement with a mechanical valve or bioprosthesis. New England Journal of Medicine. 1993;18:1289–1296. doi: 10.1056/NEJM199305063281801. [DOI] [PubMed] [Google Scholar]
- 10.Hammermeister K, Sethi GK, Henderson WG, Grover FL, Oprian C, Rahimtoola SH. Outcomes 15 years after valve replacement with a mechanical versus a bioprosthetic valve: final report of the Veterans Affairs randomized trial. J Am Coll Cardiol. 2000;36(4):1152–8. doi: 10.1016/s0735-1097(00)00834-2. [DOI] [PubMed] [Google Scholar]
- 11.Hilbert SL, Barrick MK, Ferrans VJ. Porcine aortic valve bioprostheses: A morphologic comparison of the effects of fixation pressure. Journal of Biomedical Materials Research. 1990;24:773–787. doi: 10.1002/jbm.820240611. [DOI] [PubMed] [Google Scholar]
- 12.Iyengar AKS, Sugimoto H, Smith DB, Sacks MS. Dynamic in vitro quantification of bioprosthetic heart valve leaflet motion using structured light projection. Ann Biomed Eng. 2001;29(11):963–73. doi: 10.1114/1.1415523. [DOI] [PubMed] [Google Scholar]
- 13.Junqueira LC, Bignolas G, Brentani RR. Picrosirius staining plus polarization microscopy, a specific method for collagen detection in tissue sections. Histochem J. 1979;11(4):447–55. doi: 10.1007/BF01002772. [DOI] [PubMed] [Google Scholar]
- 14.Kollar A, Hartyanszky I. External subcommissural annuloplasty to prevent regurgitation in the pulmonary autograft. Interactive Cardiovascular and Thoracic Surgery. 2003;2:183–185. doi: 10.1016/S1569-9293(03)00030-6. [DOI] [PubMed] [Google Scholar]
- 15.Lansac E, Lim HS, Shomura Y, Lim KH, Goetz W, Rice NT, Acar C, Duran CMG. Aortic and pulmonary root: are their dynamics similar? European Journal of Cardio-thoracic Surgery. 2002;21:268–275. doi: 10.1016/s1010-7940(01)01132-0. [DOI] [PubMed] [Google Scholar]
- 16.Lockie KJ, Fisher J, Juster NP, Davies GA, Watterson K. Biomechanics of glutaraldehyde-treated porcine aortic roots and valves. An investigation of the effect of predilation of the elastic aortic root. J Thorac Cardiovasc Surg. 1994;108(6):1037–42. [PubMed] [Google Scholar]
- 17.Mayne AS, Christie GW, Smaill BH, Hunter PJ, Barratt-Boyes BG. An assessment of the mechanical properties of leaflets from four second- generation porcine bioprostheses with biaxial testing techniques [see comments] J Thorac Cardiovasc Surg. 1989;98(2):170–80. [PubMed] [Google Scholar]
- 18.Sacks MS. Small-angle light scattering methods for soft connective tissue structural analysis. Encyclopedia of Biomaterials and Biomedical Engineering. 2004 [Google Scholar]
- 19.Sacks MS, Smith DB, Hiester ED. A small angle light scattering device for planar connective tissue microstructural analysis. Ann Biomed Eng. 1997;25(4):678–89. doi: 10.1007/BF02684845. [DOI] [PubMed] [Google Scholar]
- 20.Sacks MS, Smith DB, Hiester ED. The aortic valve microstructure: effects of transvalvular pressure. Journal of Biomedical Materials Research. 1998;41(1):131–41. doi: 10.1002/(sici)1097-4636(199807)41:1<131::aid-jbm16>3.0.co;2-q. [DOI] [PubMed] [Google Scholar]
- 21.Schoen F. Aortic valve structure-function correlations: Role of elastic fibers no longer a stretch of the imagination. Journal of Heart Valve Disease. 1997;6:1–6. [PubMed] [Google Scholar]
- 22.Schoen F, Levy R. Tissue heart valves: Current challenges and future research perspectives. Journal of Biomedical Materials Research. 1999;47:439–465. doi: 10.1002/(sici)1097-4636(19991215)47:4<439::aid-jbm1>3.0.co;2-o. [DOI] [PubMed] [Google Scholar]
- 23.Smerup M, Pedersen TF, Nyboe C, Funder JA, Christensen TD, Nielsen SL, Hjortdal V, Hasenkam JM. A long-term porcine model for evaluation of prosthetic heart valves. Heart Surg Forum. 2004;7(4):E259–64. doi: 10.1532/HSF98.20041015. [DOI] [PubMed] [Google Scholar]
- 24.Stark J. The use of valved conduits in pediatric cardiac surgery. Pediatr Cardiol. 1998;19(4):282–8. doi: 10.1007/s002469900311. [DOI] [PubMed] [Google Scholar]
- 25.Stark J, Bull C, Stajevic M, et al. Fate of subpulmonary homograft conduits: Determinants of late homograft failure. J Thorac Cardiovasc Surg. 1998;115:506. doi: 10.1016/S0022-5223(98)70312-5. [DOI] [PubMed] [Google Scholar]
- 26.Stella JA, Sacks MS. On the biaxial mechanical properties of the layers of the aortic valve leaflet. J Biomech Eng. 2007;129(5):757–66. doi: 10.1115/1.2768111. [DOI] [PubMed] [Google Scholar]
- 27.Stradins P, Lacis R, Ozolanta I, Purina B, Ose V, Feldmane L, Kasyanov V. Comparison of biomechanical and structural properties between human aortic and pulmonary valve. Eur J Cardiothorac Surg. 2004;26(3):634–9. doi: 10.1016/j.ejcts.2004.05.043. [DOI] [PubMed] [Google Scholar]
- 28.Thubrikar M. The Aortic Valve. CRC; Boca Raton: 1990. p. 221. [Google Scholar]
- 29.Tzaphlidou M. The Effects of Fixation by Combination of Glutaraldehyde/Dimethyl Suberimidate. The Journal of Histochemistry and Cyochemistry. 1983;31(11):1274–1278. doi: 10.1177/31.11.6194203. [DOI] [PubMed] [Google Scholar]
- 30.Vesely I, Casarotto DC, Gerosa G. Mechanics of cryopreserved aortic and pulmonary homografts. J Heart Valve Dis. 2000;9(1):27–37. [PubMed] [Google Scholar]
- 31.Vesely I, Macris N, Dunmore PJ, Boughner D. The distribution and morphology of aortic valve cusp lipids. J Heart Valve Dis. 1994;3(4):451–6. [PubMed] [Google Scholar]
- 32.Vongpatanasin W, Hillis LD, Lange RA. Prosthetic heart valves. N Engl J Med. 1996;335(6):407–16. doi: 10.1056/NEJM199608083350607. [DOI] [PubMed] [Google Scholar]
- 33.Wells SM, Sacks MS. Effects of fixation pressure on the biaxial mechanical behavior of porcine bioprosthetic heart valves with long-term cyclic loading. Biomaterials. 2002;23(11):2389–99. doi: 10.1016/s0142-9612(01)00375-1. [DOI] [PubMed] [Google Scholar]
- 34.Wells SM, Sellaro T, Sacks MS. Cyclic loading response of bioprosthetic heart valves: effects of fixation stress state on the collagen fiber architecture. Biomaterials. 2005;26(15):2611–9. doi: 10.1016/j.biomaterials.2004.06.046. [DOI] [PubMed] [Google Scholar]
- 35.Woo SLY, Orlando CA, Camp JF, Akeson WH. Effects of Postmortem Storage by Freezing on Ligament Tensile Behavior. Journal of Biomechanics. 1994;19:399–404. doi: 10.1016/0021-9290(86)90016-3. [DOI] [PubMed] [Google Scholar]
- 36.Xu X, Wang RK. The role of water desorption on optical clearing of biotissue: studied with near infrared reflectance spectroscopy. Medical Physics. 2003;30(6):1246–53. doi: 10.1118/1.1576228. [DOI] [PubMed] [Google Scholar]
- 37.Yu X, Cheng M, Chen H. Methods for the pre-treatment of biological tissues for vascular scaffold. Journal of Biomechanical Engineering. 2004;31(3):476–81. [PubMed] [Google Scholar]


