Abstract
As recently shown, ultramicroscopy (UM) allows 3D-visualization of even large microscopic structures with µm resolution. Thus, it can be applied to anatomical studies of numerous biological and medical specimens. We reconstructed the three-dimensional architecture of tomato-lectin (Lycopersicon esculentum) stained vascular networks by UM in whole mouse organs. The topology of filigree branches of the microvasculature was visualized. Since tumors require an extensive growth of blood vessels to survive, this novel approach may open up new vistas in neurobiology and histology, particularly in cancer research.
Key words: 3D-reconstruction, blood vessels, cancer, LEA, lectin, microvasculature, morphology, ultramicroscopy, whole mount
Introduction
Various novel microscopical techniques have given new impulses to biological sciences in the last decades. One of these new imaging technique is ultramicroscopy (UM), which recently has been shown to allow three-dimensional reconstructions of even cm-sized specimen with micrometer resolution.1–3 Thus, UM bridges a gap between confocal microscopy and macroscopic imaging techniques like computer tomography (CT), making it a versatile tool for anatomical studies of numerous biological and medical specimens.
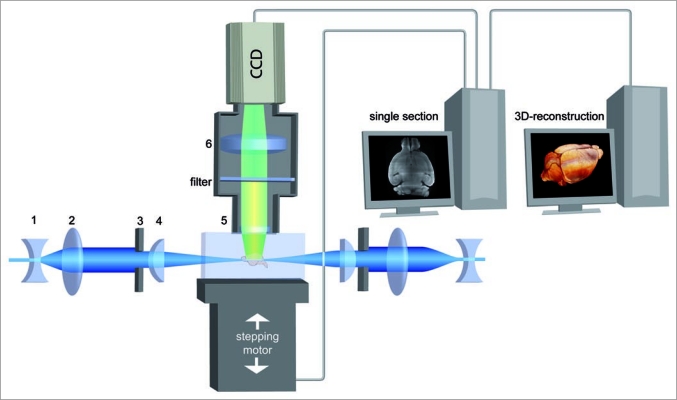
In UM, the specimen is illuminated perpendicular to the observation pathway by a very thin sheet of laser light, formed by optical elements (Fig. 1). Because illumination of out of focus layers is avoided in UM, no light has to be excluded by a pinhole later on, like in confocal microscopy. By stepping the specimen chamber vertically through the laser light sheet optical sectioning is obtained. Since in UM the light has to travel horizontally along the whole width of a specimen, it is necessary that specimens are sufficiently transparent. This is achieved by a chemical clearing procedure, which is based on replacing the water in the specimen by a liquid having approximately the same refractive index as protein. As a consequence, light scattering is strongly reduced, and the specimen becomes translucent.4
Figure 1.
Principle of UM. A transparent specimen is illuminated perpendicular to the observation pathway by a laser forming a thin sheet of light. Concave lens (1), convex lens (2), slit aperture (3), cylindrical lens (4). Thus, fluorescent light is only emitted by a thin plane and no out of focus light has to be excluded by a pinhole like in confocal microscopy. The emitted fluorescence light is projected to a camera target by an objective, while the excitation light is blocked by a matched optical filter. Objective (5), tube lens (6). By moving the specimen chamber through the light sheet a stack of images is obtained. Afterwards, a 3D-reconstruction is calculated by software.
Lectins are proteins that highly specifically bind to sugar complexes, attached to proteins and lipids.5 Presently, lectins are widely used in research, particular in serology, drug targeting and histopathology. In the recent decade, lectins became especially important as markers for microvascular labeling.6–9
Using UM, we three-dimensionally reconstructed several millimeter sized microvascular networks in whole mouse organs. The endothelial cells were labeled using tomato lectin from Lycopersicon esculentum (LEA), conjugated with a fluorescent dye (FITC).
Results and Discussion
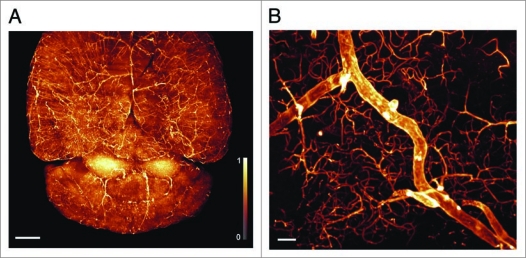
We imaged lectin labeled mouse brains by UM and computed three-dimensional reconstructions from the obtained image stacks according to Becker, Jährling et al.2 Figure 2A shows a top view of the brain hemispheres and the cerebellum. As can be seen from the figure, even the finest branches of the microvascular network are visualized. The major vessels generally show less staining. Figure 2B depicts a single cortical blood vessel, surrounded by complexly branched capillaries.
Figure 2.
3D-reconstructions of vascularization in mouse brains. (A) Top-view of the brain in maximum intensity projection (MIP) (Olympus objective XL-Fluar 2×, N.A. 0.14, reconstructed from 567 images, 2,048 × 2,048 pixel), scale bar 1 mm. (B) Single cortical blood vessel surrounded by complexly branched capillaries (Olympus objective UPlanFL N 10×, N.A. 0.30, reconstructed from 191 images, 2,048 × 2,048 pixel), scale bar 30 µ m. Monochrome images were transposed into false colors using the color map shown at the left side of (A).
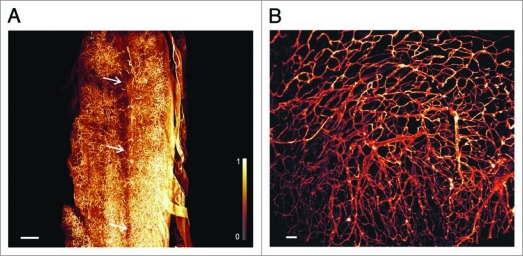
We also obtained three-dimensional images from the spinal cord (Fig. 3A), and of the auricles of the heart (Fig. 3B). In the 3D-reconstructions of the spinal cord some of the thin capillaries supporting the spinal nerves are apparent. The spinal canal (Canalis spinalis) is visible. In its center any vascularization is clearly completely lacking. The reconstructions of the heart (Fig. 3B) illustrate the microvascular architecture in the cardiac auricle (Auricula atrii), formed by close loops of capillaries.
Figure 3.
3D-reconstruction of vascularization in spinal cord, and cardiac auricles. (A) Microvasculature of mouse spinal cord. Some of the thin capillaries supporting the spinal nerves are apparent. The spinal canal (Canalis spinalis) is clearly defined by its complete lack of vessels. Its position is indicated by the three arrows. (Olympus objective XLFluar 4×, N.A. 0.28, reconstructed from 610 images, 2,048 × 2,048 pixel). Image stack was deconvolved with Huygens (SVI, Hilversum, Netherlands) using a measured point spread function. Scale bar 400 µ m. (B) Reconstruction of the microvascular architecture in the cardiac auricle (Auricula atrii). (Olympus objective UPlanFL N 10×, N.A. 0.3, reconstructed from 199 images, 2,048 × 2,048 pixel), scale bar 50 µm. Monochrome images were transposed into false colors using the color map shown at the left side of (A).
UM of lectin-FITC labeled tissue enables three-dimensional imaging of vast vascular networks in whole mouse organs like brain, spinal cord, or heart. Compared to other lectins, LEA has the advantage to produce only minimal parenchymal staining, since it does not bind to the parenchyma cells or to the extracellular matrix.10 This is an essential requirement for quantitative morphometric analysis of vasculature.8 The labeling technique by LEA can also successfully be applied to muscles and other organs.8
As already reported by Porter et al. we found that LEA mainly labels the endothelium of capillaries, while the staining of larger branches is less intense.10 Perhaps, this limitation may be overcome by intravenous in vivo injection of LEA, directly into the circulatory system shortly before preparation. This may allow a prolonged contact between LEA and endothelial glycocalyx. On the other hand, it may be possible that the less pronounced staining is due to a reduced number of LEA binding sides in larger vessels. Lectin staining can be easily combined with other labeling techniques, or be used in XFP transgenic mice.
Ultramicroscopy is closely related to a growing family of similar microscopy approaches. They include single plane illumination microscopy (SPIM), orthogonal-plane fluorescence optical sectioning (OPFOS), and a fast growing number of further variations of the same principle.11 They all have in common that they are based on the 100 years old idea of light sheet illumination, developed by Siedentopf and Zigmondy once termed ultramicroscopy.13 While SPIM was developed for imaging small living specimens, like zebrafish or Drosophila embryos embedded in agar, UM was designed for large fixed and chemically cleared fluorescent specimens, like GFP expressing mouse brains, organs, or embryos. Another difference to SPIM is that in UM the specimen is illuminated by two vertically aligned counter propagating laser light sheets (Fig. 1). This gives directly a more even illumination especially in large specimens. Since the specimen is not rotated in the light sheet as in SPIM, standard software developed for confocal microscopy can be used for 3D reconstruction. As UM works in contrast to SPIM with a vertical orientation of the optical detection pathway, it can be easily adapted to standard upright or inverted microscopes.
Three dimensional reconstructions of microvascular structures as presented in Figure 2 are impossible to obtain with conventional histological techniques as mechanical sectioning by a microtome. This is due to unavoidable mechanical distortions by the microtome knife, which make the appropriate spatial alignment of hundreds of single sections a nearly unsolvable problem. Since in UM mechanical slicing is substituted by optical slicing, this drawback is completely eliminated. Standard confocal microscopy is limited to specimen sizes of a few hundred micrometers. Therefore it is also not applicable for 3D-reconstruction of large specimen like whole mouse organs and blood vessel networks. Since tumors require an extensive growth of blood vessels to survive, and thus detailed morphological studies of the 3D structure microvasculature are crucial in cancer research, our approach may open up new vistas in this field of research.
Materials and Methods
Six week old mice (Bl6) were killed by CO2 and perfused transcardically with 5 ml PB and heparin for rinsing the blood out of the vessels until the fluid became clear. Afterwards, we perfused with 10 ml 1% Paraformaldehyd (PFA). All animal preparation procedures were performed according to the regulations of the Austrian animal-care committee. In a next step, 10 ml FITC-Lectin (10 µg FITC-Lectin per ml PB) from Lycopersicon esculentum (Sigma-Aldrich, L0401), specific for N-acetyl-D-glucosamine and N-acetyl-polylactosamine oligomers, was perfused.10,11 After 2 min incubation further 30 ml 4% PFA were perfused. We removed the brains from the scull and incubated them in 4% PFA at 4°C for 4 hours. Afterwards, they were rinsed 3 times in PBS. For adult mice the volume of the fluids should be doubled. We dehydrated the organs using an ascending ethanol series (50%, 80%, 96%, 100%). Then, the organs were cleared in a solution containing 2 part benzyl benzoate and 1 part benzyl alcohol (BABB).
For UM, we used the setup described in Becker, Jährling et al.2 3D-reconstruction was carried out with the 3D-reconstruction software Amira 5.2 (Visage Imaging, San Diego, USA).
For optimal resolution, the data underlying Figure 3A were deconvolved by Huygens deconvolution software (Huygens, Hilversum, Netherlands) using an empirically determined point spread function (PSF). The PSF was determined by imaging sub resolution sized fluorescent latex beads of 1 µm diameter (Invitrogen, Oregon, USA).
Supplementary Material
Acknowledgements
This study was supported by SFB 391 and the Hertie Foundation.
Footnotes
Previously published online: www.landesbioscience.com/journals/organogenesis/article/10403
References
- 1.Dodt HU, Leischner U, Schierloh A, Jährling N, Mauch CP, Deininger K, et al. Ultramicroscopy: three-dimensional visualization of neural networks in the whole mouse brain. Nat Methods. 2007;4:331–336. doi: 10.1038/nmeth1036. [DOI] [PubMed] [Google Scholar]
- 2.Becker K, Jährling N, Kramer ER, Schnorrer F, Dodt HU. Ultramicroscopy: 3D-reconstruction of large microscopic specimens. J Biophoton. 2008;1:36–42. doi: 10.1002/jbio.200710011. [DOI] [PubMed] [Google Scholar]
- 3.Jährling N, Becker K, Kramer ER, Dodt HU. 3D-Visualization of nerve fiber bundles by ultramicroscopy. Med Laser Application. 2008;23:209–215. [Google Scholar]
- 4.Spalteholz W. Über das Durchsichtigmachen von menschlichen und tierischen Präparaten. Leipzig: Hierzel S, Leipzig; 1914. (Ger). [Google Scholar]
- 5.Bies C, Lehr CM, Woodley JF. Lectin-mediated drug targeting: history and applications. Advances Drug Delivery Reviews. 2004;56:425–435. doi: 10.1016/j.addr.2003.10.030. [DOI] [PubMed] [Google Scholar]
- 6.Thurston G, Murphy TJ, Baluck P, Lindsey JR, McDonald DM. Angiogenesis in mice with chronic airway inflammation. AJP. 1998;153:1099–1112. doi: 10.1016/S0002-9440(10)65654-4. [DOI] [PMC free article] [PubMed] [Google Scholar]
- 7.Ezaki T, Baluck P, Thurston G, Barbara AL, Woo C, McDonald DM. Time course of endothelial cell proliferation and microsvascular remodelling in chronic inflammation. AJP. 2001;158:2043–2055. doi: 10.1016/S0002-9440(10)64676-7. [DOI] [PMC free article] [PubMed] [Google Scholar]
- 8.Mazetti S, Frigerio S, Gelati M, Salmaggi A, Vitellaro-Zuccarello L. Lycopersicon esculentum lectin: an effective and versatile endothelial marker of normal and tumoral blood vessels in the central nervous system. Europ J of Histochem. 2004;48:423–428. doi: 10.4081/916. [DOI] [PubMed] [Google Scholar]
- 9.Dickie R, Bachoo RM, Rupnick MA, Dallabrida SM, Deloid GM, Lai J, et al. Three-dimensional visualization of microvessel architecture of whole-mount tissue by confocal microscopy. Microsvas Res. 2006;72:20–26. doi: 10.1016/j.mvr.2006.05.003. [DOI] [PubMed] [Google Scholar]
- 10.Porter GA, Palade GE, Milici AJ. Differential binding of the lectins Griffonia simplicifolia I and Lycopersicon esculentum to microvascular endothelium: organ specific localization and partial glycoprotein characterization. Eur J Cell. 1990;51:85–95. [PubMed] [Google Scholar]
- 11.Kawashina H, Sueyoshi S, Li H, Yamaoto K, Osawa T. Carbohydrate binding specificities of several poly-N-acetyllactosamine-binding lectins. Glycoconj J. 1990;7:323–334. doi: 10.1007/BF01073376. [DOI] [PubMed] [Google Scholar]
- 12.Huisken J, Stainier DYR. Selective plane illumination microscopy techniques in developmental biology. Development. 2009;136:1963–1975. doi: 10.1242/dev.022426. [DOI] [PMC free article] [PubMed] [Google Scholar]
- 13.Siedentopf H, Zsigmondy R. Über Sichtbarmachung und Grössenbestimmung ultramikroskopischer Teilchen, mit besonderer Anwendung auf Goldrubingläser. Ann Phys. 1903;10:1–39. (Ger). [Google Scholar]
Associated Data
This section collects any data citations, data availability statements, or supplementary materials included in this article.


