

Abstract
Nucleus accumbens (NAc) inactivation increases food intake, indicating that NAc neurons exert ongoing inhibition of feeding. We previously described a subpopulation of NAc neurons that pause during sucrose licking and proposed that the pause permits consumption. We tested this hypothesis by first recording NAc neurons during sucrose consumption, and then electrically stimulating through the same electrodes. A large proportion of NAc shell and core neurons were inhibited during sucrose consumption, and local electrical stimulation abruptly interrupted licking. Effective stimulation sites were more anterior than ineffective sites in NAc. At low stimulus intensities, licking resumed immediately on stimulation offset. The latency to lick resumption from NAc neuron inhibition onset (∼460 ms) was very similar to that after electrical stimulation offset (∼440 ms). These results directly support the hypothesis that a significant subpopulation of NAc neurons inhibit palatable food consumption and that a pause in their firing is required to initiate and maintain consumption.
Introduction
The nucleus accumbens (NAc) is part of a neural circuit governing consumption of palatable food (Kelley et al., 2005b). Inhibition of NAc neurons by either local injection of the GABAA receptor agonist muscimol (Stratford and Kelley, 1997; Basso and Kelley, 1999; Stratford et al., 1999; Reynolds and Berridge, 2001, 2002), the GABAB agonist baclofen (Stratford and Kelley, 1997), or blockade of AMPA and kainate glutamate receptors (Maldonado-Irizarry et al., 1995; Kelley and Swanson, 1997; Stratford et al., 1998) significantly increases food (but not water) intake in satiated rats. Conversely, activation of AMPA receptors in the NAc shell reduces food intake in food-restricted rats (Stratford et al., 1998). These pharmacological manipulations are most effective in the medial NAc shell subregion, which is directly interconnected with sites in the lateral hypothalamus (LH) critical for arousal and feeding (Mogenson et al., 1983; Heimer et al., 1991; Kelley et al., 2005a).
We previously reported that a subset of NAc neurons (∼30%) show inhibitions that start immediately before the onset of sucrose consumption (Taha and Fields, 2005). These inhibitions persist during approach and consumption but do not occur during locomotion unrelated to consumption (Taha and Fields, 2006). Importantly, although some authors have interpreted NAc neuronal inhibitions as encoding reward (Roitman et al., 2005; Carlezon and Thomas, 2008), we found that the magnitude of the firing rate decrease during approach and consumption did not track sucrose concentration. Furthermore, the inhibition in these neurons typically began before sucrose consumption; further dissociating the inhibitions from reward magnitude. In fact, the firing pattern of this type of NAc neuron is more consistent with a role in the initiation and maintenance of appetitive and consummatory behaviors, including licking. We further proposed that pharmacological inactivation of the NAc removes the activity in these neurons that tonically inhibits feeding behavior (Taha and Fields, 2006).
If decreased firing in a subpopulation of NAc neurons is required for initiation and maintenance of feeding, then experimentally exciting these neurons during consumption should disrupt feeding. To directly test this hypothesis, we implanted multiple microwire electrodes in the rat striatum and nucleus accumbens to record and map the location of single neurons and then electrically stimulate at the same sites. This allowed us to rapidly and reversibly activate regions containing neurons that pause before feeding and to provide direct evidence that restoring firing in these neurons interrupts sucrose consumption.
Results of this study were published in abstract form (Krause et al., 2009).
Materials and Methods
Animals and surgical procedures
Male Long–Evans rats (body weight, 350–480 g; n = 20; Charles River Laboratories) were housed individually and kept on a 12 h light/dark cycle (lights off from 8:00 P.M. to 8:00 A.M.), and tested during the light phase. During the entire study, rats were food restricted to maintain their 95% ad libitum body weight (ascertained during 1 week of ad libitum food and water after arrival in the colony). Food was given after the testing session at the end of the light period. Water was available at all times in the rats' home cages. Before surgery, rats underwent 5–10 behavioral training sessions in which they learned the task in three paradigms with successive difficulty (described below, Behavior). Anesthesia during surgery was induced and maintained with isoflurane (1.5–2%; flow rate, 1.5 L/min). An incision was made along the midline of the skull, and craniotomies were made bilaterally. After removal of the dura mater, one eight-wire electrode array (NB Labs) was implanted in each hemisphere and fixed to the skull with six to eight bone screws and dental acrylic. A silver wire for each array acting as electrical ground was inserted posterior to the recording site [all in millimeters; anteroposterior (AP), −4.0; mediolateral (ML), 2–3; dorsoventral (DV), ∼4]. We implanted rats at different locations (all in millimeters, relative to bregma): dorsal striatum (AP, 0.5–2.2; ML, 1.5–3; DV, 4.5–6.5), NAc (AP, 0.5–2.2; ML, 0.5–3; DV, 6.5–8), and olfactory tubercles (AP, 0.5–1.8; ML, 1–2; DV, 8–9). Electrode arrays were composed of Teflon-coated stainless-steel wires (Ø, 50 μm) with the tip exposed and arranged as either 2 × 4 or 1 × 8 geometry. The distance between electrodes was ∼250 μm. Sixteen rats were implanted with fixed arrays, and in four rats the array of eight wires was movable along the DV axis, covering a total travel distance of ∼3 mm. All studies were approved by the Ernest Gallo Clinic and Research Center Committee on Use and Care of Animals of the University of California, San Francisco, in compliance with National Institutes of Health standards.
Behavior
For behavioral testing, we used a transparent Plexiglas operant chamber (40 × 40 × 40 cm). The chamber was lit during the entire session. A programmable microcomputer controlled the equipment in the chamber (MED Associates). Two lick spouts with a light beam lickometer were mounted on opposite walls. Each trial started with the onset of white noise from a speaker within the chamber, indicating sucrose availability at one of the spouts (see Fig. 1A). Delivery and timing of sucrose solution (always 10%; ∼20 μl/s) through a lick spout was controlled by an electric valve and lasted, depending on the experiment, for 1–4 s. When sucrose is available, the first lick opens the valve and sucrose starts flowing for a programmed duration. After sucrose delivery, the rat had to abstain from licking for at least 5 s to initiate the next trial, indicated by the onset of white noise. Once a lick spout was activated, it could not be reactivated unless the spout on the opposite site was activated. This forced the rat to alternate between the two spouts. We noticed no difference in any of the measures reported here between the two lick spouts and therefore pooled data from the sites for analysis and presentation. Before surgery, rats were trained on the task until at least 50 trials were routinely completed in a 45 min session. Time stamps of behavioral events were sent to the data acquisition system by the behavior microcontroller to synchronize behavioral and electrophysiological or stimulation data.
Figure 1.
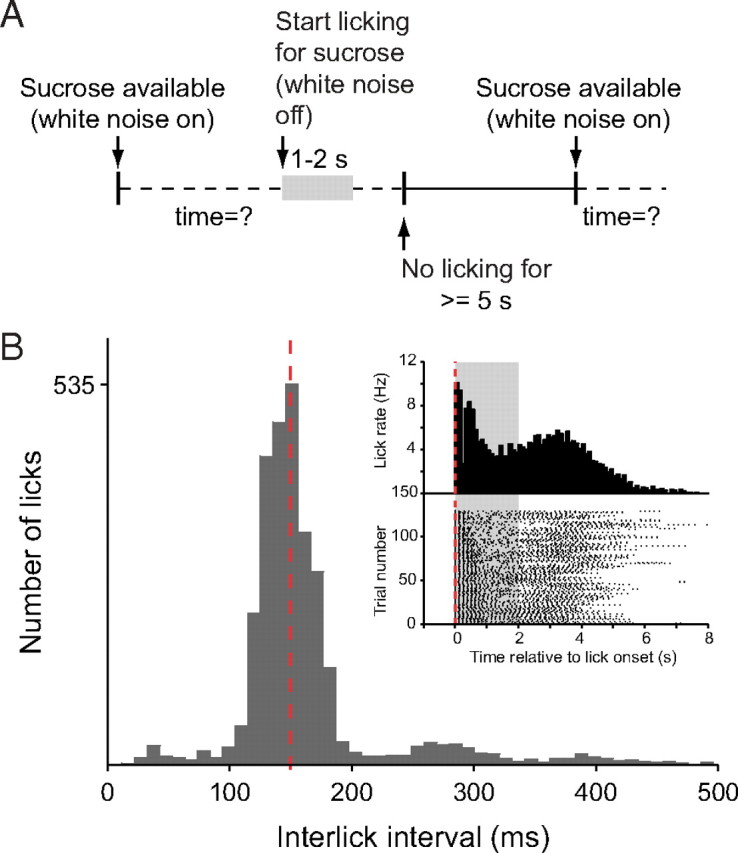
Behavior during sucrose consumption. A, Diagram of the behavioral task. White noise in the operant chamber indicates the sucrose availability (gray area). The sucrose valve opens on the first lick and stays open for a preset duration. To initiate the next trial, the rat had to withhold licking for at least 5 s. B, Interlick interval histogram of a representative session. The peak frequency of licking is 7 Hz (140 ms interlick interval, red dashed line). Inset, Perilick interval histogram (top) and raster plot of licking represented for each trial in the session (bottom). Sucrose availability is indicated by the gray area.
Single-unit recording
Differential recording of neural data was achieved by using one of the eight implanted wires as a reference electrode (Plexon). Neural recordings were filtered at 0.15–8.8 kHz and sampled at 40 kHz. Extracellular action potentials (spikes) were discriminated by setting a threshold on the positive or negative peak. Off-line sorting of spike wave forms to isolate single units was performed using waveform principal components analysis, spike peak and trough, and spike stability during the course of the recording (Offline Sorter; Plexon).
Using Wilcoxon's sign rank test (α set to 5%), we compared spike firing rates in a 3 s prelick period (from −5 to −2 s before lick onset) to the spike firing rates during the first 3 s of licking. We categorize type 1 neurons as those that showed a significant firing rate decrease, and type 2 neurons as those that showed a significant increase during the licking period. A third category consisted of neurons in which the mean firing rate was not different in the two epochs. We used Fisher's exact or the χ2 test (whichever was appropriate) to assess differences of proportions of type 1 and type 2 neurons between subregions.
Stimulation
After neuronal recording was completed, we used the same electrode wires for stimulation. Pairs of neighboring electrodes in the microwire array were used for bipolar stimulation. The mean impedance of electrode pairs in situ was 310 kΩ (range: 100–800 kΩ, at 1 kHz). Constant current biphasic pulses (positive first) of 100 or 200 μs duration up to 600 μA were delivered by an optically isolated stimulator (A-M Systems).
Bilateral stimulation.
In initial experiments, we used bilateral stimulation. For bilateral stimulation, electrodes in each hemisphere were chosen at which type 1 neurons had been recorded. For a given 45 min session, stimulation trains were delivered pseudorandomly at 20, 40, 60, or 120 μA intensity. The trains were always 1 s long, and the frequency was either 15 or 40 Hz (Ranck, 1975; Tehovnik, 1996). We constructed averaged perievent time histograms (PETHs) of licking (100 ms bin size) for each of the three stimulation conditions and for each of the four stimulation current intensities (supplemental Fig. S4, available at www.jneurosci.org as supplemental material). To quantify stimulation-induced disruption of licking, we regarded reduction (Eq. 1) or recovery (Eq. 2) in lick rate as separate processes. We used a least-squares approach to fit a sigmoid model around the stimulation onset and stimulation offset, using Matlab functions “nlinfit.m” and “nlpredci.m.”
The model for stimulation-induced lick reduction was as follows:
 |
with the initial parameters p(1) = 1.5 [maximal lick rate reduction (milliseconds−1)], p(2) = 0.18 [difference between prestimulation lick rate and maximal lick rate reduction (milliseconds)], p(3) = 0.02 (slope of the lick rate reduction [log(milliseconds)/milliseconds]), and p(4) = 28 (time shift for lick rate reduction to occur 1000 ms after lick onset [log(milliseconds)]) as initial parameters, and t represents time (milliseconds).
The model for lick rate recovery after stimulation offset was as follows:
 |
with the initial parameters p(1) = 7 [maximal lick rate recovery (milliseconds−1)], p(2) = 0.18 [difference between prestimulation lick rate and maximal lick rate reduction (milliseconds)], p(3) = 0.02 (slope of the lick rate reduction [log(milliseconds)/milliseconds]), and p(4) = 48 (time shift for lick rate recovery to occur 2000 ms after lick onset [log(milliseconds)]), and t (milliseconds) represents time. After the model was optimized for each stimulation condition, we used it to resample the lick rate at 1 kHz and calculated the time to half-maximal the reduction and recovery, respectively (supplemental Fig. S4, available at www.jneurosci.org as supplemental material). Time t = 0 ms denotes the onset of licking for both models.
From this analysis, we obtained the time to half-maximal lick rate reduction and to half-maximal lick recovery. The longest time to half-maximal lick reduction was 236 ms (supplemental Fig. S4, available at www.jneurosci.org as supplemental material) (15 Hz/100 μA; 120 μA), and we assumed that lick rate had reached a steady state 300 ms after lick onset. We then measured lick rate for 1 s (from 0.3 to 1.3 s after lick onset). We also measured the lick rate for a 1 s epoch after stimulation offset (starting at stimulation offset).
Unilateral stimulation.
To map locations for optimal disruption efficacy, we used unilateral stimulation between one pair of adjacent electrodes of the same implanted array. We used the current sink electrode to construct stimulation site maps. This procedure included all implanted electrodes, independent of whether single units were recorded previously. The distance between the electrode tips in each array was 200 μm before the implantation. Stimulations consisted of 1-s-long trains at 15 Hz with intensities ranging from 0 to 600 μA. Each intensity was tested in at least three trials in each session. Typically, stimulation started at 0 μA intensity and was slowly increased, with stimulation at 0 μA interposed between those at the higher intensities (supplemental Figs. S5–S7, available at www.jneurosci.org as supplemental material). During these experiments, sucrose was available for 4 s. The onset of the stimulation train was varied pseudorandomly at 1, 1.3, 1.6, or 2 s after the onset of licking, but sucrose was available for at least 1 s before and after each stimulation train. Stimulation occurred on each trial. The lick frequency during the period before stimulation had to exceed 6.25 Hz to trigger stimulation. We used this minimum cutoff rate because during pilot experiments lick bouts on some trials had lick rates significantly slower than the mean frequency (∼7 Hz) (see Fig. 1B). Because we expected the stimulation to decrease the lick rate, those trials were excluded (<20% of all trials). The number of trials excluded by this criterion was small on average (supplemental Figs. S6, S7, available at www.jneurosci.org as supplemental material).
We created a map of lick disruption efficacies based on the electrode positions in the NAc shell and core and the dorsal striatum. We distinguished between the anterior (anterior of +1.6 mm from bregma) and posterior regions of the NAc core and medial and lateral shell, as well as the dorsal striatum and olfactory tubercles. To obtain a measure of lick disruption efficacy, we plotted the number of licks in a 1 s epoch at each stimulus intensity (between 0.3 and 1.3 s after stimulation onset) for a given recording session (for more details, see Bilateral stimulation). Next, we plotted a regression line for the stimulation–lick disruption relationship for that recording session, using the Matlab function “robustfit.m” (the algorithm uses iteratively reweighted least squares with a bisquare weighting function to reduce the weight of outliers) to obtain a linear function of the following form:
where x represents the stimulation intensity; b, the intercept on the ordinate; y, the lick frequency at that intensity; and m, the slope of the line. Visual inspection of the stimulation–lick disruption relationship confirms that outliers are rare. In most cases, the robust fit was very similar to a least-square fit. We used the slope m as a measure for stimulation efficacy and multiplied all values by −100 to obtain the change in lick rate per 100 μA of stimulation current (supplemental Fig. S5, available at www.jneurosci.org as supplemental material).
The entire analysis was performed using built-in and custom-written routines in Matlab (The MathWorks), unless otherwise indicated.
Histology and verification of electrode positions
To mark recording and stimulation locations, rats were deeply anesthetized with 85 mg/kg (intraperitoneal) pentobarbital, and 5–15 μA anodal current was passed through each of the electrode wires for 15 s to deposit ferric iron at the electrode tips. The rat was then perfused through the heart with 200 ml of 0.1 m phosphate buffer, followed by 100 ml of 3% potassium ferricyanide in 0.1 m phosphate buffer, followed by 300 ml of 4% paraformaldehyde in 0.1 m phosphate buffer. The brain was dissected and kept in 4% paraformaldehyde for 24 h and then transferred to 30% sucrose in phosphate buffer for cryoprotection. Coronal sections (40 μm thick) were cut on a cryostat. Sections were dehydrated, defatted, stained with neutral red, and mounted on slides. To identify and reconstruct recording and stimulation locations, we examined each section under the microscope for Prussian blue deposits and lesions in the tissue. Rostrocaudal maps of stimulation sites were made using the sink of the most effective adjacent pair of wires for each implanted array.
Results
Neuronal inhibitions before onset of sucrose licking occur in nucleus accumbens core and shell, dorsal striatum, and olfactory tubercle
We recorded and analyzed a total of 380 single units in 16 rats while they performed the behavioral task depicted in Figure 1A. Of these neurons, 298 were located in the NAc, dorsal striatum, and olfactory tubercle. Licking was highly stereotypic with a frequency between 6 and 9 Hz as illustrated for one representative 45 min session (Fig. 1B). The mean interval between trials in 90 sessions (10,993 trials) was 9.4 ± 0.4 s.
The perievent time histograms in Figure 2C show neural activity relative to the onset of sucrose licking. The two neurons were recorded simultaneously on a single electrode and illustrate the two most common classes of neuron encountered in NAc, dorsal striatum, and olfactory tubercle when rats were performing the task. The most common class (type 1) showed inhibitions that correlated with sucrose consumption. An example of this is shown in green (Fig. 2A–C). This neuron fired at 3–5 Hz during the baseline period. Before the onset of licking, it briefly increased its firing rate, and then beginning ∼1 s immediately before the onset of licking, the firing rate began to decrease to a complete pause. This pause continued past the period of sucrose availability (denoted by the gray area) and terminated as the rat exited the sucrose port. A second common neuron class showed excitations in temporal relation to sucrose consumption (type 2). An example is illustrated in blue in Figure 2C, right panel. This neuron initially fired at 3–6 Hz, and then showed an increase in firing rate after the onset of sucrose licking. Both example neurons were recorded in the medial NAc shell, as indicated by the lesion made through the recording electrode (Fig. 2Da–c) at the site where the two neurons were recorded. Of the total of 298 neurons recorded in the NAc, dorsal striatum, and olfactory tubercle, 37% (n = 111) could not be classified as either type 1 or 2. Type 2 neurons varied in the relationship of their excitations to sucrose consumption: some showed transient discharges before licking, others during sucrose consumption, and some had a transient increase at licking offset (see supplemental Fig. S1, available at www.jneurosci.org as supplemental material).
Figure 2.
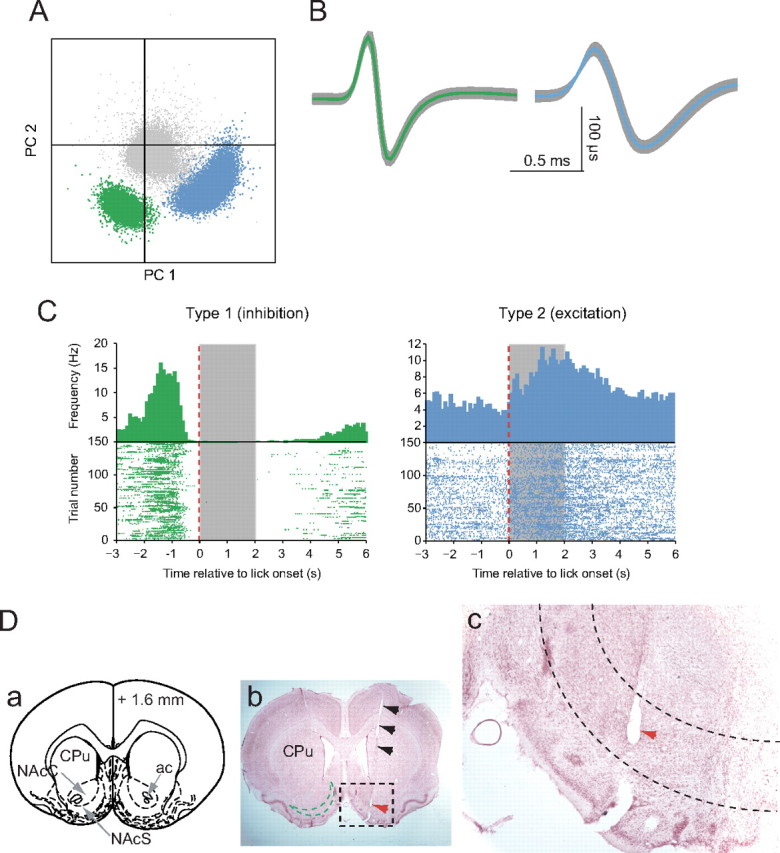
Neural activity in NAc during sucrose consumption. A, Separation of two single units from the noise (shown in gray) (PC, principal component). B, Identification and average waveforms of two neurons recorded during a 45 min session. C, Example perievent time histograms and raster plots of type 1 (green) and type 2 neurons (blue). Spike times are in reference to the onset of licking (red dashed lines). Timing of sucrose availability is indicated by the gray area. D, Electrode track and anatomical location of the recording. a, Schematic of coronal section at 1.6 mm anterior of bregma (Paxinos and Watson, 1998) for orientation with locations of the caudate–putamen (CPu), NAc core (NAcC) and shell (NAcS), and anterior commissure. b, A cresyl violet stained section at ∼1.6 mm anterior to bregma. The black arrows indicate the track of the electrode. The green dashed line in the left hemisphere approximates the area of the NAc shell. The red arrows (b, c) shown in the dashed frame indicate the lesion created by the electrode tip on which the neurons shown in A–C were recorded. c, Region in black dashed frame in b shown at higher magnification. The dashed lines delineate the NAc shell region. The electrode tip was located in the posterior medial NAc shell.
Firing patterns and distributions of type 1 neurons in different subregions
We next investigated the firing patterns and proportions of type 1 neurons (Fig. 3) in different subregions of the NAc, dorsal striatum, and olfactory tubercle. We used 1.6 mm anterior to bregma as the dividing line between anterior and posterior regions of the NAc.
Figure 3.

Type 1 neuron firing patterns and their proportions in different subregions. Average firing rate with SEM (light gray) is shown in PETHs around the onset of sucrose availability (vertical dashed line) for each of the eight subregions (100 ms bin size). The number of each neuron type recorded is indicated in the top left corner of each PETH, and the dark area in the pie chart next to each PETH represents the fraction of the neuron type of all neurons recorded in that subregion. The availability of sucrose is indicated by the vertical gray bar and lasted up to 2 s (randomized between 1, 1.5, and 2 s in each trial).
The majority of neurons in the investigated subregions consisted of either type 1 or type 2 neurons. The proportion of type 1 neurons varied from 16 to 60% in different subregions. We found significantly fewer type 1 neurons (16%; total n = 68; p < 0.01) in the posterior core compared all other subregions.
Type 2 neurons represented between 15 and 30% of the total number of neurons in the investigated subregions, except in the anterior core (<6%) and the olfactory tubercle (none). The anterior core showed a significantly smaller number of type 2 neurons compared with the posterior core (total n = 18; p < 0.05).
Type 1 neuron firing correlates with licking, but not sucrose ingestion
It has been proposed that inhibitions in NAc neurons, such as the reduction in firing rate of type 1 neurons, encode a signal for reward (Roitman et al., 2005; Carlezon and Thomas, 2008). If type 1 neurons encode sucrose reward, we should expect a return to prelick firing rates when sucrose delivery terminates. Because rats continue to lick the spout after the sucrose is stopped, we were able to test this idea. We aligned the firing rate of type 1 neurons to three events in the experiment, the first lick (which triggers sucrose onset), the offset of sucrose (valve closed), and the last lick in a trial, which is the lick before the 5 s time-out period starts. Figure 4 shows the average firing rate of NAc shell neurons superimposed on the average lick rate, time locked to the onset and offset of sucrose availability and to the last lick in a trial (before the 5 s time-out period starts). Although the firing rate of type 1 neurons decreases with the onset of sucrose flow (which starts with the first lick), the concomitant time course plots of firing and licking shows that type 1 firing rate more closely correlates with licking behavior than sucrose delivery. Note that, after the offset of sucrose availability (Fig. 4, middle panel, vertical dashed line), type 1 neuron firing does not immediately return to baseline (indicated by the dashed green line in Fig. 4). In contrast, there is an abrupt return to baseline firing at the time when licking ceases (Fig. 4, right panel). This result shows that type 1 neuron firing is more tightly correlated with the motor pattern of licking than the ingestion of sucrose.
Figure 4.

The firing rate of type 1 neurons in the NAc shell is related to licking. PETHs of the average firing rate of type 1 (n = 83) neurons superimposed on the average lick rate (shown as black bars; 200 ms bin size). The ordinate for firing rate is shown on the left of each plot, and the ordinate for lick rate is shown on the right. Scaling for firing or lick rate is the same in each panel. The PETHs are constructed around three events, denoted by the dashed red line in each case: the first lick (equivalent to the start of sucrose availability), the offset of sucrose availability (closing of the sucrose valve, varied between 1 and 2 s after the start of sucrose), and the last lick in each trial (which was followed by the 5 s period in which the rat abstained from licking). Prelick firing rate is denoted by the horizontal dashed line. Note that inhibition of firing in type 1 neurons persists after cessation of sucrose delivery but relaxes to baseline firing beginning just before licking ceases.
Local bilateral stimulation
Immediately after electrophysiological recordings, we used the same electrodes for electrical stimulation. Because bilateral inactivation of forebrain structures is generally required to alter appetitive and consummatory behaviors (Ishikawa et al., 2008; Peters et al., 2008), we initially used bilateral stimulation to determine the time course and efficacy of stimulation for the disruption of sucrose consumption. The behavioral paradigm for stimulation experiments was similar to that used for electrophysiological recordings, except that a train of 15 or 40 stimuli was delivered beginning 1 s after the onset of sucrose licking (Fig. 5A). For bilateral stimulation, we studied electrodes in each hemisphere at sites at which type 1 neurons had been recorded. Stimulation locations are indicated in Figure 5B. In 20% of the trials, we delivered a stimulation train for 1 s, starting 1 s after the onset of licking for sucrose. To capture licking behavior before and after stimulation, we extended the time of sucrose delivery to 3 s in these experiments. Stimulations were delivered at four different intensities. Figure 5C shows licking behavior before stimulation onset (top trace, first six trials in each session), and during random stimulation (bottom trace). Note that, at effective sites, licking was disrupted by the stimulation for at least the period of stimulation. Consecutive stimulations had the same effect, and licking appeared to return to normal on unstimulated trials that immediately followed a trial with stimulation.
Figure 5.
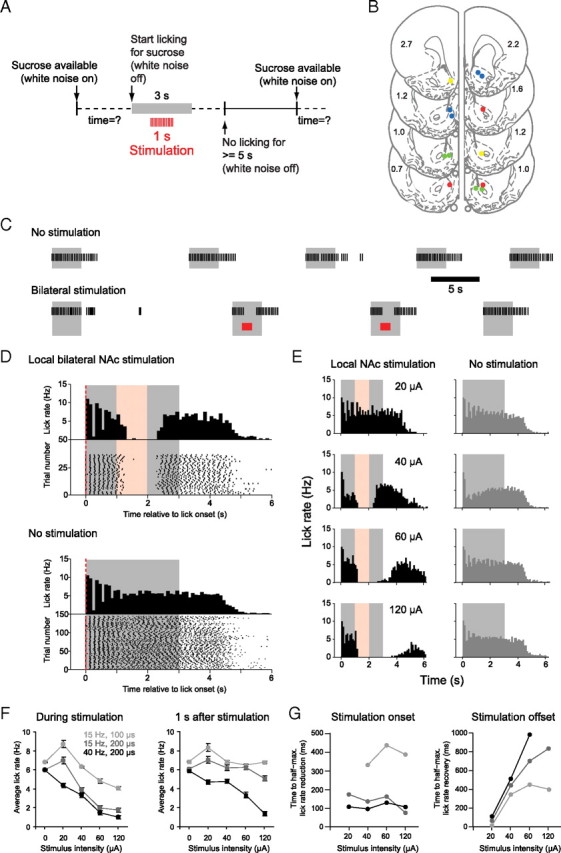
Bilateral local stimulation in the NAc shell disrupts licking. A, Schematic of the experimental paradigm. B, Anatomical location of stimulation sites used simultaneously for bilateral stimulation (2–4 sites) in four rats coded by four colors [coronal schematics and AP coordinates are taken from the rat atlas of Paxinos and Watson (1998)]. C, Example epochs from a session of sucrose licking before and during pseudorandom stimulation. Each black line in the raster plot represents a lick. In this and all other panels of this figure, the gray area represents the timing of sucrose delivery, and the red area, the timing of local NAc stimulation. D, Perilick interval histograms and lick raster plots of local stimulation. Stimulation trains were delivered pseudorandomly in 20% of the trials during the session, but for the purpose of illustration stimulated (left column, stimulation duration in red) and nonstimulated (right column, dark gray histograms) trials are pooled and shown in separate diagrams. E, The degree of lick disruption scales with stimulation intensity. Examples of perilick interval histograms of stimulated (left) and nonstimulated (right) trials (D, E, 100 ms bin size). F, Data summary (n = 4 rats) of the effect of local stimulation on average lick rate (and SEM) during the time of stimulation (left) and during 1 s after stimulation (right). G, Time to half-maximal lick suppression during stimulation onset (left) and half-maximal recovery after stimulation offset (right) for all stimulation intensities tested.
These relatively brief periods of stimulation did not reduce the total number of trials the rat completed per session, and sucrose licking in the absence of stimulation appeared normal between stimulation trials (compare Fig. 5D, bottom, “No stimulation,” with Fig. 1B, inset). To quantify the effect of different stimulation parameters on lick rate, we analyzed two 1 s epochs, during stimulation and after stimulation offset. Increasing the stimulus current up to 120 μA produced more potent disruption of licking during stimulation and resulted in lick inhibition that persisted longer after termination of stimulation (Fig. 5E,F, left panel) (F(4,52) = 5.82; p < 0.05). The lick rate decreased as a function of increasing stimulation current (Fig. 5F, right panel) (F(4,52) = 22.97; p < 0.001). The average lick rate during stimulation also depended on both train frequency and the duration of the individual stimuli within the train (Fig. 5F, right panel) (F(2,52) = 5.04; p < 0.05). In the 1 s period after stimulation offset, we also found a significant effect on lick rate suppression of varying the train frequency/duration combinations (F(2,52) = 5.3; p < 0.005; repeated-measures ANOVA).
We measured the time to half-maximal reduction of the lick rate for each stimulation condition (Fig. 5G; supplemental Fig. S4, available at www.jneurosci.org as supplemental material). Whereas the time course of lick rate reduction was relatively stable over a range of stimulation parameters (Fig. 5G, left panel), the time course of lick rate recovery was slower as stimulus intensity and frequency increased (Fig. 5G, right panel).
Although type 1 neurons predominated at most of the NAc sites effective for inhibiting licking, it is likely that significant numbers of type 2 and other adjacent neurons would be activated by the same stimuli. However, the abrupt decrease in firing rate of type 1 neurons before lick onset and the fact that stimulation inhibits licking support the idea that type 1 neurons inhibit licking. Because licking resumes rapidly after offset of stimulation at lower stimulus intensities, we compared the latency between the decrease in type 1 neuron firing and the onset of licking to the latency for recovery of licking after stimulation offset. If type 1 neuron firing permissively gates licking and electrical stimulation disrupts licking by activation of these neurons, these two latencies should be similar. We selected data from the bilateral stimulation experiments using stimulus intensities just sufficient to produce at least 50% inhibition of licking (n = 9 recordings). Type 1 neurons from these same regions provided the firing offset data (n = 38). We found no significant difference between the time from the half-maximal reduction in firing rate of type 1 neurons to the first lick (mean, 456 ms) and the time from the last stimulus in a train to the half-maximal lick rate recovery (mean, 439 ms; t(8) = 0.26, p = 0.79, two-tailed t test) (Fig. 6). The similarity of the latencies from offset of firing of type 1 neurons and the offset of electrical stimulation to recovery of licking lends additional support to our hypothesis that inhibitions of type 1 neurons is required for the initiation and maintenance of sucrose licking.
Figure 6.
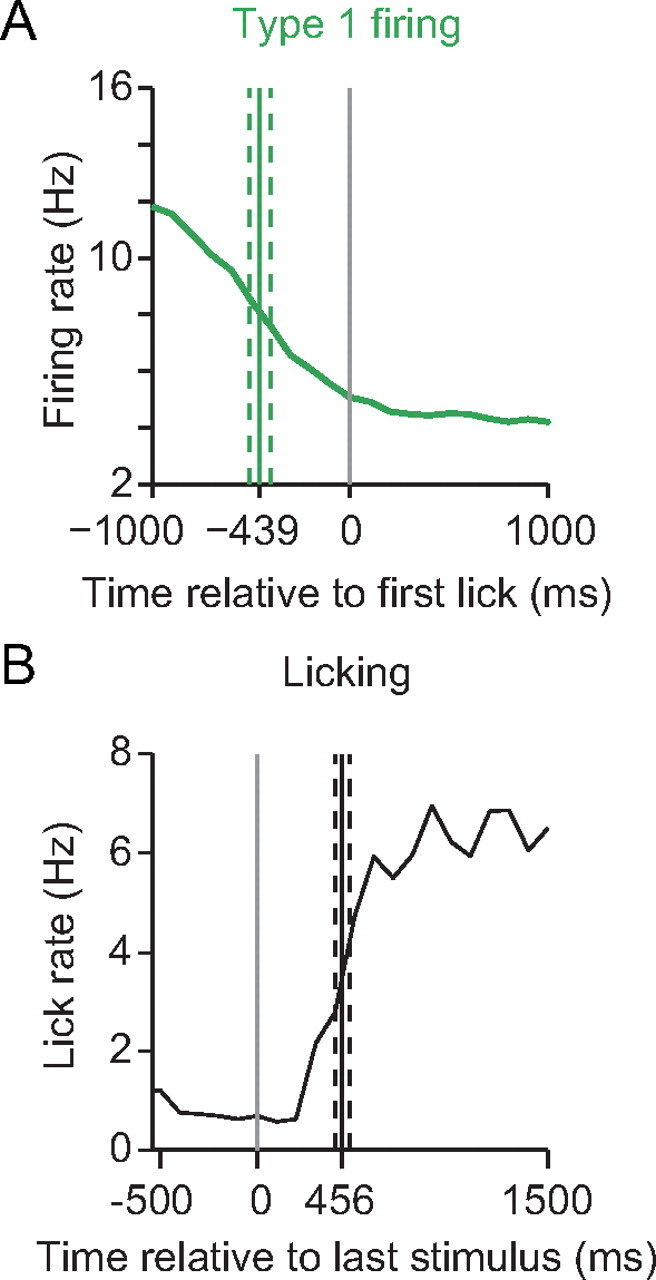
Latency to lick onset from type 1 neuron firing decrease and latency to recovery of lick rate after stimulation offset. A, Average firing rate (green) of type 1 neurons in the NAc between 1.2 and 1.6 mm anterior to bregma (n = 38) around the first lick. The solid green line denotes the mean time from the half-maximal reduction of the firing rate decrease to the first lick (dashed lines denote SEM). B, Average lick rate (black) (n = 9; stimulation parameters: 15 Hz at 100 or 200 μs stimulus duration at 40–120 μA) around the last stimulus in train. The mean time from last stimulus to the half-maximal recovery of licking is shown as a solid black line (dashed lines denote SEM). Note the similarity between the two time intervals.
Unilateral stimulation: effective locations for lick disruption
To map the distribution of most effective stimulation-induced lick disruption sites, we implanted electrode arrays in different sites (n = 129) in the NAc, the dorsal striatum, and the surrounding areas. The experimental paradigm was identical with the one shown in Figure 5A, but we extended sucrose delivery to 4 s. This was necessary because we stimulated on every trial in a session and therefore randomized the onset of the delivery of the stimulation train between 1 and 2 s after lick onset. This measure reduces the ability of the rat to predict the time of stimulation onset but still allowed at least 1 s of sucrose licking before stimulation. All unilateral stimulation trains were delivered at 15 Hz and 200 μs pulse duration. The mean current intensity (120 μA) needed to completely suppress licking at 15 Hz was lower for bilateral stimulation (Fig. 5F), compared with unilateral stimulation (200–250 μA) (Fig. 7C). For unilateral stimulation, we used the slope of the plot of lick suppression with stimulus intensity as a measure of stimulation efficacy at the tested site (Fig. 7A) (for details, see Materials and Methods). Typical examples of sessions probing effective and ineffective sites are shown in supplemental Figures S5–S7 (available at www.jneurosci.org as supplemental material). We then ranked the slopes of all 129 sites tested, and categorized those that showed a reduction in lick rate per 100 μA stimulation current of 1 or more as effective sites. Conversely, those sites that showed a reduction in lick rate per 100 μA stimulation current of 0.25 licks or less were categorized as ineffective (Fig. 7B). Average peristimulus time histograms of both categories confirm that licking was powerfully disrupted at sensitive sites, but not at insensitive sites (Fig. 7C). The effect of stimulation at a given electrode site was stable over several days as we occasionally retested electrode pairs.
Figure 7.
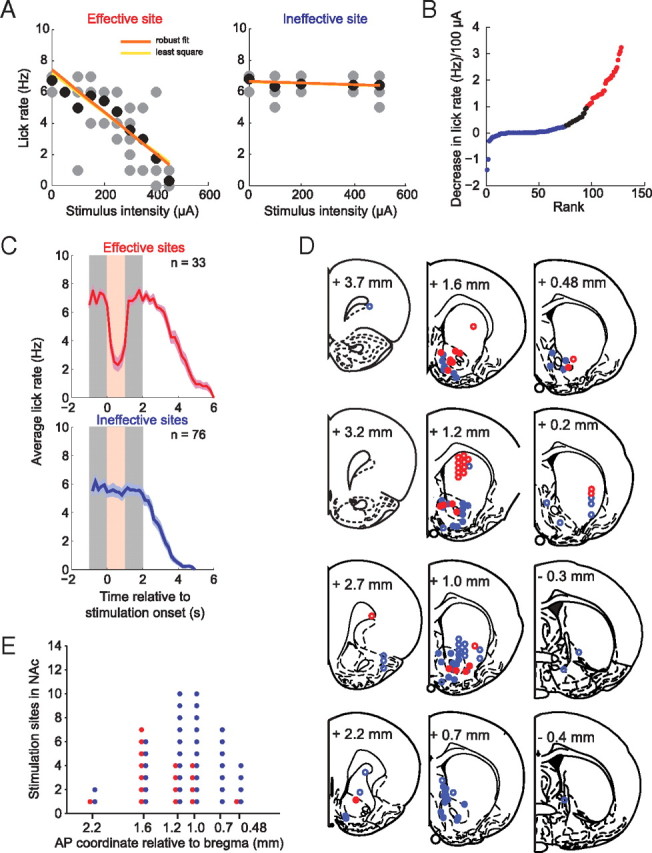
Stimulation-induced disruption of licking is most effective in NAc and dorsal striatum. For the purpose of illustration, all stimulation sites (n = 129) are collapsed in one hemisphere. Only one electrode pair was tested at a time. A, Examples of input–output relationships of an effective site (red, left panel) and an ineffective site (blue, right panel) of lick disruption. The gray dots represent the per-trial lick count at a given intensity, and the black dots represent the average of all lick counts at that intensity. The orange linear regression line was obtained with the robust fit method, and the yellow regression line, with the least square method. B, Recordings ranked by the reduction in lick rate (∼7 Hz in the absence of stimulation) per 100 μA of stimulation current. This was used as a measure of lick disruption efficacy. Stimulation pairs in which the decrease was ≥1 are shown in red (effective sites), and those in which the decrease was ≤0.25 are shown in blue (ineffective sites). Both thresholds were set arbitrarily. C, Average licking time course (and SEM) of effective (red) and ineffective sites (blue), time-locked to the stimulation onset. Stimulation (200–250 μA) (shown in light red) was always delivered during sucrose consumption (shown in gray) (for details, see Materials and Methods). The number of stimulation–disruption relationships is indicated in each plot. D, Anatomical location of stimulation sites of effective (red) and ineffective (blue) sites, shown in coronal outlines modified from the atlas of Paxinos and Watson (1998). The open circles are sites outside of the NAc. E, Distribution of effective (red) and ineffective (blue) stimulation sites in the NAc as a function of AP position. Note that effective sites have a more rostral distribution than ineffective sites in NAc.
Although effective and ineffective sites were found at all locations within the striatum, sensitive sites were clustered in a region that includes the NAc core and shell and the dorsal striatum (Fig. 7D). We observed no difference between the medial NAc shell region and the lateral shell or core regions with regard to the efficacy of the stimulation-induced feeding disruption. Along the rostrocaudal axis within the NAc, effective sites were more likely in anterior locations (median, 1.6 mm anterior to bregma), whereas ineffective sites had a more caudal mean distribution (median, 1.0 mm) (Fig. 7E). This anatomical difference was statistically significant (p < 0.05, Wilcoxon's rank sum test). It is important to point out, however, that effective and ineffective sites were often found in adjacent electrodes in the same array and within the same stimulation session. This suggests that effective sites are highly localized but distributed in a mosaic pattern intermingled with ineffective sites. This finding also indicates that the observed inhibition of licking at effective locations is not attributable to current spread to distant sites.
Although effective stimulation sites and type 1 neurons were found throughout the striatum, both showed a tendency to cluster in NAc along the AP axis. Figure 8 shows that the sites for effective stimulation (n = 18) and type 1 neurons (n = 54) in NAc are similarly distributed along the rostrocaudal axis (p = 1, Wilcoxon's rank sum test). By contrast, the rostrocaudal distribution of type 1 neurons is different from that of ineffective sites (n = 39) (Fig. 7E, shown in blue) (p < 0.05, Wilcoxon's rank sum test). Along this axis of the NAc, the distribution of type 1 neurons extends more rostrally and caudally than that of effective stimulation sites. Five of the six effective stimulation sites in the medial shell and the majority of effective sites in the core were located at or rostral to +1.2 mm to bregma (Fig. 8A), whereas the two effective sites in the lateral shell were at +1 mm to bregma. At +1.6 mm to bregma, two sites were found at which the same electrode recorded type 1 neurons and produced effective disruption of licking (Fig. 8A, red circles with green rims).
Figure 8.
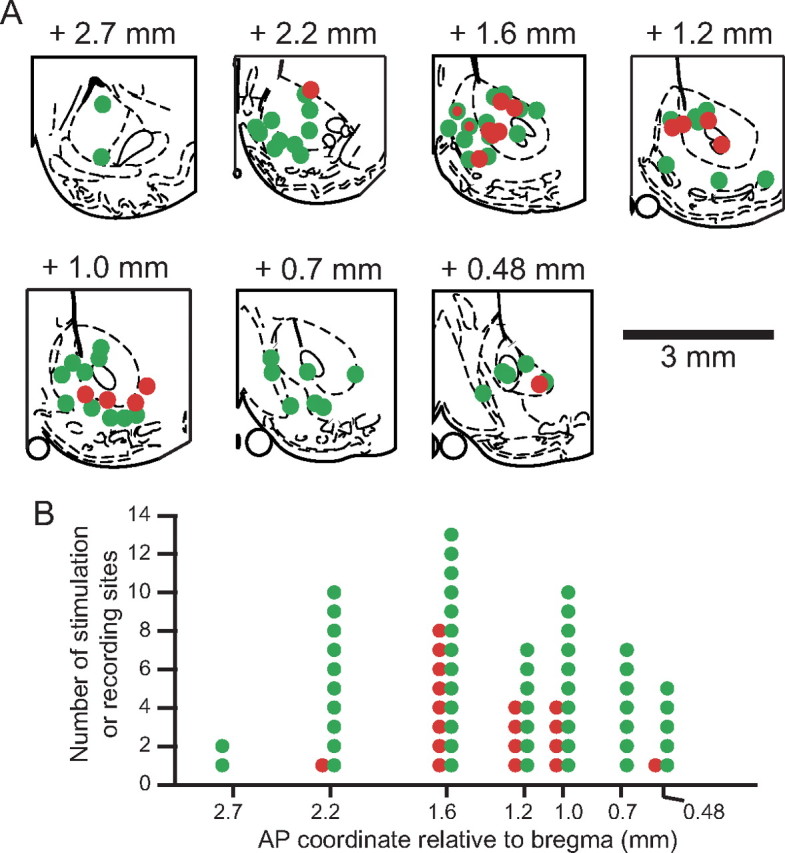
Type 1 neuron locations overlap with effective sites for stimulation-induced disruption of sucrose licking in NAc. A, Coronal schematic outlines of the right NAc area at different anterior–posterior coordinates (adapted from (Paxinos and Watson, 1998). The location of 54 electrodes on which type 1 neurons in NAc were recorded are shown in green, and 17 effective stimulation sites in NAc are shown in red. The two electrode sites shown in red framed in green (at AP +1.6) were sites where type 1 neurons were detected, and effective stimulation was produced by the same electrode. B, The number of type 1 recording and effective stimulation sites as a function of their location along the anterior–posterior axis.
Discussion
We have confirmed that a large subpopulation of neurons (type 1) in the NAc core and shell abruptly decrease their firing rate immediately before the initiation of sucrose consumption and remain inhibited during the lick bout. We previously proposed (Taha and Fields, 2005, 2006) that this inhibition is required to initiate and maintain feeding. The current work directly supports this hypothesis by showing that local stimulation of neurons in striatum rapidly and reversibly inhibits licking. Effective sites for lick inhibition were in the NAc shell and core and the dorsal striatum. In the NAc type 1 neurons and sites for effective stimulation clustered between 1 and 2.2 mm anterior to bregma. This spatial overlap supports the hypothesis that activating NAc type 1 neurons suppresses feeding and that their inactivation promotes appetitive and consummatory behaviors.
Because most neurons in striatum (Kemp and Powell, 1971; Graveland and DiFiglia, 1985; Oorschot, 1996; Luk and Sadikot, 2001) and NAc (DeFrance et al., 1985; O'Donnell and Grace, 1993) are GABAergic medium spiny neurons (MSNs), it is possible that electrical stimulation of MSNs leads to local inhibition through collaterals to other MSNs (Park et al., 1980; Wilson and Groves, 1981). However, collateral inhibition of MSNs is weak (Jaeger et al., 1994) and in vitro dual recordings indicate that local connectivity among MSNs is relatively sparse (Koós and Tepper, 1999; Koós et al., 2004).
It is interesting to note that trains delivered at 15 Hz in brain stimulation reward experiments are hedonically ineffective, whereas trains at 40 Hz are rewarding (Gallistel and Karras, 1984; Wise, 1996). By contrast, both frequencies effectively suppressed licking in the present paradigm, suggesting different underlying mechanisms for reward and for lick suppression. Compared with 15 Hz, trains at 40 Hz had a greater effect during the period after stimulation offset. Although a variety of neurons will be activated by local electrical stimulation, type 1 neurons are implicated in lick disruption by the observation that the latency to lick recovery after offset of NAc electrical stimulation is virtually identical with the latency from the onset of type 1 neuron inhibition to first lick. No other neurons recorded in this behavioral paradigm show a tight temporal correlation of discharge offset with the initiation of licking.
The current studies directly support the idea that the onset of inhibition of type 1 NAc neurons initiates and the sustained inhibition maintains the actions eventuating in sucrose consumption. However, others have shown that transient and sustained inhibitions of NAc neurons correlate with different events during learned tasks, including reward predictive cues, operant motor behaviors, and reward receipt/consumption (Carelli et al., 2000; Nicola et al., 2004a,b; Wilson and Bowman, 2004; Roitman et al., 2005; Carlezon and Thomas, 2008). One influential interpretation is that these NAc neuronal inhibitions encode reward or a positive hedonic effect (Roitman et al., 2005; Carlezon and Thomas, 2008). In support of this idea, rats learn to self-administer NMDA antagonists directly into the NAc (Carlezon and Wise, 1996a,b). NMDA antagonists would be expected to inhibit NAc neurons. Rats will also self-administer the dopamine reuptake inhibitor, nomifensine, into the NAc, an effect blocked by the dopamine D2 receptor antagonist sulpiride. Since activating D2 receptors inhibits NAc neurons, the blockade of nomifensine self-administration by sulpiride indicates that inhibition of some NAc neurons is rewarding (Carlezon et al., 1995). Also consistent with this idea, reversible inactivation of the rostral NAc shell region produces conditioned place preference (CPP) (rostral to +1.7 anterior to bregma) (Reynolds and Berridge, 2001). Type 1 neurons were found at these rewarding rostral NAc sites; however, our most effective sites for disruption of sucrose consumption by electrical stimulation were more caudal, at sites where muscimol inactivation did not produce CPP. Even further caudal (caudal to +1.0) in NAc, muscimol inactivation produced place aversion. Type 1 neurons were also found at these caudal aversive sites; however, stimulation at these caudal NAc sites was ineffective for disruption of feeding. Because type 1 neurons are more widely distributed than effective sites for disruption of licking, it is possible that the type 1 neurons at anterior NAc sites could contribute to reward and those at caudal NAc sites could contribute to aversion.
Evidence that NAc neuronal inhibitions encode reward was first reported by Roitman and Carelli (2005) using direct infusions of sucrose or quinine into the mouth of rats. For sucrose infusions, ∼38% of all NAc neurons showed transient inhibitions, whereas only ∼13% showed excitations for sucrose. For quinine, it was almost exactly reversed. Furthermore, mostly separate subpopulations of NAc neurons showed either sucrose inhibitions or quinine excitations. Because the rewarding and aversive tastes were delivered without a required action to obtain them, the authors interpreted their results as indicating that the inhibitions of NAc neurons encode reward. However, we previously demonstrated a clear dissociation between the timing and magnitude of NAc neuronal inhibitions and that of a consumed sucrose reward (Taha and Fields, 2006). We found that most NAc inhibitions begin ∼1 s before lick onset—well in advance of sucrose receipt in the oral cavity. Furthermore, the onset, magnitude, and offset of inhibitions were the same when 3% or the preferred 10% sucrose were presented and consumed. In fact, these inhibitions occurred even when the animals licked the spout in the absence of any sucrose delivery (Taha and Fields, 2005). These data, along with the current results showing a close correlation of inhibitions with licking onset and offset (rather than sucrose delivery) (Fig. 4), provide a clear dissociation between NAc neuronal inhibition and reward. Furthermore, the time course of the inhibitions in these neurons is more consistent with their having a role in modulating consummatory behavior than in encoding the reward value of the sucrose taste. In fact, much of the extant literature on this issue can be interpreted as supporting the idea that a large subpopulation of NAc neurons has a predominantly inhibitory effect on locomotor, appetitive, and consummatory behaviors. For example, general inactivation of the NAc shell region with muscimol dramatically increases food consumption (Stratford and Kelley, 1997, 1999; Basso and Kelley, 1999; Reynolds and Berridge, 2001). In addition, several drugs of abuse increase excitability of NAc MSNs through a mechanism involving the cAMP response element-binding protein and increased NMDA receptor, which in turn is associated with reduced locomotor responses to cocaine and novelty (Dong et al., 2006; Huang et al., 2008). Conversely, general inhibition of NAc MSNs enhances locomotor responses to cocaine (Dong et al., 2006). Electrophysiological results in behaving rats are consistent with this interpretation. For example, we showed that a subset of NAc neurons have inhibitions that begin as soon as rats initiate reward approach and continue until the reward is consumed and the rat exits the reward receptacle (Taha and Fields, 2006). Similarly, Day et al. (2006) studied rats trained in a cued pavlovian approach paradigm. They found that a large subset of NAc neurons show inhibitions that begin at the onset of a cued approach and continue until sucrose consumption. Can we reconcile these observations with the observation of Roitman et al. (2005) that infusing sucrose into the mouth of rats causes robust NAc neuronal inhibitions? In fact, the authors measured electromyogram (EMG) responses in muscles involved in ingestion after sucrose infusion into the rat oral cavity. They found that the magnitude and onset latency of the sucrose induced inhibitions of NAc neurons correlated significantly with EMG activity. One simple interpretation of this finding is that NAc neuronal inhibitions facilitated or permitted ingestive swallowing behavior rather than encoding the reward value of sucrose.
Because NAc inactivation promotes feeding and stimulation inhibits feeding, type 1 neurons are strong candidates to mediate NAc control over feeding. How do inhibitions promote feeding? One major NAc output target is the LH, which has been implicated in the increased consumption elicited by NAc inactivation. Electrical stimulation in NAc inhibits neural activity in the LH (Mogenson et al., 1983) and inactivation of NAc shell activates LH neurons (Stratford and Kelley, 1999). However, NAc MSNs do not terminate in an area of the LH where orexin or melanin-concentrating hormone neurons are located, but rather in a location with glutamatergic neurons (Sano and Yokoi, 2007). This is consistent with the finding that blocking NMDA receptors in LH blocks NAc-muscimol-induced feeding, and suggests that MSN feeding-related signaling works via disinhibition of glutamatergic interneurons in LH (Stratford and Kelley, 1999). Hence, a firing rate decrease in NAc neurons (e.g., type 1) would disinhibit glutamatergic neurons in LH, which then drives LH neurons that promote feeding. Confirmation of this idea requires demonstrating that at least some NAc type 1 neurons project to LH.
The predominant class of neuron in the NAc (type 1) shows an inhibition beginning before the onset of licking, continuing during sucrose consumption, and persisting during the licking that continues after sucrose delivery stops. Effective sites for terminating feeding cluster spatially in the NAc with sites containing type 1 neurons. Licking recovers at the same latency after stimulation offset and type 1 neuron inhibition onset. These results directly support the hypothesis that type 1 neurons actively inhibit feeding and that inhibition of type 1 neurons initiates and maintains feeding.
Footnotes
This work was supported by funds from the State of California for medical research on alcohol and substance abuse (H.L.F.) through the University of California, San Francisco, and Young Investigator Awards (M.K., S.A.T.) by the National Alliance for the Research on Schizophrenia and Depression, and National Institute of Mental Health (S.A.T.). We thank Dr. V. Kharazia and A. Holloway for excellent technical support.
References
- Basso AM, Kelley AE. Feeding induced by GABAA receptor stimulation within the nucleus accumbens shell: regional mapping and characterization of macronutrient and taste preference. Behav Neurosci. 1999;113:324–336. doi: 10.1037//0735-7044.113.2.324. [DOI] [PubMed] [Google Scholar]
- Carelli RM, Ijames SG, Crumling AJ. Evidence that separate neural circuits in the nucleus accumbens encode cocaine versus “natural” (water and food) reward. J Neurosci. 2000;20:4255–4266. doi: 10.1523/JNEUROSCI.20-11-04255.2000. [DOI] [PMC free article] [PubMed] [Google Scholar]
- Carlezon WA, Jr, Thomas MJ. Biological substrates of reward and aversion: a nucleus accumbens activity hypothesis. Neuropharmacology. 2008;56(Suppl 1):122–132. doi: 10.1016/j.neuropharm.2008.06.075. [DOI] [PMC free article] [PubMed] [Google Scholar]
- Carlezon WA, Jr, Wise RA. Rewarding actions of phencyclidine and related drugs in nucleus accumbens shell and frontal cortex. J Neurosci. 1996a;16:3112–3122. doi: 10.1523/JNEUROSCI.16-09-03112.1996. [DOI] [PMC free article] [PubMed] [Google Scholar]
- Carlezon WA, Jr, Wise RA. Microinjections of phencyclidine (PCP) and related drugs into nucleus accumbens shell potentiate medial forebrain bundle brain stimulation reward. Psychopharmacology (Berl) 1996b;128:413–420. doi: 10.1007/s002130050151. [DOI] [PubMed] [Google Scholar]
- Carlezon WA, Jr, Devine DP, Wise RA. Habit-forming actions of nomifensine in nucleus accumbens. Psychopharmacology (Berl) 1995;122:194–197. doi: 10.1007/BF02246095. [DOI] [PubMed] [Google Scholar]
- Day JJ, Wheeler RA, Roitman MF, Carelli RM. Nucleus accumbens neurons encode pavlovian approach behaviors: evidence from an autoshaping paradigm. Eur J Neurosci. 2006;23:1341–1351. doi: 10.1111/j.1460-9568.2006.04654.x. [DOI] [PubMed] [Google Scholar]
- DeFrance JF, Marchand JF, Sikes RW, Chronister RB, Hubbard JI. Characterization of fimbria input to nucleus accumbens. J Neurophysiol. 1985;54:1553–1567. doi: 10.1152/jn.1985.54.6.1553. [DOI] [PubMed] [Google Scholar]
- Dong Y, Green T, Saal D, Marie H, Neve R, Nestler EJ, Malenka RC. CREB modulates excitability of nucleus accumbens neurons. Nat Neurosci. 2006;9:475–477. doi: 10.1038/nn1661. [DOI] [PubMed] [Google Scholar]
- Gallistel CR, Karras D. Pimozide and amphetamine have opposing effects on the reward summation function. Pharmacol Biochem Behav. 1984;20:73–77. doi: 10.1016/0091-3057(84)90104-7. [DOI] [PubMed] [Google Scholar]
- Graveland GA, DiFiglia M. The frequency and distribution of medium-sized neurons with indented nuclei in the primate and rodent neostriatum. Brain Res. 1985;327:307–311. doi: 10.1016/0006-8993(85)91524-0. [DOI] [PubMed] [Google Scholar]
- Heimer L, Zahm DS, Churchill L, Kalivas PW, Wohltmann C. Specificity in the projection patterns of accumbal core and shell in the rat. Neuroscience. 1991;41:89–125. doi: 10.1016/0306-4522(91)90202-y. [DOI] [PubMed] [Google Scholar]
- Huang YH, Lin Y, Brown TE, Han MH, Saal DB, Neve RL, Zukin RS, Sorg BA, Nestler EJ, Malenka RC, Dong Y. CREB modulates the functional output of nucleus accumbens neurons: a critical role of N-methyl-d-aspartate glutamate receptor (NMDAR) receptors. J Biol Chem. 2008;283:2751–2760. doi: 10.1074/jbc.M706578200. [DOI] [PMC free article] [PubMed] [Google Scholar]
- Ishikawa A, Ambroggi F, Nicola SM, Fields HL. Dorsomedial prefrontal cortex contribution to behavioral and nucleus accumbens neuronal responses to incentive cues. J Neurosci. 2008;28:5088–5098. doi: 10.1523/JNEUROSCI.0253-08.2008. [DOI] [PMC free article] [PubMed] [Google Scholar]
- Jaeger D, Kita H, Wilson CJ. Surround inhibition among projection neurons is weak or nonexistent in the rat neostriatum. J Neurophysiol. 1994;72:2555–2558. doi: 10.1152/jn.1994.72.5.2555. [DOI] [PubMed] [Google Scholar]
- Kelley AE, Swanson CJ. Feeding induced by blockade of AMPA and kainate receptors within the ventral striatum: a microinfusion mapping study. Behav Brain Res. 1997;89:107–113. doi: 10.1016/s0166-4328(97)00054-5. [DOI] [PubMed] [Google Scholar]
- Kelley AE, Baldo BA, Pratt WE. A proposed hypothalamic-thalamic-striatal axis for the integration of energy balance, arousal, and food reward. J Comp Neurol. 2005a;493:72–85. doi: 10.1002/cne.20769. [DOI] [PubMed] [Google Scholar]
- Kelley AE, Baldo BA, Pratt WE, Will MJ. Corticostriatal-hypothalamic circuitry and food motivation: integration of energy, action and reward. Physiol Behav. 2005b;86:773–795. doi: 10.1016/j.physbeh.2005.08.066. [DOI] [PubMed] [Google Scholar]
- Kemp JM, Powell TP. The structure of the caudate nucleus of the cat: light and electron microscopy. Philos Trans R Soc Lond B Biol Sci. 1971;262:383–401. doi: 10.1098/rstb.1971.0102. [DOI] [PubMed] [Google Scholar]
- Koós T, Tepper JM. Inhibitory control of neostriatal projection neurons by GABAergic interneurons. Nat Neurosci. 1999;2:467–472. doi: 10.1038/8138. [DOI] [PubMed] [Google Scholar]
- Koós T, Tepper JM, Wilson CJ. Comparison of IPSCs evoked by spiny and fast-spiking neurons in the neostriatum. J Neurosci. 2004;24:7916–7922. doi: 10.1523/JNEUROSCI.2163-04.2004. [DOI] [PMC free article] [PubMed] [Google Scholar]
- Krause M, German PW, Taha SA, Fields HL. Activation of nucleus accumbens neurons produces a pause in sucrose consumption. Soc Neurosci Abstr. 2009;35:583–510. [Google Scholar]
- Luk KC, Sadikot AF. GABA promotes survival but not proliferation of parvalbumin-immunoreactive interneurons in rodent neostriatum: an in vivo study with stereology. Neuroscience. 2001;104:93–103. doi: 10.1016/s0306-4522(01)00038-0. [DOI] [PubMed] [Google Scholar]
- Maldonado-Irizarry CS, Swanson CJ, Kelley AE. Glutamate receptors in the nucleus accumbens shell control feeding behavior via the lateral hypothalamus. J Neurosci. 1995;15:6779–6788. doi: 10.1523/JNEUROSCI.15-10-06779.1995. [DOI] [PMC free article] [PubMed] [Google Scholar]
- Mogenson GJ, Swanson LW, Wu M. Neural projections from nucleus accumbens to globus pallidus, substantia innominata, and lateral preoptic-lateral hypothalamic area: an anatomical and electrophysiological investigation in the rat. J Neurosci. 1983;3:189–202. doi: 10.1523/JNEUROSCI.03-01-00189.1983. [DOI] [PMC free article] [PubMed] [Google Scholar]
- Nicola SM, Yun IA, Wakabayashi KT, Fields HL. Cue-evoked firing of nucleus accumbens neurons encodes motivational significance during a discriminative stimulus task. J Neurophysiol. 2004a;91:1840–1865. doi: 10.1152/jn.00657.2003. [DOI] [PubMed] [Google Scholar]
- Nicola SM, Yun IA, Wakabayashi KT, Fields HL. Firing of nucleus accumbens neurons during the consummatory phase of a discriminative stimulus task depends on previous reward predictive cues. J Neurophysiol. 2004b;91:1866–1882. doi: 10.1152/jn.00658.2003. [DOI] [PubMed] [Google Scholar]
- O'Donnell P, Grace AA. Physiological and morphological properties of accumbens core and shell neurons recorded in vitro. Synapse. 1993;13:135–160. doi: 10.1002/syn.890130206. [DOI] [PubMed] [Google Scholar]
- Oorschot DE. Total number of neurons in the neostriatal, pallidal, subthalamic, and substantia nigral nuclei of the rat basal ganglia: a stereological study using the cavalieri and optical disector methods. J Comp Neurol. 1996;366:580–599. doi: 10.1002/(SICI)1096-9861(19960318)366:4<580::AID-CNE3>3.0.CO;2-0. [DOI] [PubMed] [Google Scholar]
- Park MR, Lighthall JW, Kitai ST. Recurrent inhibition in the rat neostriatum. Brain Res. 1980;194:359–369. doi: 10.1016/0006-8993(80)91217-2. [DOI] [PubMed] [Google Scholar]
- Paxinos G, Watson C. Ed 4. San Diego: Academic; 1998. The rat brain in stereotaxic coordinates. [DOI] [PubMed] [Google Scholar]
- Peters J, LaLumiere RT, Kalivas PW. Infralimbic prefrontal cortex is responsible for inhibiting cocaine seeking in extinguished rats. J Neurosci. 2008;28:6046–6053. doi: 10.1523/JNEUROSCI.1045-08.2008. [DOI] [PMC free article] [PubMed] [Google Scholar]
- Ranck JB., Jr Which elements are excited in electrical stimulation of mammalian central nervous system: a review. Brain Res. 1975;98:417–440. doi: 10.1016/0006-8993(75)90364-9. [DOI] [PubMed] [Google Scholar]
- Reynolds SM, Berridge KC. Fear and feeding in the nucleus accumbens shell: rostrocaudal segregation of GABA-elicited defensive behavior versus eating behavior. J Neurosci. 2001;21:3261–3270. doi: 10.1523/JNEUROSCI.21-09-03261.2001. [DOI] [PMC free article] [PubMed] [Google Scholar]
- Reynolds SM, Berridge KC. Positive and negative motivation in nucleus accumbens shell: bivalent rostrocaudal gradients for GABA-elicited eating, taste “liking”/“disliking” reactions, place preference/avoidance, and fear. J Neurosci. 2002;22:7308–7320. doi: 10.1523/JNEUROSCI.22-16-07308.2002. [DOI] [PMC free article] [PubMed] [Google Scholar]
- Roitman MF, Wheeler RA, Carelli RM. Nucleus accumbens neurons are innately tuned for rewarding and aversive taste stimuli, encode their predictors, and are linked to motor output. Neuron. 2005;45:587–597. doi: 10.1016/j.neuron.2004.12.055. [DOI] [PubMed] [Google Scholar]
- Sano H, Yokoi M. Striatal medium spiny neurons terminate in a distinct region in the lateral hypothalamic area and do not directly innervate orexin/hypocretin- or melanin-concentrating hormone-containing neurons. J Neurosci. 2007;27:6948–6955. doi: 10.1523/JNEUROSCI.0514-07.2007. [DOI] [PMC free article] [PubMed] [Google Scholar]
- Stratford TR, Kelley AE. GABA in the nucleus accumbens shell participates in the central regulation of feeding behavior. J Neurosci. 1997;17:4434–4440. doi: 10.1523/JNEUROSCI.17-11-04434.1997. [DOI] [PMC free article] [PubMed] [Google Scholar]
- Stratford TR, Kelley AE. Evidence of a functional relationship between the nucleus accumbens shell and lateral hypothalamus subserving the control of feeding behavior. J Neurosci. 1999;19:11040–11048. doi: 10.1523/JNEUROSCI.19-24-11040.1999. [DOI] [PMC free article] [PubMed] [Google Scholar]
- Stratford TR, Swanson CJ, Kelley A. Specific changes in food intake elicited by blockade or activation of glutamate receptors in the nucleus accumbens shell. Behav Brain Res. 1998;93:43–50. doi: 10.1016/s0166-4328(97)00140-x. [DOI] [PubMed] [Google Scholar]
- Stratford TR, Kelley AE, Simansky KJ. Blockade of GABAA receptors in the medial ventral pallidum elicits feeding in satiated rats. Brain Res. 1999;825:199–203. doi: 10.1016/s0006-8993(99)01239-1. [DOI] [PubMed] [Google Scholar]
- Taha SA, Fields HL. Encoding of palatability and appetitive behaviors by distinct neuronal populations in the nucleus accumbens. J Neurosci. 2005;25:1193–1202. doi: 10.1523/JNEUROSCI.3975-04.2005. [DOI] [PMC free article] [PubMed] [Google Scholar]
- Taha SA, Fields HL. Inhibitions of nucleus accumbens neurons encode a gating signal for reward-directed behavior. J Neurosci. 2006;26:217–222. doi: 10.1523/JNEUROSCI.3227-05.2006. [DOI] [PMC free article] [PubMed] [Google Scholar]
- Tehovnik EJ. Electrical stimulation of neural tissue to evoke behavioral responses. J Neurosci Methods. 1996;65:1–17. doi: 10.1016/0165-0270(95)00131-x. [DOI] [PubMed] [Google Scholar]
- Wilson CJ, Groves PM. Spontaneous firing patterns of identified spiny neurons in the rat neostriatum. Brain Res. 1981;220:67–80. doi: 10.1016/0006-8993(81)90211-0. [DOI] [PubMed] [Google Scholar]
- Wilson DI, Bowman EM. Nucleus accumbens neurons in the rat exhibit differential activity to conditioned reinforcers and primary reinforcers within a second-order schedule of saccharin reinforcement. Eur J Neurosci. 2004;20:2777–2788. doi: 10.1111/j.1460-9568.2004.03747.x. [DOI] [PubMed] [Google Scholar]
- Wise RA. Addictive drugs and brain stimulation reward. Annu Rev Neurosci. 1996;19:319–340. doi: 10.1146/annurev.ne.19.030196.001535. [DOI] [PubMed] [Google Scholar]