

Abstract
Iodination of tyrosine residues in proteins has many uses in chemistry, biology, and medicine. Site specific identification of the sites of iodination is important for many of these uses. Reported herein is a facile method employing photodissociation and mass spectrometry to localize sites of iodination in whole proteins. Absorption of ultraviolet photons by iodotyrosine results in loss of iodine via homolytic bond dissociation. The resulting protein radical fragments in the vicinity of the iodotyrosine upon collisional activation. Analysis of the fragments within the vicinity of each tyrosine residue in the protein enables quantitative evaluation of the likelihood for iodination at each site. The results are compared with both traditional bottom up and top down mass spectrometric methods. Radical directed dissociation yields results in agreement with traditional approaches but requires significantly less effort and is inherently more sensitive. One limitation occurs when multiple tyrosine residues are in close proximity, in which case the extent of iodination at each residue may be difficult to determine. This limitation is frequently problematic for traditional approaches as well.
Introduction
Iodination of proteins at tyrosine residues is arguably one of the simplest chemical modifications that can be carried out on such complex biological molecules. In fact, this modification was first reported in the 1800s, well before the true nature and structure of proteins was completely understood. Through the years tyrosine iodination has been employed for a variety of purposes. Iodination can be utilized to incorporate radioactive isotopes for tracing in biological samples1 or for cancer treatments.2 Iodine is a heavy element and can be used to assist phasing assignments in x-ray crystallography experiments.3 The selective, accessibility based reactivity of iodine with tyrosine assists the reproducible labeling needed for ordered crystals in these experiments. To a first approximation, the rate of iodination at any given tyrosine residue is dependent on the degree to which that residue is exposed to solvent and the reactive iodinating reagent.4 This structural based reactivity is increasingly being utilized for mapping surface structure in proteins, which has only become feasible with recent advances in mass spectrometry (MS) that can more easily identify modified residues.5
Soft ionization techniques coupled with MS have transformed protein characterization chemistry. The level of detail which can now be readily extracted from proteins and peptides far surpasses what was possible a few decades ago. For example, sequence assignment of unmodified peptides and proteins, which was once an onerous task, is now routine if the genome is known. Post translational modifications (PTMs) introduce additional complexities and often require extra time or attention, but can normally still be successfully characterized in most instances. Iodination at tyrosine is both a biologically relevant6 and chemically useful PTM.1-5
Site localization of iodination by MS would typically follow one of two pathways. In the first, a protein would be enzymatically digested into peptides, which would be individually analyzed for modifications. This bottom up approach is desirable because peptides are more amenable to liquid separations than proteins and sequencing peptides is easier than sequencing whole proteins. Unfortunately, the process of digestion frequently leads to the loss of many peptides, some of which may be important. The second typical method employed attempts direct analysis of the intact protein itself and is referred to as the top down approach. Top down MS is advantageous because no part of the protein is lost prior to examination. Nevertheless, full sequence analysis for whole proteins is difficult to achieve and is frequently complicated by incomplete fragmentation which can lead to ambiguous site assignments. Sensitivity can also be an issue because whole proteins are frequently more difficult to ionize, populate numerous charge states, and can fragment into hundreds of product ions.
One strategy for overcoming some of the difficulties associated with fragmenting whole proteins is to introduce chemistry which directs fragmentation to specific, targeted sites to yield the desired information. For example, if one desires to identify a PTM, chemistry would be introduced to cleave the protein at the specific PTM. This approach has already been demonstrated for peptide phosphorylation.7 However, the advantages of such an approach are even more compelling for whole proteins. For example, if a 100 residue protein with a single PTM at one residue were evaluated by electron capture dissociation (ECD), then complete sequence coverage would be desirable and with partial overlap of c and z ions in addition to side chain losses and b and y ions, it is reasonable to suggest that 150 product peaks could be generated. In the ideal case, at best four peaks among the 150 would contain information identifying the site of modification. (The relevant peaks would be the two on either side of a shift in mass from modified to unmodified fragments for either the c or z ion series.) In contrast, the ideal selective fragmentation scenario yields only two peaks, both of which are informative. By preventing dilution of the ion intensity into ~145 uninformative channels, substantial gains in sensitivity are expected. In addition, selectivity affords tremendous simplicity in data analysis because the desired information is directly revealed.
In the present work, we demonstrate that UV photodissociation which selectively targets iodinated tyrosine residues can be used to identify sites of iodination in whole proteins. Radical directed dissociation (RDD) occurs at and in the vicinity of the labeled tyrosine residues. High charge states are evaluated to limit radical transfer to sequence-remote portions of the protein. The method is compared with bottom up and top down approaches, which are both substantially more labor intensive. Where modification sites were able to be determined, agreement between all three methods was obtained. Frequently, one or more of the methods was unable to unambiguously identify the site of modification. The structural sensitivity of iodination was also explored using this facile new site identification method. It is clear that iodination can be used to quickly gather course level information about changes in protein structure.
Experimental Methods
Materials
The proteins ubiquitin (bovine), myoglobin (horse heart), cytochrome c (horse heart), lysozyme (chicken egg), hemoglobin (human) and chemicals dithiolthreitol, iodoacetamide were purchased from Sigma Aldrich (St. Louis, MO). Trypsin (modified) was purchased from Roche (Palo Alto, CA). Water was purified to 18.2 MΩ resistivity by a Millipore Direct-Q (Millipore, Billerica, MA). Dialysis membrane (MWCO=3500Da) and clips were purchased from Spectra Por (Rancho Dominguez, CA). Sodium iodide, chloramine-T, sodium metabisulfite and all the other chemicals and solvents were purchased from Fisher Scientific (Fairlawn, NJ). All the chemicals and reagents were used without purification unless notified.
Preparation of iodinated proteins
Proteins were iodinated at room temperature using a previously published method.8 Sodium iodide and chloramine-T were used as iodination reagents and the iodination reaction was quenched by addition of excess sodium metabisulfite. Stoichiometric quantities of iodination reagents were used to avoid protein oxidation and limit extent and heterogeneity of iodination (1:2:2:3 molar ratio of protein: sodium iodide: chloramine-T: sodium metabisulfite). Due to different three-dimensional structures of proteins, iodination reaction time was optimized for each protein to ensure at least 50% yield of monoiodinated protein. Iodinated proteins were purified by removal of excess iodination reagents via membrane dialysis against water.
Iodination of denatured myoglobin
Myoglobin was incubated in 6M guanidine hydrochloride solution containing 50mM ammonium bicarbonate buffer at 50°C for 3 hours.9 Iodination of denatured myoglobin was not performed until the protein solution was completely cooled to room temperature. The same iodination conditions as used for iodination of folded myoglobin were used in the presence of 6M guanidine buffer solution. Excess reagents were removed from myoglobin solution by membrane dialysis against water overnight.
Enzymatic digestion of proteins
1nmol of each purified iodinated protein was dissolved in 50μl of 50mM sodium bicarbonate buffer respectively (pH~8.5). Endopeptidase trypsin was added to each iodo-protein buffer solution. The ratio between protein and trypsin was 50:1 (by weight). Iodo-protein solutions containing trypsin were incubated at 37°C overnight. Enzymatic digestion was quenched by addition of 1μl trifluoroacetic acid (TFA). Enzymatic digested proteins were lyophilized and reconstituted in water with 0.1% TFA for further MALDI-MS analysis.
MALDI-MS/MS analysis of digested iodinated proteins
Tryptic digested iodinated proteins were analyzed with an Applied Biosystems (Foster City, CA) QSTAR XL quadrupole/time-of-flight mass spectrometer with an o-MALDI ion source (W. M. Keck Proteomics Laboratory/Center for Plant Cell Biology, Institute for Integrative Genome Biology, University of California, Riverside). Digested iodo-proteins were firstly desalted with zip tips (Millipore, Billerica, MA) with C18 bedding, and then spotted onto a MALDI plate. α-Cyano-4-hydroxycinnamic acid (CHCA) was used as the matrix for MALDI-MS analysis. The iodinated tryptic peptides of each iodinated protein were sequenced by MALDI-MS/MS to elucidate the exact iodinated site. Collision energy used for MS/MS experiment varied from 50 to 75 eV depending on peptide sequences in order to achieve sufficient fragmentation.
Photodissociation/collision induced dissociation (PD/CID) of iodinated proteins
7μM iodinated protein solutions in 50%/50% acetonitrile/H2O with 0.1% acetic acid were directly infused into an LTQ linear ion trap mass spectrometer (Thermo Fisher Scientific, San Jose, CA) with a standard ESI source. The posterior plate of the LTQ was modified with a quartz window to transit fourth harmonic (266nm) laser pulses from a flash lamp pumped Nd/YAG laser (Continuum, Santa Clara, CA). The pulses were synchronized to the end of the isolation step of a typical MS2 experiment by sending a TTL trigger signal to the laser from the mass spectrometer via a digital delay generator (Berkeley Nucleonics, San Rafael, CA). 10,12 The timing for this trigger is controllable in the diagnostics window of the standard operating software from Thermo. The isolation window width of MS2 and MS3 experiments was set to 5 Da.
Collision induced dissociation (CID) and electron capture dissociation (ECD) of iodinated proteins
CID and ECD of monoiodinated proteins were acquired using a 7T linear ion trap Fourier transform (LTQ-FT Ultra) mass spectrometer (Thermo Scientific, San Jose, CA) with ESI. The isolation window width for CID and ECD of iodinated proteins was set to 3 m/z-units. The excitation time period of ECD was optimized for each protein to maximize ECD fragmentation. Mass errors for protein fragments analyzed by the LTQ-FT were found to be no more than 4ppm.
Data analysis
Protein fragments were assigned with the aid of UCSF protein prospector v 5.3.0 and Fragmentor software (v. 1.0.0.3; http://faculty.ucr.edu/ ryanj/fragmentor.html). Nomenclature for protein fragments was adopted from previous literature.11
Results and Discussion
Previous experiments employing photodissociation coupled with collision induced dissociation demonstrated selective fragmentation in the vicinity of tyrosine residues for several monoiodinated proteins,12 and these results suggest that RDD may be an attractive approach for the facile identification of sites of iodination in proteins. In Figure 1a, the full mass spectrum of iodinated ubiquitin (Ubi) is shown. The numbers in Figure 1a indicate charge state and number of attached iodines. For example, 10-1 represents the +10 charge state of monoiodinated ubiquitin, or ([IUbi+10H]+10). Iodination is intentionally restricted to yield primarily the monoiodo-species in order to avoid protein oxidation and heterogeneity. Ubiquitin contains only a single tyrosine, which can be singly or doubly iodinated. PD of isolated [IUbi+10H]+10 ions by exposure to 266nm ultra violet (UV) light is shown in Figure 1b. The only significant product is [Ubi•+10H]+10, generated by a loss of 126 Da from the precursor ion. This loss is due to homolytic C-I bond cleavage as reported previously.12 The intensity of the radical product produced by PD is ~50% of the precursor ion intensity, which corresponds to a conversion yield of ~33%. The high radical yield suggests iodination at tyrosine rather than histidine, which typically produces no more than 10% radical relative to the precursor ion intensity.13 This conclusion was verified by CID of [IUbi+10H]+10, which confirms that Tyr59 is exclusively iodinated (see Supporting Information). In Figure 1c, the MS3 CID spectrum for [Ubi•+10H]+10 is shown. The most intense fragment in Figure 1c corresponds to a loss of 106 Da, which is due to side chain loss from Tyr59.14 Backbone cleavage products are also present and primarily include a-, c- and z-type fragments which are signatures for RDD.12,15 A few typical proton catalyzed fragments are present as well. The majority of the RDD associated peaks yield fragmentation of the ubiquitin backbone in close proximity to Tyr59 (vide infra).
Figure 1.

(a) Full ESI mass spectrum for iodinated ubiquitin. (b) Photodissociation of +10 charge state of monoiodo-ubiquitin. (c) CID spectrum of ubiquitin radical ([Ubi•+10H]+10) generated by PD step, the -106 peak is due to tyrosine side chain loss. (d) CID spectrum of -106 fragment in (c).
The highly abundant loss of 106Da from tyrosine will initially create a radical at the α-position of Tyr59, which may lead to subsequent selectivity. This possibility was explored by collisionally activating the [Ubi•+10H-106]+10 ion (MS4) as shown in Figure 1d. In contrast to the results shown in Figure 1c, b- and y-type ions are the dominant fragments, suggesting that proton initiated fragmentation is more competitive in this case. Interestingly, a58+7 and a60-106+7 are the only two abundant RDD type fragments observed, and they correspond to dissociation from both residues flanking Tyr59. The results suggest that the α-radical generated by tyrosine side chain loss is much less reactive than the radical initially generated by loss of iodine, in agreement with predicted reactivities.15 In this situation, the reduced reactivity yields increased selectivity for the RDD fragments, and greatly facilitates identification of the initially iodinated tyrosine residue.
To facilitate inspection of the results, a normalized histogram of unique RDD fragments is plotted as a function of sequence in Figures 2a and 2b for the precursor radical and tyrosine side chain loss radical, respectively. In Figure 2a, dissociation is concentrated at residues in close sequence proximity to Tyr59, within the region between Glu51 and Glu64. The histogram in Figure 2b for the Tyr-side chain loss radical shows fragmentation to be limited to residues immediately adjacent to Tyr59. For comparison, the RDD histogram for [Ubi•+6H]+6 is shown in Figure 2c. Although fragmentation is still most abundant in the vicinity of Tyr59, there is also sequence remote fragmentation. It is well known that the gas phase structures of proteins are highly dependent on charge state, with higher charge states always yielding more extended structures.16 The +6 charge state of ubiquitin has a more compact structure than the +10 charge state.17 The compact structure facilitates through space radical transfer, which can in fact be utilized to examine protein structure, if desired.18 In order to limit sequence remote radical migration, which is undesirable for the goals of the present study, high charge states will be exclusively examined for the proteins herein. As a general rule, this involves selection of the highest observed charge state which also has sufficient signal intensity for MSn experiments.
Figure 2.

Histograms of normalized RDD fragments of ubiquitin in different charge states: (a) +10 charge state parent radical, (b) +10 charge state tyrosine side chain loss radical, (c) +6 charge state illustrating through space radical migration for more compact structures. (d) Histogram of dissociation proximity to iodinated tyrosine residues for all proteins investigated in the present work.
Tyrosine iodination probability score
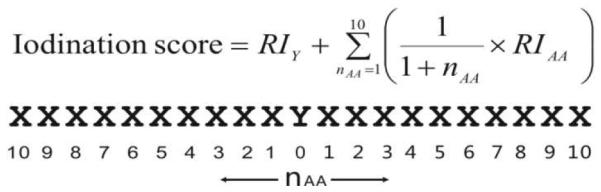
To quantitatively estimate the probability for iodination at different tyrosine residues within a protein, an iodination score for each tyrosine residue was calculated according to the equation illustrated in Scheme 1. In this equation, RI stands for relative intensity, n represents the amino acid position relative to tyrosine in either the N- or C-terminal direction, and the subscripts Y and AA represent tyrosine and any other amino acid, respectively. The iodination score then is simply the weighted sum of the relative intensity of fragments observed at tyrosine and the ten adjacent amino acids in either direction. There is a weighting factor which reduces the relative importance of each amino acid going away from the central tyrosine. The selection of ten residues is based on the data shown in Figure 2d, illustrating that for all proteins examined herein fragmentation is typically observed within ten residues of tyrosine. In general, an iodination score over 60 will indicate a high likelihood for iodination at a tyrosine, with the exception occurring for multiple tyrosine residues that are in close sequence proximity (see below).
Scheme 1.
Myoglobin (Myo)
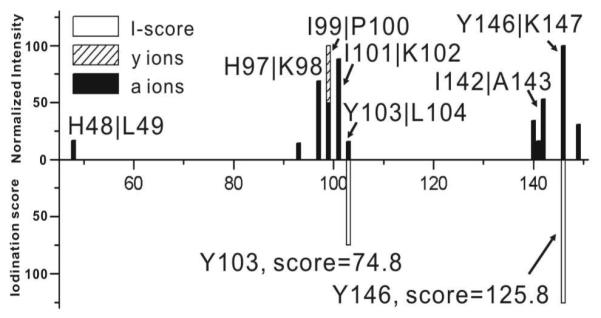
RDD results for [Myo•+15H]+15 are summarized in the upper histogram of Figure 3a. The iodination scores for each tyrosine residue are projected down at the appropriate sequence location in Figure 3a. All RDD fragments are localized within 10 residues from Tyr103 except for one low abundance fragment at His48. Tyr103 and Tyr146 are the only two tyrosines present in myoglobin, and the results indicate that Tyr103 is most likely iodinated (in agreement with previous literature19). To verify this conclusion, iodinated myoglobin was also examined with conventional mass spectrometry based methods. The full MALDI mass spectrum for trypsin digested myoglobin is shown in Figure 3b. Importantly, the digestion comes from a mixture of unmodified, singly, and doubly iodinated protein because separation of these species is exceedingly difficult. Therefore, the data in Figure 3b represent contributions from all three of these species, whereas the data in Figure 3a examine only the monoiodinated protein. As seen in Figure 3b, the tryptic peptide Y103-K118 exists in all three iodination states. By comparing the relative intensities of the iodination states for Y103-K118 to the relative intensities of the iodination states for the whole protein (see Supporting Information), it is clear that very similar ratios are observed. This suggests that iodination occurs primarily on the Y103-K118 portion of the protein. Further MS/MS experiments confirm Tyr103 as the exclusive site of iodination within this peptide. A tryptic peptide including Tyr146 was not observed by MALDI-MS, possibly due to the short anticipated peptide sequence (Y146-K147). Therefore, it is not possible to unambiguously exclude the possibility for iodination at this residue with this bottom up approach.
Figure 3.

(a) Histogram of CID of [Myo•+15H]+15 (top) and I-scores for Tyr103 and Tyr146 (bottom). (b) MALDI-MS analysis of tryptic digest of iodinated myoglobin. (c)-(e) zoomed-in ECD spectrum of [IMyo+17H]+17.
In order to interrogate iodination at Tyr146, top-down methods were employed. [IMyo+17H]+17 was isolated and subjected to ECD, and several key fragments are highlighted in Figures 3c-3e. The z18+2 ion containing Tyr146 is detected as shown in the left part of Figure 3c. However, the iodinated version of z18+2 is not observed as shown on the right side of Figure 3c, confirming that Tyr146 is not iodinated to any significant extent. Histidine is not easily iodinated if the pH is below 8.5 and therefore typically reacts 30-100 times slower than tyrosine.20,21 Nevertheless, fragmentation in the vicinity of histidine at His48 and His97 suggests that further inspection is warranted in the case of myoglobin. In Figure 3d, the extent of iodination for the c98+11 fragment is shown. This fragment includes eight histidine residues, but the ECD data suggests that no significant iodination occurs at His 48 or His97, which is also consistent with the high PD yield (50.3 % relative intensity). The abundant fragmentation at His97 is attributed to the fact that RDD is facile at aromatic residues, as established in previous work.14,15 Finally, examination of the results shown in Figure 3e reveals that the c105+11 fragment, which contains Tyr103, is fully iodinated as expected.
α-chain of Hemoglobin (Hba)
The α-chain of hemoglobin contains three tyrosine residues. In Figure 4a, the RDD results derived from [Hba•+12H]+12 are shown with the accompanying iodination scores. For Hba, dissociation is observed in two distinct regions centered on Tyr24 and Tyr140. An iodination score of 111 strongly suggests that Tyr140 is the primary site of iodination. The presence of several fragments in the vicinity of Tyr24 suggests that it may be a secondary site of iodination. The relative iodination scores (111/19), suggests that Tyr24 is not significantly iodinated.
Figure 4.

(a) Histogram of CID fragments of [Hba•+12H]+12 (top) and I-scores for Tyr24, Tyr42 and Tyr140 (bottom). (b) MALDI-MS of tryptic digest of iodinated Hba. (c) zoomed in portion of ECD spectrum for [IHba+15H]+15. (d) zoomed in portion of CID spectrum for [IHba+15H]+15 (e) another portion of the CID spectrum illustrating that iodination cannot be quantified from CID fragments.
In order to investigate the matter further, both bottom-up and top-down methods were utilized. In Figure 4b, the MALDI-MS spectrum of trypsin digested iodinated Hba is shown. Again, the digestion contains peptides from all states of iodination for Hba. Iodinated peptides containing Tyr24 and Tyr42 are both detected, although the extent of iodination for Tyr24 is much greater than Tyr42. For Tyr42, it is clear that very minimal iodination occurs. For Tyr24, the results are ambiguous. At most, ~28% of Tyr24 may be iodinated; however, since contributions from the doubly iodinated protein may contribute to this number, the actual percentage may be substantially lower. A peptide containing Tyr140 was not observed. The bottom up results are again incomplete, and so top down experiments were performed. In Figure 4c, results from ECD illustrate that the c35+4 ion exists in both iodinated and unmodified forms. This confirms Tyr24 as a site of iodination and also indicates a secondary site. Unfortunately, the degree of iodination for different fragments containing Tyr24 are not consistent with each other, meaning that the data in Figure 4c cannot be used to quantify the degree of iodination. CID experiments yield both y23+2 and Iy23+2 fragments as shown in Figure 4d, confirming partial iodination of Tyr140. Unfortunately, CID does not provide quantitative information on the extent of iodination either (compare Figure 4d and 4e). The cause is most likely due to the low signal to noise ratios for the relevant fragment ions. It is also possible that iodine may be differentially lost during the excitation process. In this case, the RDD results are the least ambiguous and indicate that Tyr140 is the primary site for iodination, followed by Tyr24.
Cytochrome c (Cytc)
Cytc has four tyrosine residues which can potentially be iodinated. RDD results and iodination scores for [Cyt c+15H•]+15 are illustrated in Figure 5a. Only five fragments are observed in total and four of them are within 5 residues of Tyr74. It is clear that Tyr74 and Tyr97 are the most likely and unlikely sites for iodination, respectively. An iodination score of 109 for Tyr74 suggests it is the primary iodination site, in agreement with previous investigations.22-24 The score of zero for Tyr97 clearly indicates that it is not iodinated. A single fragment is detected in the vicinity of Tyr48, resulting in a iodination score of 9; therefore, it is unlikely that Tyr48 is significantly iodinated. The iodination propensity for Tyr67 is ambiguous because of its close proximity to Tyr74. When two tyrosine residues are within 10 amino acids, the fragments from one tyrosine can contribute to the iodination score of the other. This is an inherent limitation of the RDD approach; although, it should be mentioned that residues which are near in sequence present challenges for the standard bottom up and top down approaches as well.
Figure 5.

(a) Histogram of [Cyt c•+15H]+15 RDD fragments (top) and I-score values for Tyr48, Tyr67, Tyr74 and Tyr97 (bottom). (b)-(d) zoomed in ECD spectrum for [ICyt c+13H]+13. (e) zoomed-in CID spectrum for [ICyt c+13H]+13.
Bottom up methods cannot provide useful information for Cytc unless the singly/doubly/triply/etc…iodinated states can be separated from each other, which was not achieved. Therefore, [ICyt c+13H]+13 was subjected directly to ECD and CID to probe sites of iodination and the results are shown in Figures 4b-4e. On the left side of Figure 4b, the c48+5 ion which contains Tyr48 is detected only in the noniodinated form, suggesting that Tyr48 is not iodinated in Cytc. Similarly, detection of the c67+7 ion (Tyr67 included) and the y29+3 ion (Tyr97 included), but not the corresponding iodinated ions in Figures 4c and Figure 4e clearly confirms that neither Tyr67 or Tyr97 is iodinated to a significant extent. In contrast, Figure 4d illustrates detection of the iodinated fragment only for the c81+9 ion, which implies (in conjunction with the other spectra) that Tyr74 is exclusively iodinated. Tyr74 has the highest solvent accessibility among all the tyrosines in Cytc which should result in the highest iodination reactivity.25 Tyr97 is buried inside of Cytc and is not observed to be modified even under strongly iodinating conditions.5 RDD again correctly identifies the primary iodination site; however, examination of Cytc has revealed that RDD may not be able to distinguish iodination states for tyrosine residues within 10 amino acids of each other. Nevertheless, the lack of dissociation at Tyr67 itself and the absence of dissociation on the N-terminal side of Tyr67 both suggest that substantial iodination at this residue may not occur.
Lysozyme (Lyz)
Lysozyme contains three tyrosine residues, two of which are located within three residues of each other. In Figure 6a, RDD results are summarized for [Lyz•+14H]+14 and the corresponding iodination scores are given. Tyr53 has an iodination score of zero, suggesting that it is not iodinated. Almost all of the fragments observed are concentrated between Asn19 and Trp28, which contains both Tyr20 and Tyr23. Both residues have comparably high iodination scores, although Tyr23 scores slightly higher. These two residues are in very close proximity and RDD cannot be used to distinguish whether both or only one of them is iodinated.
Figure 6.

(a). Stack plot of [Lyz•+14H]+14 RDD fragments (top) and I-score information of Tyr20, Tyr23 and Tyr53 (bottom). (b) MALDI-MS analysis of tryptic digest of iodinated Lyz. (c) zoomed-in CID spectrum of [Lyz•+14H]+14.
In order to further investigate iodination for Lyz, traditional bottom up and top down methods were employed. The results from a tryptic digest of the iodinated protein mixture are shown in Figure 4b. The peptide H15-R21 (containing Tyr20) is detected in low abundance and the monoiodinated species of this peptide is not observed. However, given the signal/noise ratio for the spectrum in the region of interest, it is not possible to conclude that Tyr20 is not iodinated to some extent. The mono- and di-iodo Tyr23 containing peptide (G22-K32) is detected with a 0.4:1:0.6 ratio between the unmodified, mono-, and di-iodo peptides. This ratio is consistent with the iodination extent ratio for the whole protein, suggesting that Tyr23 is the primary site for iodination. However, Tyr53 is slightly iodinated in the digested mixture, highlighting the difficulty with trying to quantitate results using bottom up methods.
CID fragmentation of the whole protein yields a y80+8 fragment which contains a Tyr53. The monoiodinated version of y80+8 is not observed, confirming the results obtained by RDD. Iodination for Tyr20 and Tyr23 is not revealed by either CID or ECD with the top-down MS method because fragmentation does not occur between these residues. In the case of Lyz, none of the three methods employed yields completely unambiguous results, highlighting the challenges which can be encountered in the determination of iodination or other post-translational modifications. However, it is also clear that examination by multiple techniques is important in such cases since the combination of information from each may indicate a clear conclusion. Examination of all of the results reveals that Tyr23 is the primary site of iodination, Tyr53 is not iodinated, and Tyr20 is iodinated at most to a very limited extent. It should be mentioned that the solvent accessibilities in the crystal structure for Tyr20 and Tyr23 are very similar.26 The differential iodination must therefore be explained in terms of reactivity rather than accessibility. Thus, caution is suggested when attempting to attribute the degree of iodination to the relative solvent accessibility.
Examination of Protein Structure
If indeed the extent of iodination is subject to protein structure, and the RDD data are representative of the extent of iodination, then changes to protein structure while iodination is carried out should be manifest in the RDD spectrum. To examine this possibility, myoglobin was iodinated under denaturing conditions. The same +15 charge state [Myo•+15H]+15 as probed previously in Figure 3 was examined again and the results are shown in Figure 7. Comparison of the two spectra immediately reveals substantial differences. The iodination score for Tyr103 did not change substantially (62→75), suggesting that it is still a likely site for iodination. The iodination score for Tyr146 shifted substantially (0→126). Denaturation of the protein clearly exposes Tyr146 to solvent and enables iodination to occur. These results confirm that iodination is sensitive to protein structure and that RDD spectra are representative of the iodination state of a protein.
Figure 7.
Fragment stack plot of RDD results for denatured Myoglobin, [DMyo•+15H]+15. Comparison with the data in Figure 3 reveals significant differences, confirming the structural sensitivity of iodination and the utility of RDD for iodination site identification.
Conclusion
Iodination of proteins is facile and has been used for a variety of purposes in numerous fields for over a century. Identification of the sites of iodination is essential for many of these applications, particularly where protein structure is important or where structural characterization is desired. Nevertheless, characterization is frequently nontrivial for these complex molecules. We have demonstrated that the site specificity of photodissociation can be used to generate radicals at iodinated tyrosine residues and that subsequent heating of these radicals leads to fragmentation primarily in the vicinity of the iodinated tyrosine. The highest charge states with reasonable ion intensity are examined to avoid complications arising from radical migration facilitated by protein tertiary structure. Radical initiated tyrosine side chain loss, when present in sufficient yield to allow further analysis, also yields very selective backbone fragmentation following collisional activation and offers another means for iodination site identification in addition to direct backbone dissociation. In the majority of cases, the site of iodination can be easily identified with these RDD tools. One limitation occurs when two tyrosine residues are in close proximity, in which case iodination will be identified if either residue is modified, but discrimination of the degree of iodination for each residue is difficult. If neither tyrosine is modified, sequence proximity is not problematic. Importantly, a localized region (within approximately ten residues) where iodination occurs is still identified even if multiple tyrosines are present. The primary advantage of this method over bottom up approaches is that a specific protein iodination state is examined and the experiments are rapid and the results easily analyzed. Specificity is the main advantage over top down MS methods, which enhances sensitivity and ensures cleavage of bonds in the region of interest. The discovery of this method should greatly facilitate the use of iodination chemistry in several possible applications such as: 1) examination of course grain protein structure, 2) as a means for mapping out protein-protein interactions, 3) the facile identification and localization of naturally occurring PTMs such as iodotyrosine or bromotyrosine.
Supplementary Material
Acknowledgments
RRJ gladly acknowledges funding from the National Science Foundation (CHE-074748). JAL acknowledges support from the National Institutes of Health (RR 20004) and the NIH/NCRR High-End Instrumentation Program (S10 RR023045).
Footnotes
Supporting Information Available. Raw mass spectra and other additional information are available free of charge online.
References
- 1.Wright PJ, di Mayorca G. J. Virol. 1976;19:750–755. doi: 10.1128/jvi.19.2.750-755.1976. [DOI] [PMC free article] [PubMed] [Google Scholar]
- 2.Becker S, Laffont S, Vitry F, Rolland Y, Lecloirec J, Boucher E, Raoul JL, Herry JY, Bourguet P, Garin E. Nuc. Med. Commun. 2008;29(9):815–825. doi: 10.1097/MNM.0b013e32830439c6. [DOI] [PubMed] [Google Scholar]
- 3.Dauter Z, Dauter M, Rajashankar KR. Acta. Crystallogr. D. Biol. Crystallogr. 2000;56:232–237. doi: 10.1107/s0907444999016352. [DOI] [PubMed] [Google Scholar]
- 4.Wolff J, Covelli I. Biochemistry. 1966;5:867–871. doi: 10.1021/bi00867a009. [DOI] [PubMed] [Google Scholar]
- 5.Santrucek J, Strohalm M, Kadlcik V, Hynek R, Kodicek M. Biochem. Biophys. Res. Commun. 2004;323:1151–1156. doi: 10.1016/j.bbrc.2004.08.214. [DOI] [PubMed] [Google Scholar]
- 6.Seed RW, Goldberg IH. Science. 1965;149:1380–1382. doi: 10.1126/science.149.3690.1380. [DOI] [PubMed] [Google Scholar]
- 7.Diedrich JK, Julian RR. J. Am. Chem. Soc. 2008;130:12212–12213. doi: 10.1021/ja8023719. [DOI] [PubMed] [Google Scholar]
- 8.Regoeczi E. Iodine-Labeled Plasma Proteins. CRC Press; Boca Raton, FL: 1984. [Google Scholar]
- 9.Pace C, Nick, Vanderburg, Keith E. Biochemistry. 1979;18:288–292. doi: 10.1021/bi00569a008. [DOI] [PubMed] [Google Scholar]
- 10.Kim TY, Thompson MS, Reilly JP. Rapid Commun. Mass Spectrom. 2005;19:1657–1665. doi: 10.1002/rcm.1969. [DOI] [PubMed] [Google Scholar]
- 11.Roepstorff P, Fohlman J. Biomed. Mass Spectrom. 1984;11:601–601. doi: 10.1002/bms.1200111109. [DOI] [PubMed] [Google Scholar]
- 12.Ly T, Julian RR. J. Am. Chem. Soc. 2008;130:352–358. doi: 10.1021/ja076535a. [DOI] [PubMed] [Google Scholar]
- 13.Liu Z, Julian RR. J. Am. Soc. Mass Spectrom. 2009;20:965–971. doi: 10.1016/j.jasms.2008.12.014. [DOI] [PubMed] [Google Scholar]
- 14.Ly T, Julian RR. J. Am. Soc. Mass Spectrom. 2009;20:1148–1158. doi: 10.1016/j.jasms.2009.02.009. [DOI] [PubMed] [Google Scholar]
- 15.Sun Q, Nelson H, Ly T, Stoltz BM, Julian RR. J Proteome Res. 2008;8:958–966. doi: 10.1021/pr800592t. [DOI] [PubMed] [Google Scholar]
- 16.Shelimov KB, Clemmer DE, Hudgins RR, Jarrold MF. J. Am. Chem. Soc. 1997;119:2240–2248. [Google Scholar]
- 17.Myung S, Badman ER, Lee Y, Clemmer DE. J. Phys. Chem.A. 2002;106:9976–9982. [Google Scholar]
- 18.Ly T, Julian RR. submitted for publication.
- 19.Iniesta J, Cooper HJ, Marshall AG, Heptinstall J, Walton DJ, Peterson IR. Arch. Biochem. Biophys. 2008;474:1–7. doi: 10.1016/j.abb.2008.02.032. [DOI] [PMC free article] [PubMed] [Google Scholar]
- 20.Miyashita M, Yamashita S. J. Chromatogr. 1989;475:135–144. [Google Scholar]
- 21.Ramachandran LK. Chem. ReV. 1956;56:109–218. [Google Scholar]
- 22.Amico V, Fotit S, Saletti R, Cambria A, Petrone G. Biomed Environ Mass Spectrom. 1988;16:431–437. doi: 10.1002/bms.1200160185. [DOI] [PubMed] [Google Scholar]
- 23.McGowan EB, Stellwagen E. Biochemistry. 1970:3047–3053. doi: 10.1021/bi00817a017. [DOI] [PubMed] [Google Scholar]
- 24.Osheroff N, Feinberg BA, Margoliash E. J. Biol. Chem. 1977;252:7743–7751. [PubMed] [Google Scholar]
- 25.Sokolovsky M, Aviram I, Schejter A. Biochemistry. 1970;9:5113–5118. doi: 10.1021/bi00828a011. [DOI] [PubMed] [Google Scholar]
- 26.Diamond R. J. Mol. Biol. 1974;82:371. doi: 10.1016/0022-2836(74)90598-1. [DOI] [PubMed] [Google Scholar]
Associated Data
This section collects any data citations, data availability statements, or supplementary materials included in this article.