

Summary
Objectives
Adverse drug reactions (ADR) are an important cause of morbidity and mortality. We analysed trends in hospital admissions associated with ADRs in English hospitals between 1999 and 2008.
Design
Data from the Hospital Episode Statistics database were examined for all English hospital admissions (1999–2008) with a primary or secondary diagnosis of an ADR recorded.
Setting
All NHS (public) hospitals in England.
Main outcome measures
The number of admissions and in-hospital mortality rate with a primary (codes including ‘adverse drug reaction’, ‘drug-induced’, ‘due to drug’, ‘due to medicament’ or ‘drug allergy’) or secondary diagnosis of ADR (ICD-10 Y40-59) were obtained and analysed. Further analysis for the year 2008–2009 was performed with regard to age, gender, proportion aged >65 yrs and total bed-days.
Results
Between 1999 and 2008, there were 557,978 ADR-associated admissions, representing 0.9% of total hospital admissions. Over this period the annual number of ADRs increased by 76.8% (from 42,453 to 75,076), and in-hospital mortality rate increased by 10% (from 4.3% to 4.7%). In 2008, there were 6,830,067 emergency admissions of which 75,076 (1.1%) were drug-related. Systemic agents were most commonly implicated (19.2%), followed by analgesics (13.3%) and cardiovascular drugs (12.9%).There has been a near two-fold increase in nephropathy and cardiovascular consequences secondary to drugs and a 6.8% fall in mental and behavioural disorders due to drugs.
Conclusions
ADRs have a major impact on public health. Our data suggest the number of ADR admissions has increased at a greater rate than the increase in total hospital admissions; some of this may be due to improved diagnostic coding. However, in-hospital mortality due to ADR admissions also increased during the period. Our findings should prompt policymakers to implement further measures to reduce ADR incidence and their associated in-hospital mortality, and methods to improve the recording of ADRs.
Introduction
An adverse drug reaction (ADR) is an undesirable effect of a drug beyond its anticipated therapeutic effects occurring during clinical use,1 and is one of the major causes of iatrogenic disease.2 ADRs cause significant morbidity and mortality and increase the length of hospital stays. The economic burden of ADRs on the British NHS is also high, accounting for considerable extra NHS costs.3
ADRs may be on target (where there is a clear dose relationship) and may be reversible on reducing or withdrawing the drug,1,4 or off target (where there is uncertain dose response relationship). Idiosyncratic ADRs which are largely unpredictable, can depend on the genetic susceptibility of the individual and are often more serious (sometimes fatal). The benefit–harm relationships of ADRs are complex and should always be taken into account when prescribing.
From the patients' perspective, ADRs affects quality of life, confidence in treatment, influence adherence to medications, and increase costs of care.1 The manifestation of ADRs may also mimic a disease process and, therefore, lead to further investigations and treatments.
Older people or those with multiple long-term diseases are more susceptible to ADRs.5 As co-morbidity increases with increasing age, poly-pharmacy (use of more than four prescription drugs6) is seen more frequently in older patients.7,8 Moreover, between 14 and 24% of older adults receive potentially inappropriate medications.9 For example, long-acting benzodiazepines have a high potential for severe adverse outcomes in older patients, according to Beers criteria (a list of inappropriate medications for the elderly).10 Poly-pharmacy increases the likelihood of drug-drug interaction and adverse drug reactions.11 ADRs then in turn prompt the patient to seek further medical help and multiple primary and secondary care visits may ensue.12
Despite the clinical impact of adverse drug reactions, methods for monitoring them remained limited. Databases derived from electronic health records such as the General Practice Research Database (GPRD) or QResearch are also being increasingly used to monitor ADRs. Other approaches include: clinical trials, prescription event monitoring, spontaneous reporting, and linked administrative databases. However, where an ADR is rare, clinical trials lack power to detect associations. Prescription event monitoring examines risk in newly-marketed drugs but has a relatively short follow-up and difficulty in selecting appropriate controls. Spontaneous reporting is done through pharmacovigilance reporting such as the MHRA (Medicines and Healthcare Products Regulatory Agency) Yellow Card Scheme in the UK, although under-reporting remains a significant issue.
Consequently, when a drug is first marketed, there is often limited information about its safety in routine clinical use,13 although under the black triangle scheme new medicines are intensively monitored by the Commission on Human Medicines (CHM) and the MHRA. Drug safety assessment should be considered an integral part of everyday clinical practice,1 as well as necessity for phase IV (post-marketing surveillance) trials. Under such post-marketing surveillance, drugs continue to be withdrawn from the market due to safety concerns; for example, the withdrawal of rofecoxib in 200414 due to concerns about cardiovascular safety (MI and stroke) and, more recently, efalizumab in 2009, a recombinant humanized monoclonal antibody used to treat psoriasis, due to potential risk of progressive multifocal leukoencephalopathy (PML).
We analysed hospital admissions associated with ADRs in all NHS (public) English hospitals in the past 10 years, using the Hospital Episode Statistics database. We examined the epidemiology of hospital admissions for ADRs including temporal trends, in-hospital mortality, the age and gender distribution of these admissions, and differences in ADR rates between individual hospitals.
Methods
Hospital Episode Statistics (HES) is an administrative database produced by the Department of Health for England.15 It is available for every year from 1989 onwards and comprises data gathered locally from each NHS hospital's Patient Administration System or Hospital Information System.4 It covers all inpatient and day-case activity delivered by NHS hospitals in England, and contains demographic, administrative and clinical information. The data-set contains over 300 fields including age, gender, admission method, primary and secondary diagnosis fields, length of stay, and method of discharge (including in-hospital death). The basic unit of the data-set is the consultant episode, covering the continuous period of time during which a patient was under the care of one consultant. Episodes of care were linked into admissions and those ending in transfer to another hospital were linked together to avoid multiple counting. The 10th International Classification of Diseases (ICD-10) is used for diagnosis coding.
For each financial year from 1999–2000 to 2008–2009, we obtained HES records in which there was an ICD-10 code containing the following keywords: ‘adverse drug reaction’, ‘drug-induced’, ‘due to drug’, ‘due to medicament’ or ‘drug allergy’. For comprehensiveness, we also searched for ICD-10 codes relevant to ADRs containing the word ‘immunization’, since vaccines were considered as a form of medication. We then divided the main diagnostic codes into chapters based on ICD-10, as shown in Appendix 1 online (see http://jrsm.rsmjournals.com/cgi/content/full/103/6/239/DC1 ). We also analysed codes in the range Y40–59, which are known as ‘external cause’ codes or ‘secondary diagnoses’. In this way, we excluded accidental or intentional poisoning due to drugs. We analysed those codes that explicitly stated that the admission was caused by a certain drug.
HES records contain one main diagnosis code and 13 (six up to 2000) secondary diagnosis codes. We flagged all the emergency admissions with ADR-related ICD-10 codes in either the primary diagnoses or secondary diagnoses fields. We calculated the frequency of each three-digit external Y codes and of related ADRs ICD-10 codes of each chapter for each financial year. We excluded possible duplications in coding; an admission coding both ADR-related primary and secondary diagnoses is only counted once, as shown in Table 1. When analysed by individual ICD-10 chapters or categories in Tables 2–5, these admissions might be counted twice or more. However, the majority of the admissions (99.5% for year 2008–2009) only had one ADR-related ICD-10 code in their diagnosis.
Table 1.
Total number of emergency admissions for which there was a primary diagnosis or ‘external cause’ of ADR from 1999 to 2008
| Year | 1999–2000 | 2000–2001 | 2001–2002 | 2002–2003 | 2003–2004 | 2004–2005 | 2005–2006 | 2006–2007 | 2007–2008 | 2008–2009 | Change (%) 1999–2008 | Change (%) 2004–2008 |
|---|---|---|---|---|---|---|---|---|---|---|---|---|
| Total number of admissions | 5,321,796 | 5,319,791 | 5,337,034 | 5,494,066 | 5,818,057 | 6,116,507 | 6,423,646 | 6,496,945 | 6,560,785 | 6,830,067 | 28.3 | 11.7 |
| Number with drug-induced codes | 16,434 | 16,237 | 17,151 | 16,645 | 18,307 | 19,652 | 20,465 | 20,009 | 20,685 | 22,439 | 36.5 | 14.2 |
| Number with external cause codes | 31,486 | 32,641 | 33,842 | 36,617 | 41,722 | 44,745 | 50,063 | 53,198 | 56,883 | 63,583 | 101.9 | 42.1 |
| Total admissions due to ADRs | 42,453 | 43,288 | 45,518 | 47,455 | 53,218 | 56,629 | 61,931 | 64,536 | 67,874 | 75,076 | 76.8 | 32.6 |
| In-hospital mortality of ADR admissions | 1816 | 1879 | 2259 | 2480 | 2672 | 2679 | 2878 | 3013 | 3189 | 3534 | 94.6 | 31.9 |
| In-hospital mortality rate of ADR admissions | 4.3 | 4.3 | 5.0 | 5.2 | 5.0 | 4.7 | 4.6 | 4.7 | 4.7 | 4.7 | 10.0 | −0.5 |
Table 2.
Annual number of emergency admissions with a primary diagnosis for an ADR
| ICD-10 chapters | Description | 1999–2000 | 2000–2001 | 2001–2002 | 2002–2003 | 2003–2004 | 2004–2005 | 2005–2006 | 2006–2007 | 2007–2008 | 2008–2009 | Change (%) 1999–2008 | Change (%) 2004–2008 |
|---|---|---|---|---|---|---|---|---|---|---|---|---|---|
| D | Drug-induced anaemia | 155 | 138 | 145 | 162 | 143 | 316 | 259 | 178 | 194 | 247 | 59.4 | −21.8 |
| E | Drug-induced metabolic disorders | 857 | 824 | 821 | 954 | 1014 | 1125 | 1184 | 1218 | 1316 | 1561 | 82.1 | 38.8 |
| F | Mental and behavioural disorders due to drugs | 5937 | 5466 | 5517 | 5703 | 5905 | 6044 | 5989 | 5603 | 5399 | 5533 | −6.8 | −8.5 |
| G | Drug-induced neuromuscular disorders | 889 | 873 | 864 | 812 | 933 | 1042 | 1188 | 1266 | 1304 | 1578 | 77.5 | 51.4 |
| H | Drug-induced cataract and hearing loss | 27 | 12 | 10 | 10 | 21 | 28 | 31 | 40 | 22 | 42 | 55.6 | 50.0 |
| I | Cardiovascular consequences due to drugs | 1238 | 1387 | 1438 | 1483 | 1776 | 2076 | 2374 | 2492 | 2996 | 3399 | 174.6 | 63.7 |
| J | Drug-induced lung disorders | 64 | 48 | 53 | 88 | 80 | 103 | 101 | 123 | 110 | 157 | 145.3 | 52.4 |
| K | Toxic liver disease | 438 | 446 | 438 | 487 | 549 | 493 | 578 | 530 | 533 | 614 | 40.2 | 24.5 |
| L | Dermatitis due to drugs | 1870 | 1829 | 1866 | 1935 | 2183 | 2392 | 2719 | 2713 | 2842 | 3213 | 71.8 | 34.3 |
| M | Drug-induced immune disorders | 1946 | 2222 | 3307 | 2338 | 2298 | 2329 | 2361 | 2380 | 2497 | 2564 | 31.8 | 10.1 |
| N | Nephropathy due to drugs | 109 | 134 | 163 | 149 | 183 | 208 | 207 | 202 | 298 | 303 | 178.0 | 45.7 |
| T | Complications following injection, immunization or anaesthesia | 2956 | 2930 | 2614 | 2608 | 3322 | 3593 | 3589 | 3357 | 3289 | 3343 | 13.1 | −7.0 |
| Total | 16,486 | 16,309 | 17,236 | 16,729 | 18,407 | 19,749 | 20,580 | 20,102 | 20,800 | 22,554 | 36.8 | 14.2 |
Table 3.
Annual number of emergency admissions with an ‘external code’ for an ADR
| ICD-10 codes | Description | 1999–2000 | 2000–2001 | 2001–2002 | 2002–2003 | 2003–2004 | 2004–2005 | 2005–2006 | 2006–2007 | 2007–2008 | 2008–2009 | Change (%) 1999–2008 | Change (%) 2004–2008 |
|---|---|---|---|---|---|---|---|---|---|---|---|---|---|
| Y40 | Systemic antibiotics | 3364 | 3510 | 3439 | 3719 | 4446 | 5065 | 5738 | 5976 | 6297 | 6996 | 108.0 | 38.1 |
| Y41 | Other systemic anti-infectives and antiparasitics | 635 | 712 | 676 | 757 | 843 | 967 | 1064 | 1205 | 1241 | 1364 | 114.8 | 41.1 |
| Y42 | Hormones and their synthetic substitutes and antagonists | 2089 | 2154 | 2064 | 2371 | 2632 | 2785 | 3041 | 2101 | 3496 | 4352 | 108.3 | 56.3 |
| Y43 | Primarily systemic agents | 5143 | 5268 | 6162 | 6663 | 6892 | 7332 | 8447 | 9789 | 11,175 | 12,667 | 146.2 | 72.8 |
| Y44 | Agents primarily affecting blood constituents | 2939 | 2973 | 3083 | 3363 | 4003 | 2904 | 2993 | 2992 | 3055 | 3171 | 7.9 | 9.2 |
| Y45 | Analgesics, antipyretics and anti-inflammatory drugs | 4364 | 4385 | 4302 | 4788 | 5328 | 6078 | 7054 | 7375 | 7857 | 8747 | 100.4 | 43.9 |
| Y46 | Antiepileptics and anti-Parkinsonism drugs | 962 | 927 | 1004 | 1025 | 1106 | 1222 | 1296 | 1316 | 1354 | 1492 | 55.1 | 22.1 |
| Y47 | Sedatives, hypnotics and anti-anxiety drugs | 293 | 352 | 346 | 356 | 450 | 462 | 519 | 561 | 598 | 624 | 113.0 | 35.1 |
| Y48 | Anaesthetics and therapeutic gases | 185 | 194 | 151 | 167 | 208 | 206 | 265 | 248 | 289 | 350 | 89.2 | 69.9 |
| Y49 | Psychotropic drugs, not elsewhere classified | 1373 | 1563 | 1485 | 1469 | 1798 | 1935 | 1962 | 2133 | 2256 | 2422 | 76.4 | 25.2 |
| Y50 | Central nervous system stimulants, not elsewhere classified | 52 | 64 | 56 | 58 | 63 | 71 | 111 | 68 | 83 | 88 | 69.2 | 23.9 |
| Y51 | Drugs primarily affecting the autonomic nervous system | 1698 | 1834 | 1981 | 2135 | 2559 | 2866 | 3164 | 3178 | 3331 | 3591 | 111.5 | 25.3 |
| Y52 | Agents primarily affecting the cardiovascular system | 3587 | 4040 | 4164 | 4524 | 5147 | 5949 | 6588 | 7100 | 7723 | 8518 | 137.5 | 43.2 |
| Y53 | Agents primarily affecting the gastrointestinal system | 302 | 338 | 293 | 321 | 411 | 457 | 579 | 584 | 670 | 854 | 182.8 | 86.9 |
| Y54 | Agents primarily affecting water-balance and mineral and uric acid metabolism | 2081 | 2258 | 2613 | 3115 | 3833 | 4316 | 4946 | 5109 | 5115 | 5789 | 178.2 | 34.1 |
| Y55 | Agents primarily act smooth and skeletal muscle and respiratory system | 292 | 308 | 270 | 272 | 329 | 352 | 383 | 405 | 416 | 485 | 66.1 | 37.8 |
| Y56 | Topical agent primarily affecting skin/mucous membranes and opth/ot-rh-lary/dental drugs | 784 | 639 | 719 | 705 | 743 | 808 | 864 | 909 | 873 | 1020 | 30.1 | 26.2 |
| Y57 | Other and unspecified drugs and medicaments | 1297 | 1280 | 1346 | 1368 | 1448 | 1738 | 2115 | 2329 | 2543 | 2892 | 123.0 | 66.4 |
| Y58 | Bacterial vaccines | 297 | 218 | 160 | 172 | 311 | 250 | 172 | 178 | 163 | 153 | −48.5 | −38.8 |
| Y59 | Other and unspecified vaccines and biological substance | 329 | 266 | 222 | 217 | 340 | 359 | 380 | 331 | 336 | 412 | 25.2 | 14.8 |
| Total | 32,069 | 33,283 | 34,536 | 37,565 | 42,890 | 46,122 | 51,681 | 53,887 | 58,871 | 65,987 | 105.8 | 43.1 |
Table 4.
Number of HES emergency admissions with a primary diagnosis for an ADR in 2008–09: median age of admissions, old age and gender distribution of admissions, total bed-days and mortality
| ICD-10 chapters | Description | Total (%) | Men (%) | Median age | Age 65+(%) | Total bed-days | In-hospital mortality rate |
|---|---|---|---|---|---|---|---|
| D | Drug-induced anaemia | 1.1 | 44.1 | 68 | 57.1 | 2898 | 7.7 |
| E | Drug-induced metabolic disorders | 6.9 | 44.8 | 72 | 62.5 | 19,078 | 6.2 |
| F | Mental and behavioural disorders due to drugs | 24.5 | 68.9 | 33 | 3.5 | 94,579 | 1.0 |
| G | Drug-induced neuromuscular disorders | 7.0 | 44.4 | 70 | 60.7 | 32,389 | 6.7 |
| H | Drug-induced cataract and hearing loss | 0.2 | 42.9 | 52 | 28.6 | 454 | 4.8 |
| I | Cardiovascular consequences due to drugs | 15.1 | 46.5 | 78 | 80.5 | 36,430 | 3.8 |
| J | Drug-induced lung disorders | 0.7 | 55.4 | 73 | 68.2 | 2130 | 17.2 |
| K | Toxic liver disease | 2.7 | 42.7 | 43 | 24.4 | 10,430 | 11.4 |
| L | Dermatitis due to drugs | 14.2 | 41.2 | 60 | 41.9 | 42,801 | 4.2 |
| M | Drug-induced immune disorders | 11.4 | 56.4 | 69 | 60.9 | 31,518 | 12.5 |
| N | Nephropathy due to drugs | 1.3 | 58.1 | 66 | 55.8 | 4632 | 9.6 |
| T | Complications following injection, immunization or anaesthesia | 14.8 | 40.9 | 57 | 30.2 | 26,717 | 2.9 |
| Total | 22,554 | 100.0 | 51.4 | 59 | 41.5 | 302,574 | 4.8 |
Table 5.
Annual number of emergency admissions with an ‘external code’ for an ADR in 2008–09: median age of admissions, old age and gender distribution of admissions, total bed-days and mortality
| ICD-10 codes | Description | Total (%) | Men (%) | Median age | Age 65+(%) | Total bed-days | In-hospital mortality rate |
|---|---|---|---|---|---|---|---|
| Y40 | Systemic antibiotics | 10.6 | 40.5 | 64 | 47.4 | 82,684 | 4.3 |
| Y41 | Other systemic anti-infectives and antiparasitics | 2.1 | 30.6 | 64 | 49.1 | 15,620 | 2.8 |
| Y42 | Hormones and their synthetic substitutes and antagonists | 6.6 | 44.5 | 67 | 54.6 | 53,065 | 6.9 |
| Y43 | Primarily systemic agents | 19.2 | 42.5 | 61 | 38.2 | 112,667 | 5.4 |
| Y44 | Agents primarily affecting blood constituents | 4.8 | 46.2 | 76 | 75.9 | 45,865 | 9.4 |
| Y45 | Analgesics, antipyretics and anti-inflammatory drugs | 13.3 | 44.0 | 69 | 57.1 | 93,656 | 4.4 |
| Y46 | Antiepileptics and anti-Parkinsonism drugs | 2.3 | 48.0 | 64 | 49.2 | 22,488 | 2.1 |
| Y47 | Sedatives, hypnotics and anti-anxiety drugs | 0.9 | 44.6 | 66 | 49.7 | 8875 | 4.5 |
| Y48 | Anaesthetics and therapeutic gases | 0.5 | 44.9 | 44 | 27.7 | 2861 | 2.9 |
| Y49 | Psychotropic drugs, not elsewhere classified | 3.7 | 38.1 | 72 | 61.6 | 36,767 | 3.5 |
| Y50 | Central nervous system stimulants, not elsewhere classified | 0.1 | 53.4 | 49 | 35.7 | 822 | 3.4 |
| Y51 | Drugs primarily affecting the autonomic nervous system | 5.4 | 49.6 | 78 | 81.8 | 27,746 | 1.8 |
| Y52 | Agents primarily affecting the cardiovascular system | 12.9 | 53.1 | 78 | 81.3 | 80,570 | 3.3 |
| Y53 | Agents primarily affecting the gastrointestinal system | 1.3 | 37.2 | 75 | 62.2 | 8790 | 3.9 |
| Y54 | Agents primarily affecting water-balance and mineral and uric acid metabolism | 8.8 | 35.6 | 80 | 86.8 | 71,974 | 5.4 |
| Y55 | Agents primarily act smooth and skeletal muscle and respiratory system | 0.7 | 34.6 | 51 | 30.9 | 3282 | 3.3 |
| Y56 | Topical agent primarily affecting skin/mucous membranes and opth/ot-rh-lary/dental drugs | 1.5 | 41.7 | 58 | 39.6 | 8061 | 3.8 |
| Y57 | Other and unspecified drugs and medicaments | 4.4 | 43.3 | 69 | 55.6 | 33,866 | 4.5 |
| Y58 | Bacterial vaccines | 0.2 | 54.9 | <1 | 7.2 | 623 | 0.0 |
| Y59 | Other and unspecified vaccines and biological substance | 0.6 | 47.1 | 57 | 17.0 | 2070 | 1.5 |
| Total | 65,987 | 100 | 42.9 | 70 | 58.5 | 680,833 | 4.6 |
For the latest year, 2008–2009, we examined the number of admissions by age, gender, proportion of older people (age >65 yrs), total bed-days and in-hospital mortality of each category of ADR. We showed the distribution of hospital-level ADR rates on a funnel plot. Statistical analysis was performed with SAS software (version 9.2). For all analyses, only data for emergency (unplanned) admissions were used.
Results
Overall hospital admissions for ADRs
Table 1 summarizes the annual number of total hospital admissions, the number of admissions associated with ADRs and in-hospital mortality rates. In our 10-year study period, there were 59,718,694 total emergency hospital admissions and 557,978 admissions with a diagnostic code indicative of ADRs (0.9%). Of these, 188,024 were primary diagnoses and 444,780 were of ‘external cause’. There were 26,399 in-hospital deaths in ADR admissions, a case-fatality rate of 4.7%.
Ten-year trends in hospital admissions for ADRs
Between 1999 and 2008, the total number of hospital admissions increased by 28.3%, but the total number of admissions due to ADRs increased by 76.8%. The majority of the latter was due to an increase in external cause codes. The in-hospital mortality rate of ADR admissions increased by 10%, from 4.3% to 4.7%, although this stabilized from 2004 onwards (Table 1).
Tables 2 and 3 describe the burden of ADRs according to ICD-10 code. The number of ADRs with a primary diagnosis increased by 36.8% during this study. Nephropathy due to drugs (from 109 to 303 admissions), cardiovascular consequences (from 1238 to 3399 admissions) and drug-induced lung disorders (from 64 to 157 admissions) were the three fastest growing ADRs as a primary diagnosis (Table 2). Mental and behavioural disorders due to drugs decreased 6.8% during the 10-year period, although the category bore the highest admission burden (57,096 diagnoses in the study period). Drug-induced anaemia (−21.8%) and complications following injection, immunization or anaesthesia (−7.0%) declined during the years 2004–2008.
The number of ADRs recorded in any secondary diagnosis field increased 105.8% during the study period (Table 3).The three fastest growing ADRs as external causes were drugs related to: gastrointestinal system (from 302 to 854 admissions); water-balance (from 2081 to 5789 admissions); and systemic agents (from 5146 to 12,667 admissions). In contrast, the only reported rate which showed a decrease was under the category of bacterial vaccines (from 297 to 153 admissions).
General description for year 2008–2009
In 2008–2009, the total number of emergency admissions in England was 6,830,067, of which 75,076 (1.1%) were drug-related (Table 1). The total admission rate in England was 13,726 per 100,000 person-years and the ADR admission rate in England was 146 per 100,000 person-years (data not shown). Mental and behavioural disorders due to drugs (24.5%), cardiovascular consequences (15.1%) and complications following injection, immunization or anaesthesia (14.8%) were the most frequent manifestations of ADRs (Table 4). Systemic agents were the most implicated class (Y43, 19.2%), followed by analgesics, antipyretics and anti-inflammatory drugs (Y45, 13.3%) and cardiovascular drugs (Y52, 12.9%) (Table 5). Systemic agents (Y43) were primarily antineoplastic or immunosuppressive drugs.
The admission burden was highest for mental and behavioural disorders due to drugs (94,579 total bed-days), but in-hospital mortality rate was highest for lung disorders due to drugs (17.2%) (Table 4). The highest admission burden was associated with systemic agents (Y43, 112,667 total bed-days), but the in-hospital mortality rate was highest among ADR due to agents affecting blood constituents (Y44, 9.4%).
Age distribution for year 2008–2009
Most hospital admissions associated with adverse drug reactions occurred in older patients. In 2008–2009, 58.5% of hospital admissions in which there was an external ICD-10 code for ADR occurred in people aged 65 years and over. The median age of ADRs with an external code was 70 (Table 5). ADRs due to bacterial vaccines (Y58) usually occurred in infants (median age <1), and younger patients tended to have ADRs from anaesthetics and therapeutic gases (Y48, median age 44) or CNS stimulants (Y50, median age 49). Older patients (>65 yrs) tended to have ADRs due to water-balance drugs (Y54, median age 80), drugs affecting the autonomic nervous system (Y51, median age 78) or the cardiovascular system (Y52, median age 78). Agents primarily affecting water-balance and mineral and uric acid metabolism (Y54) included mineralocorticoids, diuretics, agents affecting calcification or uric acid metabolism, and mineral salts.
Younger people tended to manifest ADRs as mental and behavioural disorders (median age 33) or toxic liver disease (median age 43). By contrast, those aged >65 yrs tended to have a clinical picture of cardiovascular consequences (median age 78), lung disorders (median age 73) or metabolic disorders (median age 72) (Table 4).
Gender distribution for year 2008–2009
There was little gender difference in admissions with a primary code of ADR (51.4% men) (Table 4). However, female patients predominate in admissions with an external cause code of ADR (42.9% men) (Table 5). Men were more likely to suffer from mental and behavioural disorders (68.9% men) and women were more likely to suffer from complications following injection, immunization or anaesthesia (40.9% men) (Table 4). Women appear more likely to be affected by ADRs due to systemic anti-infectives and antiparasitics (Y41, 30.6% men), agents primarily acting on smooth and skeletal muscle and respiratory system (Y55, 34.6% men) or water-balance agents (Y54, 35.6% men) (Table 5).
Socioeconomic status and ADR
We analysed ADR rate per 1000 admissions by population-weighted quintiles based on the Carstairs deprivation index allocated via the postcode to a small geographical area (‘output area’). However, there was no simple socioeconomic gradient in ADR rates per 1000 admissions, which were 9.9, 10.7, 10.4, 9.9 and 9.1 from quintile 1 (least deprived) through quintile 5 (most deprived).
Individual performance of NHS acute hospital trusts
We analysed the relationship between total emergency admissions and the percentage of ADR-related admissions for NHS acute hospital trusts, as shown in Figure 1. There were two trusts with unusually high rates: one with the proportion of 12% (3393 admissions) and the other with 34% (1134 admissions). Both of them were not included in the funnel plot. However, there was still wide variation in ADR-related admission percentages between individual NHS trusts, with many rates lying outside the control limits despite excluding these two trusts.
Figure 1.
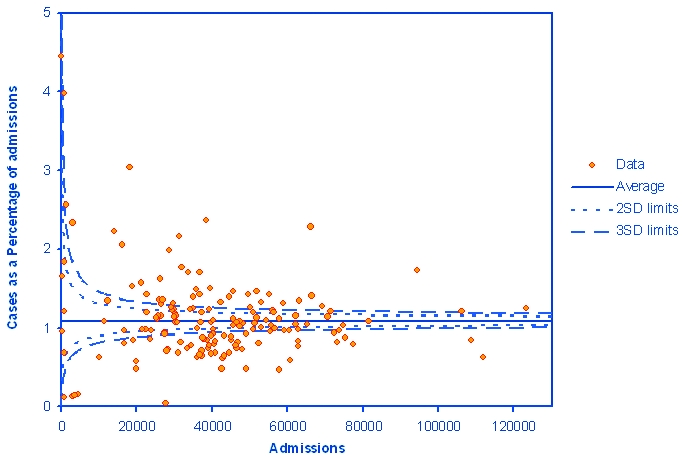
Funnel plot of the relationship between the total emergency admissions and the cases of ADRs as percentage of total emergency admissions for NHS acute hospital trusts
Discussion
Characteristics of this study
This study on hospital admissions for adverse drug reactions is unique in several aspects. The strengths of this study included its comprehensiveness in covering all NHS hospital admissions in England and its time trends.
Building on previous work using HES,4,16 we have tried to be systematic in capturing all ADR-related ICD-10 codes. We had access to mortality data associated with hospital admissions, which gave us a further insight into the severity of ADR-related admissions and we accessed patient-level rather than aggregate data. A prior study conducted by Pirmohamed and colleagues analysed admissions due to ADRs in two North-West English hospitals.3 However, their sample size (18,820 admissions) was substantially less than in this nationwide survey.
Limitations of this study
The main limitation of our study is that Hospital Episode Statistics data have the weaknesses associated with all routinely collected data; namely missing, incomplete or inaccurate data. Differences in coding practice between hospitals or populations covered make comparisons at hospital level difficult and will be one key explanation of the variation seen in Figure 1. We were also unable to rule out changes in coding as a result of behavioural or policy change as an explanation for our findings. If such variation occurs between hospitals, it is also likely within hospitals over time, which is a possible explanation for some of the trends observed. Nevertheless, HES represents one of several important resources for monitoring ADRs because of its size, national coverage and relatively standardized recording regulations.
We do not have data on the pre-hospital utilization of drugs (or over-the-counter drug usage), nor do we have details on the number of drugs prescribed or taken by patients before admission. There is no indication on the HES record whether the recorded ADRs were present on admission, or occurred during a patient's stay in hospital. If given as a primary diagnosis, in the first episode of care, then it is perhaps more likely that the ADR occurred prior to admission, and if given as a secondary diagnosis, then perhaps more likely to have occurred in hospital. However, this interpretation is limited, as there will be some considerable blurring between these two scenarios.
We do not have data from general practice or outpatient visits, and we are unable to link ADRs to consultations.12 Minor ADRs which might affect the patient's quality of life but not to the extent of hospital admission were not covered by our study. We were also unable to obtain data regarding risk benefit calculations of ADRs. Hence, given the limitations of our data, we must interpret the results with caution.
Overall trends
Our study showed that the number of admissions due to ADRs has increased significantly over the time period examined. The reported increase of ADR admissions by 76.8% may be due to improved record keeping and increased public awareness. Population ageing also added to this trend,17 since ADRs are most frequently encountered in older people with multiple long-term conditions.
In this study, we included immunization as part of our analysis. Complications following injection, immunization or anaesthesia accounted for 31,601 admissions in the study decade, 26,717 bed days in year 2008–2009, and an in-hospital mortality rate of 2.9%. Most of the admissions occurred in infants.
The majority of the increase in ADR admissions was due to increases in admissions with an ADR-related external code (105.8% change in the study period). These are most likely to have developed as a result of treatments in hospital, in contrast to admissions with a primary diagnosis of ADR, which may be due to drugs prescribed in the community or from a previous hospital admission.
Comparison with other studies
Pirmohamed et al. estimated that in England, ADRs were responsible for 6.5% of all emergency hospital admissions in adults and at least 5000 deaths per year.3 However, this study excluded some categories of patients. Howard et al. suggested that the percentage of preventable drug-related admissions to hospitals was 3.7%.18,19 In our study, ADR admissions accounted for only 0.8–1.1% of all annual admissions for 1999–2008, and the in-hospital mortality for ADR admissions for 2008–2009 was 3534, which was substantially less than suggested in previous literature. There are two possible explanations for this inconsistency. First, this may suggest a suboptimal recording of ADRs in the HES database because of under-recognition and under-reporting of ADRs in routine hospital activity data.16 Conversely, our study is based on a comprehensive nationwide data-set, which might also be more close to the reality than previous extrapolations from smaller scale studies.
Contradictory to some prior expectations,4 the introduction of the Quality and Outcome Framework (QOF) on 1 April 2004 in England did not seem to aggravate the burden of ADRs. Instead, the in-hospital mortality in ADR admissions stabilized at 4.7% from 2004 onwards. Drug-induced anaemia and complications following injection, immunization or anaesthesia increased for the years 1999–2004, culminated in year 2004–2005, and then decreased thereafter.
There is an association between increasing age and ADR risk,20 and elderly people are more susceptible to ADRs. Previous studies suggested that diuretics and antiplatelets are often used in elderly patients and accounted for 5.3% and 4.0%, respectively, of all primary care prescriptions in England.18 This study also showed similar findings, in which agents primarily affecting water-balance (Y54) and cardiovascular system (Y52) are the most implicated categories in ADRs in older people.
Pirmohamed et al. reported that 59% of the patients admitted with an ADR were female.3 Our study also showed that 57% of hospital admissions with a secondary code of ADR are female. The pharmacokinetics and pharmacodynamics of drug metabolism differ between the two sexes and are influenced by gender-specific factors such as body build, hormonal transitions, or medical-seeking behaviour.21 We cannot tell from this study if these differences are due to true discrepancies in ADR occurrence rates or are consequences of gender differences in prescription, consultation and usage patterns.
As to the drug types most implicated in ADR, our study showed that systemic agents are responsible for one-fifth of total ADR admissions in year 2008–2009, followed by analgesics and cardiovascular drugs. Systemic agents are also the third fastest growing agent in ADR-related admissions during the study period. These findings are similar to previous works by Waller et al.,16 but other studies also showed that low-dose aspirin, diuretics, warfarin, and non-steroidal anti-inflammatory drugs were the most commonly implicated drugs in ADR.3,8,18 Our results differed from this, and this can be explained by the different classification system of the drugs we used. We examined ICD-10 external cause codes to infer to the drug class, instead of individual generic name drugs. Broad groupings of drugs are used in this study, as exemplified by the systemic agent category, which includes antineoplastic drugs, immunosuppressive agents, enzymes, anti-allergic and anti-emetic drugs.
Conclusions
The advent of modern medicine has brought hope to many people with previously untreatable diseases, such as the use of penicillin to treat syphilis, or combination therapy to treat HIV infection. Nevertheless, ADRs are unwanted events following drug prescription and should be considered as part of a risk-benefit approach when prescribing medicines, particularly in vulnerable groups. Although ADRs continue to be a major public health problem resulting in a considerable use of NHS hospital resources and a significant number of deaths, their impact is often overlooked. Hospital admissions showed an apparent rise in relation to ADRs; however, this may be a consequence of improved recording.
There are several initiatives exploring susceptibility to ADRs through international collaborations (such as FP7-funded EU-ADR, The Serious Adverse Event Consortium, among others). Spontaneous reporting is important in identifying previously undetected ADRs, mostly type-B reactions, to allow appropriate drug regulatory action to be taken but frequently is unable to detect rare events until after years of patient use, with less than 10% reported.2 It is also a passive reporting policy and would benefit from being linked to other databases. More active drug surveillance schemes might be a potential strategy to address the high mortality associated with ADR admissions (4.7% in this study).
Other current strategies to improve drug safety include stringent safety testing; nationwide implementation of updated prescribing software to reduce prescribing errors;22,23 medicines reconciliation on admission and discharge from hospital to minimize polypharmacy;24 financial incentives for clinicians to report ADRs to address under-recording; and funding for research to decipher the complex multifactorial pathogenesis of idiosyncratic ADRs.25
Because of the wide range of medications available, ADRs vary in manifestations and organ system. Heightened awareness of pharmaco-vigilance by clinicians in diagnosing ADRs is crucial for continued drug safety monitoring. Over 70% of adverse drug reactions were possibly avoidable3 and preventable through simple improvements in prescribing, e.g. increased awareness of warning prompts of possible drug interactions and high-risk patient groups, prescribing a drug at the lowest dose necessary to achieve the therapeutic target.
Developed countries worldwide tend to have progressively older populations. In the UK, the number of people age 65 years and over is estimated to increase by 53% between 2001 and 2031.17 This increase will result in a rise in the number of people at higher risk of suffering from ADRs, which are more likely to be severe in this group.26 In our study, we also noticed that most ADR increases occur in those over the age of 65.
In this study, systemic agents were the most implicated and the third fastest growing agent in ADR-related admissions. This is also correlated with the rapid ageing of the English population, since systemic anti-cancer therapy (SACT) is targeted at malignancies whose risk increases with age. According to NCEPOD report 2008,27 43% of cancer cases suffered from clinically significant treatment-related toxicities.
Our data suggest that the number of ADR admissions may have increased at a greater rate than the increase in total hospital admissions, but it is unclear whether this could also be due to increased recording. Also, the percentage of ADR-related admissions varied considerably between individual NHS trusts. This study should prompt policy-makers toward implementing further measures to reduce ADR incidence and their associated in-hospital mortality; and to make greater use of routinely collect NHS data, such as Hospital Episode Statistics, to monitor the epidemiology of ADRs and identify potentially avoidable aetiological factors, and to improve the completeness, accuracy and standardization of coding across hospitals.
Footnotes
DECLARATIONS —
Competing interests None declared
Funding The Dr Foster Unit is funded by Dr Foster Intelligence. Imperial College London is grateful for support from the NIHR Biomedical Research Centre scheme and the NIHR Collaboration for Leadership in Applied Health Research & Care (CLAHRC) scheme. MM is funded by an NIHR postdoctoral award and is an investigator for the EU-ADR FP7 and Serious Adverse Events Consortium (SAEC) projects on adverse drug reactions
Ethical Approval We have approval from St Mary's Hospital Local Research Ethics Committee to use routinely collected hospital administrative data for research. Also, we have been granted permission by the Patient Information Advisory Group under Section 251 of the NHS Act 2006 (originally enacted under Section 60 of the Health and Social Care Act 2001) to use routinely collected hospital administrative data to provide measures of quality of delivery of healthcare by provider
Guarantors T-YW and AM
Contributorship T-YW extracted the relevant ICD-10 codes, carried out the literature review and drafted the manuscript. M-HJ and AB obtained and analysed the data and prepared thetables and figure. AM, PA, DB and MM conceived the study, mentored the other authors and made critical contributions to the manuscript at each stage
Reviewer David Henry
Acknowledgements
None
References
- 1.Pirmohamed M, Breckenridge AM, Kitteringham NR, Park BK. Adverse drug reactions. BMJ 1998;316:1295–8 [DOI] [PMC free article] [PubMed] [Google Scholar]
- 2.Pirmohamed M, Park BK. Adverse drug reactions: back to the future. Br J Clin Pharmacol 2003;55:486–92 [DOI] [PMC free article] [PubMed] [Google Scholar]
- 3.Pirmohamed M, James S, Meakin S, et al. Adverse drug reactions as cause of admission to hospital: prospective analysis of 18,820 patients. BMJ 2004;329:15–19 [DOI] [PMC free article] [PubMed] [Google Scholar]
- 4.Patel H, Bell D, Molokhia M, et al. Trends in hospital admissions for adverse drug reactions in England: analysis of national hospital episode statistics 1998–2005. BMC Clin Pharmacol 2007;7:9. [DOI] [PMC free article] [PubMed] [Google Scholar]
- 5.Chutka DS, Takahashi PY, Hoel RW. Inappropriate medications for elderly patients. Mayo Clin Proc 2004;79:122–39 [DOI] [PubMed] [Google Scholar]
- 6.Viktil KK, Blix HS, Moger TA, Reikvam A. Polypharmacy as commonly defined is an indicator of limited value in the assessment of drug-related problems. Br J Clin Pharmacol 2007;63:187–95 [DOI] [PMC free article] [PubMed] [Google Scholar]
- 7.Willlams CM. Using medications appropriately in older adults. Am Fam Physician 2002;66:1917–24 [PubMed] [Google Scholar]
- 8.Davies EC, Green CF, Taylor S, Williamson PR, Mottram DR, Pirmohamed M. Adverse drug reactions in hospital in-patients: a prospective analysis of 3695 patient-episodes. PLoS One 2009;4:e4439. [DOI] [PMC free article] [PubMed] [Google Scholar]
- 9.Pham CB, Dickman RL. Minimizing adverse drug events in older patients. Am Fam Physician 2007;76:1837–44 [PubMed] [Google Scholar]
- 10.Fick DM, Cooper JW, Wade WE, Waller JL, Maclean JR, Beers MH. Updating the Beers criteria for potentially inappropriate medication use in older adults: results of a US consensus panel of experts. Arch Intern Med 2003;163:2716–24 [DOI] [PubMed] [Google Scholar]
- 11.O'Mahony D, Gallagher PF. Inappropriate prescribing in the older population: need for new criteria. Age Ageing 2008;37:138–41 [DOI] [PubMed] [Google Scholar]
- 12.Chan DC, Hao YT, Wu SC. Characteristics of outpatient prescriptions for frail Taiwanese elders with long-term care needs. Pharmacoepidemiol Drug Saf 2009;18:327–34 [DOI] [PubMed] [Google Scholar]
- 13.Murray MD, Callahan CM. Improving medication use for older adults: an integrated research agenda. Ann Intern Med 2003;139:425–9 [DOI] [PubMed] [Google Scholar]
- 14.Konstam MA, Weir MR, Reicin A, et al. Cardiovascular thrombotic events in controlled, clinical trials of rofecoxib. Circulation 2001;104:2280–8 [DOI] [PubMed] [Google Scholar]
- 15.HES Online London: Department of Health; 2009. See http://www.hesonline.nhs.uk/Ease/servlet/ContentServer?siteID=1937&categoryID=658&keyword=validation [Google Scholar]
- 16.Waller P, Shaw M, Ho D, Shakir S, Ebrahim S. Hospital admissions for ‘drug-induced’ disorders in England: a study using the Hospital Episodes Statistics (HES) database. Br J Clin Pharmacol 2005;59:213–19 [DOI] [PMC free article] [PubMed] [Google Scholar]
- 17.Majeed A, Aylin P. The ageing population of the United Kingdom and cardiovascular disease. BMJ 2005;331:1362. [DOI] [PMC free article] [PubMed] [Google Scholar]
- 18.Howard RL, Avery AJ, Slavenburg S, et al. Which drugs cause preventable admissions to hospital? A systematic review. Br J Clin Pharmacol 2007;63:136–47 [DOI] [PMC free article] [PubMed] [Google Scholar]
- 19.Howard RL, Avery AJ, Howard PD, Partridge M. Investigation into the reasons for preventable drug related admissions to a medical admissions unit: observational study. Qual Saf Health Care 2003;12:280–5 [DOI] [PMC free article] [PubMed] [Google Scholar]
- 20.Routledge PA, O'Mahony MS, Woodhouse KW. Adverse drug reactions in elderly patients. Br J Clin Pharmacol 2004;57:121–6 [DOI] [PMC free article] [PubMed] [Google Scholar]
- 21.Seeman MV. Gender differences in the prescribing of antipsychotic drugs. Am J Psychiatry 2004;161:1324–33 [DOI] [PubMed] [Google Scholar]
- 22.Pollock M, Bazaldua OV, Dobbie AE. Appropriate prescribing of medications: an eight-step approach. Am Fam Physician 2007;75:231–6 [PubMed] [Google Scholar]
- 23.Kaushal R, Barker KN, Bates DW. How can information technology improve patient safety and reduce medication errors in children's health care? Arch Pediatr Adolesc Med 2001;155:1002–7 [DOI] [PubMed] [Google Scholar]
- 24.NICE, NPSA Technical patient safety solutions for medicines reconciliation on admission of adults to hospital. 2007. See http://www.nice.org.uk/nicemedia/pdf/PSG001Guidance.pdf.
- 25.Pirmohamed M. Genetic factors in the predisposition to drug-induced hypersensitivity reactions. AAPS J 2006;8:E20–6 [DOI] [PMC free article] [PubMed] [Google Scholar]
- 26.McLean AJ, Le Couteur DG. Aging biology and geriatric clinical pharmacology. Pharmacol Rev 2004;56:163–84 [DOI] [PubMed] [Google Scholar]
- 27.NCEPOD For better, for worse? A review of the care of patients who died within 30 days of receiving systemic anti-cancer therapy. 2008. See http://www.ncepod.org.uk/2008report3/Downloads/SACT_report.pdf