Abstract
Ultrasound stimulated microbubbles are currently under investigation as a means of transiently disrupting the blood brain barrier (BBB) and it has been shown that the strength of this effect is highly dependant upon ultrasound exposure conditions. The objective of this study was to investigate the potential for contrast agent destruction in the brain under conditions relevant to BBB disruption with a view to determining its possible influence on effective exposure parameters. An ultrasound imaging array was mounted within the aperture of a 1.68 MHz focused therapy transducer. Pulse lengths of 10 ms were employed at repetition rates of 0.1–2 Hz and pressures from 0.30 to 0.88 MPa. Contrast imaging was performed following the bolus injection of Definity™ and contrast time-intensity curves were then analyzed for regions of interest exposed to the therapy beam. Individual therapy pulses resulted in microbubble destruction, with the degree of agent depletion and replenishment time increasing with transmit pressure. As the pulse repetition rate was increased, agent reperfusion between pulses was incomplete and the concentration within the beam was progressively diminished, to a degree dependent upon both pressure and repetition rates. These results demonstrate that microbubble concentration can be substantially influenced by destruction induced by therapeutic ultrasound pulses. The kinetics of this effect may therefore be a significant factor influencing the efficiency of BBB disruption, suggesting that monitoring of the spatial and temporal distribution of contrast agents may be warranted to guide and optimize BBBD therapy in both pre-clinical and clinical contexts.
Keywords: ultrasound, microbubbles, drug delivery, blood brain barrier
INTRODUCTION
It has been established that ultrasound stimulated microbubbles are capable of producing transient blood-brain-barrier (BBB) disruption (Hynynen et al, 2001; McDannold et al. 2008a,b; Yang et al 2008). This approach has considerable potential for noninvasively promoting the local delivery of therapeutic agents to the central nervous system, for which the BBB is a major impediment to achieving therapeutic concentration levels (Hynynen 2008). Results to date have shown the feasibility of this approach for enhancing the delivery of gadolinium, dyes, chemotherapy (Treat et al. 2007) and antibodies (Kinoshita et al. 2006) to brain tissue. It has been found that blood-brain-barrier disruption (BBBD) can occur under conditions that do not produce significant irreversible damage, as indicated by measures of red blood cell extravasation, apoptosis, and ischemia (McDannold et al. 2005).
The mechanism of ultrasound potentiated BBBD remains to be established, though evidence now emerging indicates that it is at least in part associated with a widening of endothelial cell tight-junctions and induction of active transport (Sheikov et al. 2008). While the details of role of the microbubble behavior in achieving these effects are poorly understood, they are likely to be a function of the particular manner in which microbubbles are stimulated to oscillate. Microbubble behavior is known to be highly dependant upon the ultrasound exposure conditions, such as frequency, amplitude, pulse length, and boundary conditions (e.g. confinement within microvessels). This has motivated the exploration of a range of insonation parameters (McDannold et al 2008a; Vykhodtseva et al. 2008), with a view to gaining mechanistic insight and optimizing delivery efficiency under conditions that do not produce indications of damage.
Ultrasound exposure parameter space has yet to be fully explored: variables examined to date include frequency, pressure, pulse length and pulse repetition frequency (PRF). Frequencies have ranged from 0.26 – 2.1 MHz (Vykhodtseva et al. 2008), and it has recently been shown that the threshold for BBBD appears to be linked to mechanical index (McDannold et al. 2008b). Delivery efficiency is pressure dependent, exhibiting first a threshold for detectible effects, followed by an increase and then a leveling off at sufficiently high pressures (Hynynen et al. 2005; McDannold et al. 2008a). The effect is correlated with the presence of increased harmonic emission levels, though it appears that inertial cavitation is not necessary to induce results (McDannold et al. 2006). Pulse lengths have ranged between 0.1–100ms, and it has been found that below 10 ms the effect can become less pronounced, depending upon the pressure level (McDannold et al 2008b). PRFs have been varied between 0.5 and 10 Hz and, of particular relevance to the present study, it appears that changes within this range may not result in significant differences in BBBD efficiency (McDannold et al 2008a). It has also been found that the delivery of doxorubicin (Treat et al. 2007) and dyes (Yang et al. 2008) increases with agent dose, indicating that the efficiency of BBBD is dependant upon the concentration of agent present within the insonated region.
While the specific mechanisms responsible for BBBD remain to be established, we hypothesize that in addition to a physiologic dependence on the oscillation characteristics of bubbles, there may also be a parametric influence associated with microbubble concentration kinetics. As is well known in contrast imaging applications, if bubbles are disrupted there will be a finite time required for their replenishment into the destruction zone (Wei et al. 1998). This can be exploited for the purposes of tissue perfusion assessment, where the form of the time dependant microbubble signals is related to the particular characteristics of vessels within the insonated region, their physiologic state, and the size of the destroyed region (Arditi et al. 2006; Hudson et al. 2006). Destruction-reperfusion measurements can also be conducted in the brain, and it has been demonstrated in vivo that this technique produces results that can be related to tissue perfusion and blood volume (Rim et al. 2001). There is a considerable literature on microbubble contrast agent destruction, which has established that it is promoted by the use of longer pulses, lower frequencies and higher amplitudes (e.g. Chomas et al. 2001). The longer pulses and relatively low frequencies (<2 MHz) generally employed for BBBD would suggest that bubble destruction may be occurring in this application.
Until now microbubble destruction reperfusion kinetics and their potential role in influencing the efficiency of BBBD have not been examined. In this study we investigate these effects under conditions that are relevant to many previous BBBD experiments in order to determine their possible influence on BBBD efficiency. The experiments are carried out in the rabbit brain using the combination of a therapy transducer and an imaging array operating in contrast imaging mode.
METHODS
Experimental configuration
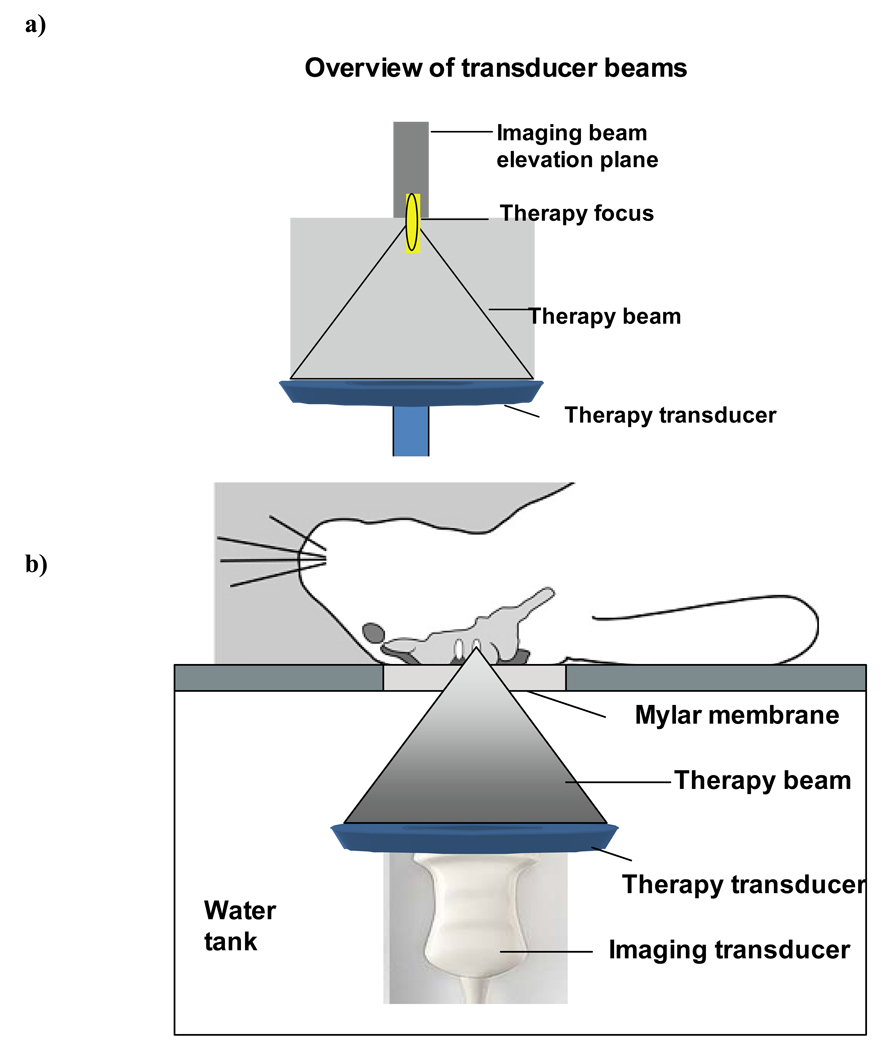
An ultrasound imaging transducer (Phillips L9-3) was custom mounted within the aperture of a 1.68 MHz center frequency spherically focused therapy transducer annulus (outer diameter 10 cm; inner diameter 6 cm; geometric focus at 8 cm). The therapy bean focus was co-registered with the imaging transducer (L9-3 probe with a Phillips Medical Imaging iu22 system; Seattle, WA, USA) such that the center of the imaging plane and the therapy beam focus were at a depth of 6 cm (Fig. 1a). The transducers were in turn mounted on an arm attached to a 3-axis manual positioning system such that their beams were directed vertically upwards within a water tank lined with absorbing material and filled with degassed water.
Figure 1.
a) Illustration of the therapy and imaging beam configuration. b) Overview of the configuration for the in vivo experiments. A rabbit is located supine over a water tank and the coaxial imaging and therapy beams pass into the brain through a craniotomy window.
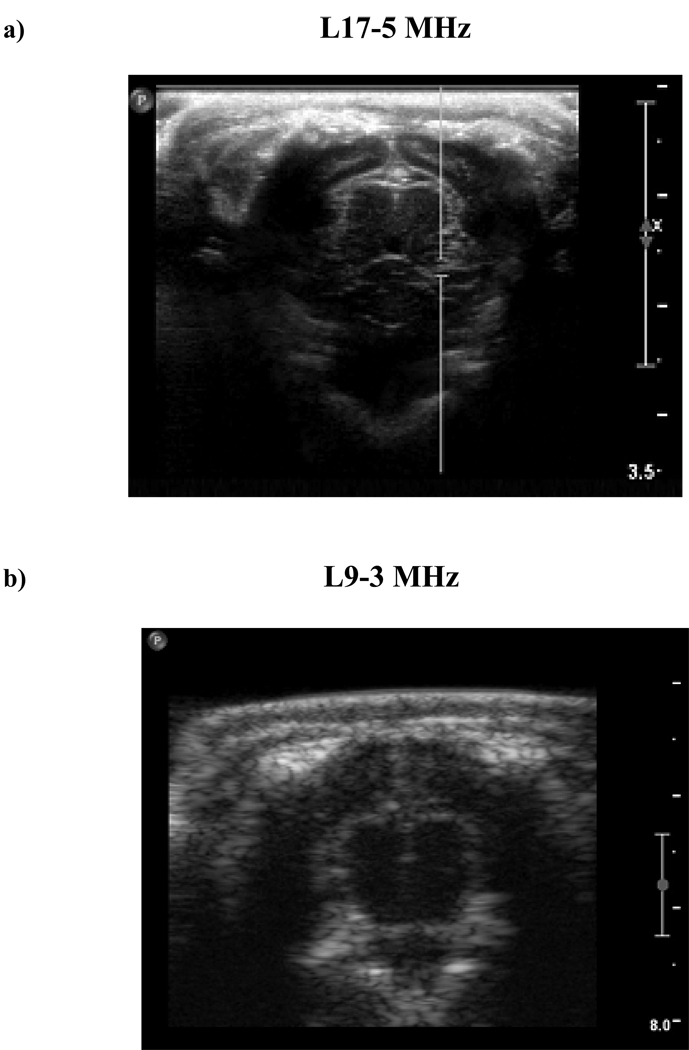
Experiments were performed on rabbit brains, with the subjects arranged in a supine position on a platform located atop the water tank and exposures being conducted through a mylar acoustic window (Fig. 1b). The animals (n=4) had undergone craniotomies within 2 weeks prior to experiments, enabling improved control of the exposure conditions, and enabling ultrasound B-scan and contrast imaging of the brain. Two examples of B-scan imaging of the rabbit brain are shown in Figs. 2a and b for a 17 MHz (L17-5) and 9 MHz probe respectively. The former was employed prior to the exposure experiments being conducted to gain a better appreciation of the brain appearance but was not used in the main part of the study due to a lack of a contrast imaging mode. Prior to conducting each exposure experiment, the transducers were positioned such that the therapy transducer focus was centered within one of the hemispheres.
Figure 2.
a) An example image taken with an L17-5 probe illustrates that brain imaging can be readily achieved in subjects with a craniotomy. b) Imaging with the L9-3 probe mounted within the therapy array has less resolution, but general features, such as the hemispheres and cortex can readily be distinguished. c) An example contrast image taken after the bolus injection of agent. Scale: 1cm between large hache marks.
Pulses (1.68 MHz) were transmitted by the therapy transducer using an arbitrary waveform generator (model AFG 3000; Tektronix, Beaverton, OR, USA) which was amplified by 50 dB (model A150; ENI Rochester, NY, USA) and passed through a custom impedance matching circuit. Pulse lengths of 10 ms were employed at PRFs of 0.1, 0.5, 1 and 2 Hz. The 0.1 Hz PRF was used to provide sufficient temporal spacing to examine the potential destruction-reperfusion effects associated with an individual pulse. At higher PRFs (0.5, 1, 2 Hz) the transmission sequence was to alternate between transmitting multiple pulses during a 10s period and having the transmit off for 10s (‘multiple pulse sequence’). The latter sequence is more analogous to typical exposure schemes for BBBD and permitted an examination of the potential for agent depletion during the course of a burst of transmitted pulses. Acoustic pressures were measured with a calibrated 0.2 mm needle hydrophone (Precision Acoustics, Dorchester, UK) within a water tank and represent the maximum on-axis peak negative pressure levels. The pressure levels employed were 0.30, 0.44, 0.69, 0.88 MPa (electrical powers 0.25, 0.5, 1, and 2 W respectively), after de-rating assuming an attenuation of 2.8 dB/cm (Goss et al. 1978) for an average depth of 1.0 cm. The −6 dB beam width was 0.9 mm and the −6 dB depth of field was 11 mm.
Contrast imaging was performed using an iu22 imaging system at a mechanical index of 0.07 and frame rate of 11 Hz with persistence disabled. The contrast agent employed was Definity™ (Lantheus Medical Imaging, Billerca, MA, USA), which was injected in bolus form at a concentration of 30 microlitres/kg through an indwelling catheter in an ear vein, and immediately followed by a 2 ml saline flush. Contrast imaging commenced at the time of injection and continued for 3 minutes. Exposures began at approximately 20 seconds following injection. A minimum of 10 minutes was allotted between successive experiments to permit sufficient systemic clearance of the preceding bolus. The number of data points acquired for each condition is summarized in Table 1.
Table 1.
Summary of number of data points for each experiment.
| Pressure (MPa) |
Single pulse (0.1 or 0.2 Hz) |
10 s Multiple pulse sequence | ||
|---|---|---|---|---|
| 0.5 Hz | 1 Hz | 2 Hz | ||
| 0.30 | 12 | 3 | 6 | 6 |
| 0.44 | 15 | 4 | 9 | 6 |
| 0.69 | 14 | 4 | 6 | 6 |
| 0.88 | 7 | - | 5 | - |
All experiments were carried out according to protocols approved by the Sunnybrook Health Sciences Centre Animal Care Committee
Processing of Contrast Data
Region of interest (ROI) selection
Contrast imaging movies were processed using Qlab software (Phillips Medical Imaging). For each injection, ROI selection was performed to delineate the exposed and unexposed regions. The ROIs were implemented using a polygon function to encompass the full depth of the upper cortex (~1.5 mm) with a lateral extent of 2 mm centered about the beam axis of the therapy transducer. This was done as the cortex exhibited a higher SNR in contrast imaging mode and resulted in time-intensity curves beginning at the point of bolus injection which were then processed in Matlab (Mathworks, Natick MA), according to the procedures described below.
Elimination of therapy pulse coupling
During the therapy beam transmit time (10ms) acoustic coupling resulted in the saturation of images. The effect of this on the time-intensity curves (c(t)) was to cause a large ‘spikes’ that significantly exceeded the surrounding values. These were effectively identified by testing if the intensity value of a given point was more than 3x its neighboring points. This effect was also used to provide timing information about the occurrence of the therapy transmit pulse. The particular time point was then assigned to have an intensity value that was linearly extrapolated from the two preceding points before continuing processing.
Single pulse processing
For the 0.1 Hz transmit case, the pulses were sufficiently far apart to evaluate potential destruction-replenishment kinetics associated with individual pulses. The analysis of contrast agent kinetics during destruction-reperfusion has been well investigated in the case of intravenous infusions, and typically involves fitting the data to a curve (e.g. with an exponential function) which is then used to extract information related to blood flow. In the case of a bolus injections however, there is first a peak in the time-intensity curve followed by a monotonic decay in amplitude, the latter reflecting the decreasing systemic agent concentration.
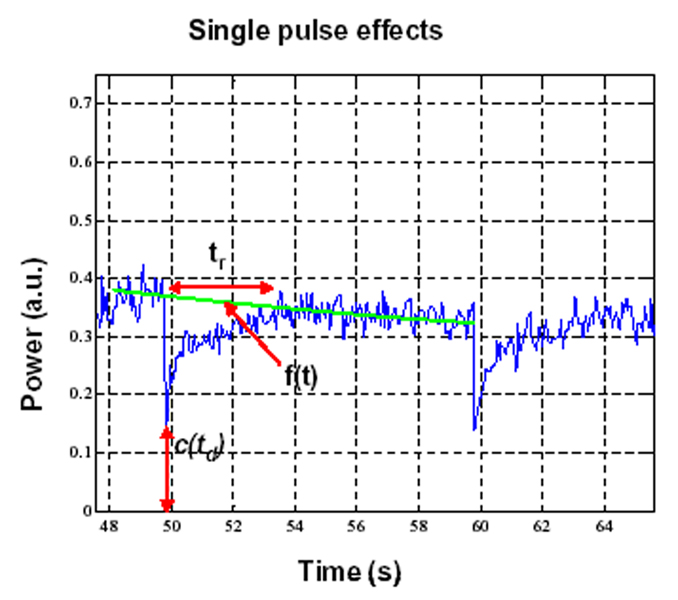
Destruction-reperfusion during bolus injections has been examined previously (e.g. Krix et al. 2002), where it is recognized that the destruction-reperfusion signal will be superimposed upon the decaying time-intensity curve. The effect of systemically decaying agent concentration can be compensated for by interpolating between the pre-destruction point and the point at which the signal recovers back to the original time intensity curve (e.g. Krix et al. 2002). A similar approach was adopted here. Specifically, for a given pulse, the data values (c(t)) for the 2s immediately preceding the destruction pulse time (td) and those for 2s preceding the following transmit pulse (td+10) were extracted and linear regression analysis was performed to create a line f(t), which provided an estimate of what time-intensity curve would have been between the two pulses in the absence of a destructive transmit pulse. The slope of this line was then used to correct the original data curve (c(t)) to compensate for decaying agent concentration, resulting in a new curve ccorr(t). Regression analysis was then performed to fit ccorr(t) from td to td+5 with an exponential curve (cexp(t)), representing the intensity recovery curve following a destructive pulse. The recovery time (tr) was then taken to be the time that it took to reach 90% of its steady state value.
A second calculation performed was to estimate a value to provide an indication of the extent to which agent was destroyed, referred to as the depletion ratio (rd). This was taken to be 1-c(td)/f(td) which was calculated for each transmit pulse.
Multiple pulse processing
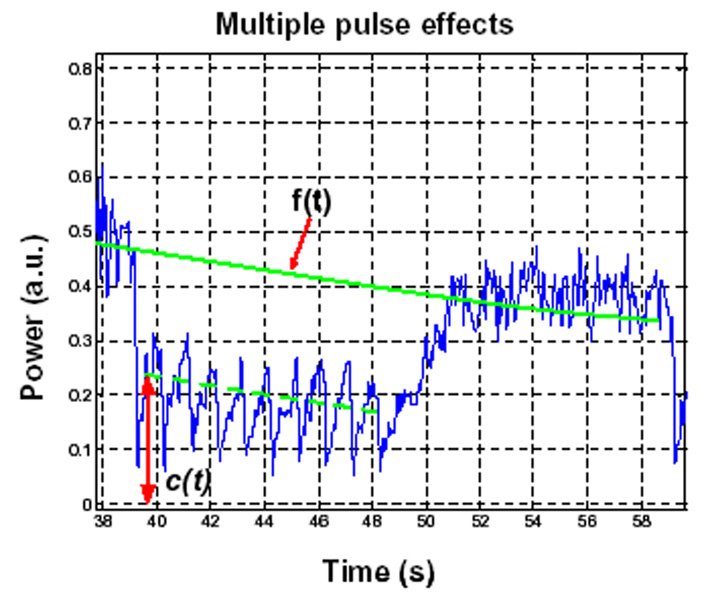
As will be seen below, at higher PRFs the use of multiple pulses over a 10s period has the potential to result in a more pronounced level of agent depletion. To provide a quantitative measure of this depletion, the following procedure was employed. Similar to the single pulse case, data points immediately preceding (2s) a given 10s multiple pulse sequence and preceding the subsequent sequence were taken and used to perform a linear regression to estimate of the form of the time intensity curve in the absence of a destructive pulse (f(t)). For a given point during the 10s transmit sequence, the estimate for the ratio of agent concentration would be 1-c(t)/f(t). Of particular interest to this study is to determine the relative agent concentration (as indicated by the time-intensity curve) at the point following a transmitted therapy pulse. Therefore, the average of 1-c(t)/f(t)) during the 0.25s preceding each therapy pulse was used to perform calculations; this was repeated for the second to final pulses and these results were then averaged.
RESULTS
Individual Pulses
An example time-intensity curve from an unexposed brain hemisphere following a bolus injection of contrast agent is shown in Fig. 3a. This curve has the general features found in most bolus injection curves: following a delay there is a rapid rise in agent concentration, which peaks and then decays over the course of several minutes. Fig. 3b show an example time-intensity curve for the exposed region of the contra-lateral hemisphere, which was subjected to pulsed focused ultrasound at a PRF of 0.1 Hz and pressure of 0.69 MPa. The data from the exposed hemisphere show clear signs of agent destruction. An expanded view of this case is shown in Fig. 4, where the characteristic features of destruction-reperfusion effects are evident. This demonstrates that substantial destruction of agent is occurring at this power level, and that replenishment time after exposure can be significant.
Figure 3.
a) An example ROI curve in an unexposed hemisphere. b) An example time-intensity curve in an exposed hemisphere (0.69 MPa) shows evidence of destruction-reperfusion effects.
Figure 4.
An expanded view of the 0.1 Hz, 0.69 MPa case indicating destruction-reperfusion effects and variables used for quantification of isolated individual pulse exposures.
A summary of the quantification results for recovery time and depletion levels shown in Table 2, with the variables used to perform the quantification having been highlighted in Fig. 4. The results show a trend of increased depletion levels and recovery time for agent replenishment with increasing transmit pressure.
Table 2.
Summary of results for single pulse experiments.
| Pressure (MPa) |
Depletion ratio rd |
Recovery time tr (s) |
|---|---|---|
| 0.30 | 0.31±0.13 | * |
| 0.44 | 0.43±0.04 | 0.6±0.3 |
| 0.69 | 0.58±0.12 | 1.2±0.5 |
| 0.88 | 0.89±0.04 | 2.7 ±0.4 |
Mean and standard deviations are indicated. Note that * indicates that the limited degree of destruction resulted in insufficient signal to noise ratio to make an estimate.
Multiple Pulse Sequences
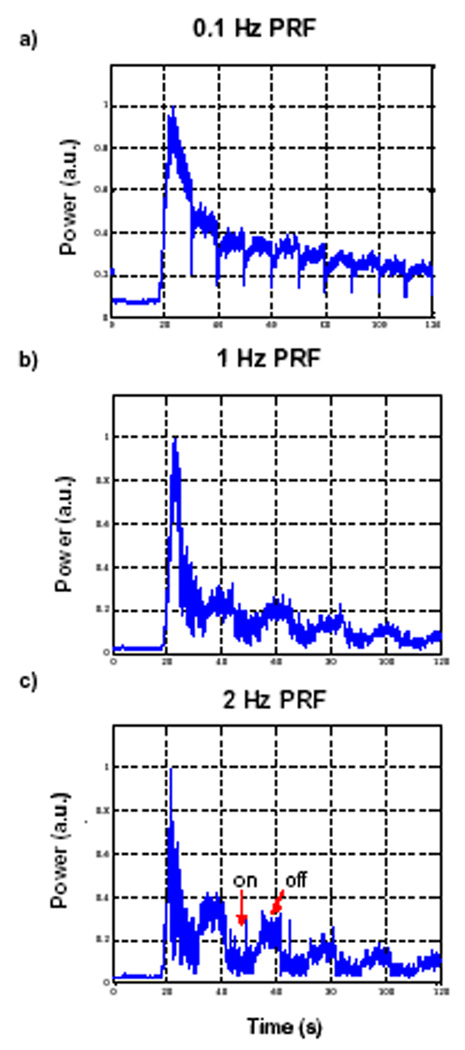
Figure 5 illustrates the effects of PRF on the bolus curves. Figure 5a shows the curve for 0.1 Hz, and Fig.s 5b and c show results for the 10s multiple pulse sequence where within the ‘on’ period the PRF is 1 and 2 Hz respectively (all at 0.69 MPa). As the PRF is increased, it can be seen that during the ‘on’ period there is a generalized depletion of agent, the extent of which is more pronounced at 2 Hz than at 1 Hz.
Figure 5.
Example bolus curves for 10s multiple pulse sequences (pressure = 0.69 MPa) as a function of PRF. a) 0.1 Hz b) 1 Hz and c) 2 Hz. By decreasing pulse intervals, the agent recovery time is reduced resulting in general agent depletion.
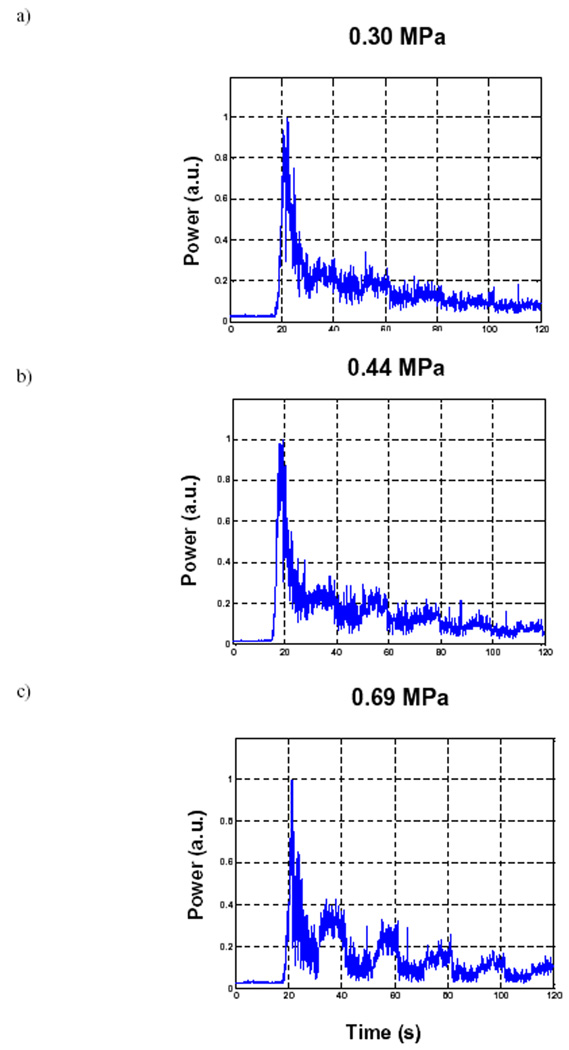
In Fig. 6, this effect is shown as a function of power, while keeping the PRF fixed to 2 Hz. From Figs. a to c the pressure levels are 0.30, 0.44 and 0.69 MPa respectively. At the lowest pressure level, there can be seen to be modest variations in drops and recoveries, and by 0.69 MPa, the depletion becomes substantial. A summary of the quantification of these results is shown in Table 3, with the variables used to perform the quantification highlighted in Fig. 7.
Figure 6.
Example bolus curves for 10s multiple pulse sequences (PRF=2 Hz) as a function of increasing transmit pressure. a) 0.30, b) 0.44 and c) 0.69 MPa.
Table 3.
Summary of results for multiple pulse experiments.
| Pressure (MPa) |
Depletion ratio | ||
|---|---|---|---|
| 0.5 Hz | 1 Hz | 2 Hz | |
| 0.30 | 0.04±0.03 | 0.09±0.03 | 0.23±0.08 |
| 0.44 | 0.04±0.07 | 0.13±0.03 | 0.38±0.05 |
| 0.69 | 0.06±0.02 | 0.30±0.06 | 0.53±0.07 |
| 0.88 | - | 0.52±0.05 | - |
Figure 7.
An expanded view of the 0.5 Hz, 0.69 MPa 10s multiple pulse sequence case indicating destruction-reperfusion effects and variables used for quantification exposure effects.
DISCUSSION
Though BBBD was not measured in this study, the exposure conditions and animal model were selected to be of relevance to previous work. At a frequency nearly identical to that employed here (1.63 MHz, 1 Hz PRF) and with the same animal model, BBBD has been found to occur at pressure levels of 0.7 MPa and above (Hynynen et al. 2001; McDannold et al. 2005). While these experiments were conducted with Optison™ and we have used Definity™, it has been shown that these two agents have similar thresholds for BBBD (McDannold et al. 2007). In a recent study McDannold et al. (2008b) demonstrated that the threshold (50% probability level) for BBBD appears to be characterized by MI, which was estimated to be 0.47 (PRF 1 Hz, frequency range 0.26-1.63 MHz). This would correspond to a BBBD threshold of 0.61 MPa at the frequency employed in the present study, which is exceeded by the upper two pressure levels. At these transmit values, the results show clear evidence of microbubble destruction, and therefore indicate that microbubble destruction is occurring under conditions that produce BBBD.
The results also exhibit a trend of increased depletion levels and recovery times for agent replenishment with increasing transmit pressure. The former is consistent with a more substantial level of destruction occurring at higher transmit levels. The latter is consistent with an increase in the spatial extent of destruction, which would be expected if a larger portion of the beam is above the destruction threshold for the agent.
After agent within the therapeutic transducer focus is disrupted by a pulse, the ensuing reperfusion kinetics occur on a time scale that can result in incomplete replenishment of agent between pulses if the PRF and pressure levels are sufficiently high. That is, agent does not have sufficient time to reperfuse into the focal region between pulses if they are too closely spaced. The trend of increasing depletion with increasing PRF and power (Table 3) is therefore consistent with the recovery time trends shown in Table 2. Such an effect, distinct from direct physiologic mechanisms of action of microbubbles with blood vessels, is therefore potentially a factor that may limit BBB disruption efficiency improvements with increasing PRF and power levels. The dependence of BBBD on PRF and amplitude was explored in McDannold et al (2008a), where the exposure times were fixed (20s) and PRF ranged from 0.5 to 5 Hz. For a 10ms pulse length (MI=0.60) it was found that the probability of BBBD and enhancement levels was not significantly (p>0.05) different between 0.5, 1 and 2Hz, which may suggest a leveling off of BBBD with increasing PRF. However, when considering this from the perspective of the number of pulses delivered (given that the exposure time was fixed to 20s), the ratio of enhancement effect per pulse is in fact decreased with increasing PRF. The results of the present study indicate that as PRF increases, the amount of agent present within the focus during successive pulses is decreased. If the degree of BBBD is dependant upon agent concentration, as has been shown by the results of Yang et al. (2008) and Treat et al. (2007), then the reduced level of delivery per pulse implicit in McDannold et al. (2008a) may be due to a diminished agent concentration resulting from destruction effects. This would suggest that, from the perspective of maximizing the effectiveness of each individual pulse, the PRF should be selected such that complete replenishment occurs between pulses. Therefore, while it has been shown to be possible to achieve BBBD at PRFs exceeding those indicated by the recovery times found here (McDannold et al 2008a; Choi et al. 2007) it is likely that the efficiency of each pulse has been reduced considerably. A comparison of using a fixed number of pulses with varying PRF has yet to be done, though such a comparison would be complicated by bolus injection kinetics unless a constant infusion of microbubbles is used.
With regards to the bolus injection kinetics, it is clear that the timing and duration of the therapy burst sequence relative to the time-intensity curve peak will play a critical role in determining the level of agent that is present within the target tissue. In particular, it is reasonable to hypothesize that the total BBBD effect will be cumulative over the entire burst length, and will therefore be an integrated function of the concentration of the bolus at the times of individual pulses comprising the burst. When a portion of the insonation burst occurs prior to agent arrival this will reduce the efficiency, and as the burst length is extended beyond the bolus peak, progressively less agent will be available at the focus for BBBD. The arrival time and characteristics of the peak will be a function of when the injection occurs and the particular location of the target tissue. It should also be noted that both the time to peak and the kinetics of systemic agent concentration decay will be dependant upon the particular animal model employed. BBBD is also being investigated in rats and mice, which have shorter blood circulation times (e.g. Schmidt-Nielsen 1984) and will therefore have shorter times to peak enhancement and may also be expected to have a more rapid decay in the systemic agent concentration. Both of these factors should give rise to differences in the optimal timing for the beginning and duration of insonation bursts between animal species, and in humans. Direct information about the time-intensity curves for the target region would therefore be valuable in guiding treatment protocols both in pre-clinical and clinical contexts.
In interpreting the destruction-reperfusion characteristics of the time-intensity curves, the geometry of the therapy and imaging transducers must also be considered. In particular, it should be noted that the lateral extent of the therapy beam (and therefore the region where agent is potentially destroyed) may be substantially less than the elevation plane of the imaging transducer, which has not been measured here. For an elevation plane thickness greater than the lateral extent of the therapy beam (−6 dB one way beam-width = 0.9 mm), the degree of destruction represented by the drop in the time-intensity curve will underestimate that occurring in the therapy transducer focus.
It is useful to consider the implications of these results for clinical applications. In the present study, a single location was exposed with a therapy beam that had a fixed beam size, as has been done with the majority of pre-clinical experiments to date. Considerable efforts are being directed towards the continued development of clinical transcranial arrays, in order to achieve improved localization of the focus, and to enable rapid scanning over larger volumes of tissue (Pernot et al. 2003; Hynynen et al. 2004). Depending upon the location of target region within the brain, there will however be a range in the size of the focal region that can be achieved in practice after passing through the skull (Sun and Hynynen 1998). Given that the replenishment times will be dependant upon the size of the destruction zone (determined by the focal size), it can be therefore expected that under realistic clinical situations, the optimal PRF from a replenishment perspective will be variable and depend upon both the patient (i.e. skull geometry and acoustic properties) and the location of the target volume. In extrapolating the results of the present study to a clinical context it should be considered that the focus will generally be more diffuse (i.e. larger) in a transcranial situation relative to the beam employed here, where the animals have undergone a craniotomy procedure. A larger beam would in turn produce a wider destruction zone and therefore be expected to result in longer reperfusion times. Further, replenishment rates are known to be dependant on the vascular characteristics of tissue (e.g. Karshafian et al. 2003), which can be affected by diseases such as cancer. It is therefore reasonable to assume that optimal exposure parameters may be influenced by the target tissue type and, in the case of cancer, even the location within the tumor (Broumas et al. 2005).
Finally, the results also have implications for BBBD exposure strategies that may be employed in the context of transcranial arrays. In ultrasound ablation therapy, the rapid control of focal location possible with therapy arrays has been exploited in combination with temperature feedback to improve treatment times (Hynynen and Clement 2008). For the case of microbubble mediated BBBD, we hypothesize that improvements in treatment times may be achieved by exposing other regions during the ‘down-time’ that is required to wait for agent to replenish within a given focal zone. This would require imaging feedback related to the spatial and temporal distribution of agent concentration (e.g. contrast image intensity) to be incorporated into the therapy system control.
CONCLUSIONS
The results of this study have shown that contrast agent destruction occurs under conditions that are relevant to ultrasound potentiated BBBD. Following a destructive pulse, time is required for agent to be replenished within the focal region of the therapy beam. This effect can therefore be expected to be a significant factor, distinct from physiologic mechanisms, in determining the efficiency of BBBD as a function of exposure parameters. The data therefore suggest that an improved understanding of the role of agent kinetics in pre-clinical investigations of drug delivery to diseased tissue is warranted. In particular, the relative agent concentration at the time of each pulse should be considered, from both disruption-replenishment and bolus kinetics perspectives. Imaging contrast agent kinetics may ultimately be relevant to guiding and optimizing BBBD therapies in a clinical context.
ACKNOWLEDGMENTS
This work was funded by the National Institutes of Health (R33EB000705), Terry Fox Foundation, CRC program, and the Sunnybrook Research Institute.
Footnotes
Publisher's Disclaimer: This is a PDF file of an unedited manuscript that has been accepted for publication. As a service to our customers we are providing this early version of the manuscript. The manuscript will undergo copyediting, typesetting, and review of the resulting proof before it is published in its final citable form. Please note that during the production process errors may be discovered which could affect the content, and all legal disclaimers that apply to the journal pertain.
REFERENCES
- Arditi M, Frinking PJA, Zhou X, Rognin NG. A new formalism for the quantification of tissue perfusion by the destruct ion-replenishment method in contrast ultrasound imaging. IEEE Trans Ultrasonics Ferroelect Freq Contr. 2006;53:1118–1129. doi: 10.1109/tuffc.2006.1642510. [DOI] [PubMed] [Google Scholar]
- Broumas AR, Pollard RE, Bloch SH, Wisner ER, Griffey S, Ferrara KW. Contrast-enhanced computed tomography and ultrasound for the evaluation of tumor blood flow. Invest Radiol. 2005;40:134–147. doi: 10.1097/01.rli.0000152833.35744.7f. [DOI] [PMC free article] [PubMed] [Google Scholar]
- Choi JJ, Pernot M, Small SA, Konofagou EE. Noninvasive, transcranial and localized opening of the blood-brain barrier using focused ultrasound in mice. Phys Med Biol. 2007;52:5509–5530. doi: 10.1016/j.ultrasmedbio.2006.07.018. [DOI] [PubMed] [Google Scholar]
- Chomas JE, Dayton P, Allen J, Ferrara KW. Mechanisms of contrast agent destruction. IEEE Ultrason Ferroelec Freq Control. 2001;48:232–248. doi: 10.1109/58.896136. [DOI] [PubMed] [Google Scholar]
- Clement GT, White J, Hynynen K. Investigation of a large-area phased array for focused ultrasound surgery through the skull. Phys Med Biol. 2000;45:1071–1083. doi: 10.1088/0031-9155/45/4/319. [DOI] [PubMed] [Google Scholar]
- Goss SA, Johnson RL, Dunn F. Comprehensive compilation of empirical ultrasonic properties of mammalian tissues. J Acoust Soc Am. 1978;64:423–457. doi: 10.1121/1.382016. [DOI] [PubMed] [Google Scholar]
- Hudson JM, Karshafian R, Burns PN. Quantification of Flow Using Ultrasound and Microbubbles: A Disruption Replenishment Model Based on Physical Principles. IEEE Ultrasonics Symp; Vancouver; Canada. 2006. pp. 1588–1591. [DOI] [PubMed] [Google Scholar]
- Hynynen K, Clement GT, McDannold N, Vykhodtseva N, King R, White PJ, Vitek S, Jolesz FA. A 500-element ultrasound phased array system for noninvasive focal surgery of the brain: A preliminary rabbit study with ex vivo human skulls. Magnetic Res Med. 2004;52:100–107. doi: 10.1002/mrm.20118. [DOI] [PubMed] [Google Scholar]
- Hynynen K, McDannold N, Vykhodtseva N. Noninvasive MR imaging-guided focal opening of the blood-brain barrier in rabbits. Radiology. 2001;220:640–646. doi: 10.1148/radiol.2202001804. [DOI] [PubMed] [Google Scholar]
- Hynynen K. Ultrasound for drug and gene delivery to the brain. Advanced Drug Deliv. Rev. 2008;60:1209–1217. doi: 10.1016/j.addr.2008.03.010. [DOI] [PMC free article] [PubMed] [Google Scholar]
- Hynynen K, McDannold N. Integrated therapy systems. In: Jolesz FA, Hynynen KH, editors. MRI-Guided Focused Ultrasound Surgery. New York: Informa Healthcare; 2008. [Google Scholar]
- Karshafian R, Burns PN, Henkelman MR. Transit time kinetics in ordered and disordered vascular trees. Phys Med Biol. 2003;48:3225–3237. doi: 10.1088/0031-9155/48/19/009. [DOI] [PubMed] [Google Scholar]
- Kinoshita M, McDannold N, Jolesz FA, Hynynen K. Targeted delivery of antibodies through the blood-brain barrier by MRI-guided focused ultrasound. Biochem Biophys Res Comm. 2006;340:1085–1090. doi: 10.1016/j.bbrc.2005.12.112. [DOI] [PubMed] [Google Scholar]
- Krix M, Kiessling F, Vosseler S. Comparison of intermittent-bolus contrast imaging with conventional power Doppler sonography: Quantification of tumour perfusion in small animals. Ultrasound Med Biol. 2002;29:1093–1103. doi: 10.1016/s0301-5629(03)00060-7. [DOI] [PubMed] [Google Scholar]
- McDannold N, Vykhodtseva N, Hynynen K. MRI-guided targeted blood-brain-barrier distruption with focused ultraound: histologic findings in rabbits. Ultrasound Med Biol. 2005;31:1527–1537. doi: 10.1016/j.ultrasmedbio.2005.07.010. [DOI] [PubMed] [Google Scholar]
- McDannold N, Vykhodtseva N, Hynynen K. Targeted disruption of the blood-brain barrier with focused ultrasound: association with cavitation activity. Physics Med Biol. 2006;51:793–807. doi: 10.1088/0031-9155/51/4/003. [DOI] [PubMed] [Google Scholar]
- McDannold N, Vykhodtseva N, Hynynen K. Use of ultrasound pulses combined with Definity for targeted blood-brain barrier disruption: A feasibility study. Ultrasound Med Biol. 2007;33:584–590. doi: 10.1016/j.ultrasmedbio.2006.10.004. [DOI] [PMC free article] [PubMed] [Google Scholar]
- Mcdannold N, Vykhodtseva N, Hynynen K. Effects of acoustic parameters and ultrasound contrast agent dose on focused-ultrasound induced blood-brain barrier disruption. Ultrasound Med Biol. 2008a;34:930–937. doi: 10.1016/j.ultrasmedbio.2007.11.009. [DOI] [PMC free article] [PubMed] [Google Scholar]
- McDannold N, Vykhodtseva N, Hynynen K. Blood-brain barrier disruption induced by focused ultrasound and circulating preformed microbubbles appears to be characterized by the mechanical index. Ultrasound Med Biol. 2008b;34:834–840. doi: 10.1016/j.ultrasmedbio.2007.10.016. [DOI] [PMC free article] [PubMed] [Google Scholar]
- Pernot M, Aubry AF, Tanter M, Thomas JL, Fink M. High power transcranial beam steering for ultrasonic brain therapy. Phys Med Biol. 2003;48:2577–2589. doi: 10.1109/TMI.2010.2076829. [DOI] [PMC free article] [PubMed] [Google Scholar]
- Rim SJ, Leong-Poi H, Lindner JR, Couture D, Ellegala D, Mason H, Durieux M, Kassel NF, Kaul S. Quantification of cerebral perfusion with "real-time" contrast-enhanced ultrasound. Circulation. 2001;104:2582–2587. doi: 10.1161/hc4601.099400. [DOI] [PubMed] [Google Scholar]
- Schmidt-Nielsen K. Scaling: Why is Animal Size So Important? Cambridge: Cambridge Univ. Press; 1984. [Google Scholar]
- Sheikov N, McDannold N, Sharma S, Hynynen K. Effect of focused ultrasound applied with an ultrasound contrast agent on the tight junctional integrity of the brain microvascular endothelium. Ultrasound Med Biol. 2008;34:1093–1104. doi: 10.1016/j.ultrasmedbio.2007.12.015. [DOI] [PMC free article] [PubMed] [Google Scholar]
- Sun J, Hynynen K. The potential of transskull ultrasound therapy and surgery using the maximum available skull surface area. J Acoustical Soc Amer. 1998;104:1705–1715. doi: 10.1121/1.426863. [DOI] [PubMed] [Google Scholar]
- Treat LH, McDannold N, Vykhodtseva N, Hynynen K. Targeted delivery of doxorubicin to the rat brain at therapeutic levels using MRI-guided focused ultrasound. Int J Cancer. 2007;121:901–907. doi: 10.1002/ijc.22732. [DOI] [PubMed] [Google Scholar]
- Vykhodtseva N, McDannold N, Hynynen K. Progress and problems in the application of focused ultrasound for blood-brain barrier disruption. Ultrasonics. 2008;48:279–296. doi: 10.1016/j.ultras.2008.04.004. [DOI] [PMC free article] [PubMed] [Google Scholar]
- Wei K, Jayaweera AR, Firoozan, Kaul S. Quantification of myocardial blood flow with ultrasound-induced destruction of microbubbles administered as a constant venous infusion. Circulation. 1998;97:473–483. doi: 10.1161/01.cir.97.5.473. [DOI] [PubMed] [Google Scholar]
- Yang FL, Fu WM, Chen WS. Quantitative evaluation of the use of microbubbles with transcranial focused ultrasound on blood-brain-barrier disruption. Ultrasonics Sonochemistry. 2008;15:636–643. doi: 10.1016/j.ultsonch.2007.08.003. [DOI] [PubMed] [Google Scholar]


