Abstract
We compared the excitability of secretomotor B and vasomotor C neurons using virtual nicotinic synapses implemented with the dynamic clamp technique. In response to fast synaptic conductance (gsyn) waveforms modeled after B cell synaptic currents, it took 17.1 ± 1.2 nS to elicit spikes in 104 B cells and 3.3 ± 0.3 nS in 35 C cells. After normalizing for whole cell capacitance, C cells were still more excitable than B cells (76 ± 5 pS/pF vs. 169 ± 8 pS/pF). Stimulating C cells with slower gsyn waveforms, identical to synaptic currents in C cells, further accentuated the difference between cell types. The phentoypic excitability difference did not correlate with time in culture (1–12 days) and could not be explained by resting potential (B cells: −65.6 ± 0.9 mV, C cells: −63.1 ± 1.6 mV) or input conductance density, which was greater in C cells (24.4 ± 4.3 pS/pF) than B cells (14.5 ± 1.5 pS/pF). Action potentials elicited by virtual EPSPs had a threshold voltage for firing that was −28.4 ± 0.7 mV in C cells and −19.7 ± 0.4 mV B cells, and an upstroke velocity and peak spike potential that were greater in B cells. The repetitive firing properties of B and C cells were similar; 69–78 % phasic, 11–16 % adapting and 11–15 % tonic. We propose that B and C neurons express different types of Na+ channels that shape how they integrate nicotinic synaptic potentials.
Keywords: nicotinic synapses, synaptic integration, dynamic clamp, sympathetic ganglia
1. Introduction
Target specificity defines functional subclasses of mammalian sympathetic neurons, which in some cases can also be identified by firing properties, neuropeptide expression and neuromodulatory mechanisms (Cassell et al., 1986; Gibbins, 1995; Jänig, 2006). Some of the earliest evidence for this principle came from studies in toads of paravertebral sympathetic ganglia 9 and 10 (Gibbins, 1995; Honma, 1970; Nishi et al., 1965). Subsequent work in the bullfrog confirmed ganglia 9 and 10 contain two major neuronal subtypes that are easy to identify in isolated preparations (Dodd et al., 1983; Smith, 1994). Secretomotor B neurons and vasomotor C neurons differ in the segmental origins of their preganglionic inputs, pre- and postganglionic axonal conduction velocities, the expression of different muscarinic responses and neuropeptide Y. From the physiological perspective, phenotypic specialization in the organization of ganglionic synapses suggests that sympathetic cell types perform different integrative functions (Karila et al., 2000).
To assess the specialization of synaptic integration, we began dynamic clamp experiments (Kullmann et al., 2004) to study interactions between virtual nicotinic synapses whose properties were defined from voltage-clamp measurements of synaptic currents (Marshall, 1986; Shen et al., 1995), current-clamp estimates of synaptic convergence (Karila et al., 2000; Purves et al., 1986) and in vivo measurements of natural activity patterns (Ivanoff et al., 1995; McLachlan et al., 1997; McLachlan et al., 1998). This approach has shown that summation of weak secondary EPSPs can lead to postganglionic amplification of preganglionic activity and that muscarinic excitation can further enhance ganglionic gain (Kullmann et al., 2006; Wheeler et al., 2004). From the outset, the experiments on synaptic gain required a method for standardizing the strength of virtual nicotinic synapses. For this purpose virtual synapses were normalized in terms of the threshold synaptic conductance (gsyn), defined as the minimum conductance required to stimulate an action potential (Kullmann et al., 2006; Kullmann et al., 2004). Measurements of threshold-gsyn revealed it was higher in B neurons than C neurons (Kullmann et al., 2007). Initially this difference did not seem surprising because B neurons are generally larger than C neurons (Dodd et al., 1983). We now show that size alone cannot account for the greater excitability of vasomotor C neurons and propose that the Na+ channels expressed by the two cell types differ in their voltage-sensitivity.
2. Materials and methods
Sympathetic neurons were enzymatically dissociated from bullfrog (Rana catesbeiana) paravertebral ganglia 9 and 10 and maintained in culture for up to 2 weeks at room temperature in air (Wheeler et al., 2004). The ganglia were obtained from male and female bullfrogs (3 to 7 inches) that had been killed by rapid brainstem transection and double-pithing using a procedure approved by the University of Pittsburgh Institutional Animal Care and Use Committee.
Cells were grown in diluted L-15 medium supplemented with 5% fetal bovine serum, 5 mM dextrose, 2 mM L-glutamine, 1 mM CaCl2, 100 U/ml penicillin and 100 μg/ml streptomycin (Wheeler et al., 2004). Under these conditions very few neurons developed processes even after several days in vitro. Because bullfrog sympathetic neurons are monopolar in vivo, only cells without processes were chosen for recording.
Whole-cell perforated-patch recordings were made at room temperature with amphotericin B as the ionophore (250 μg/ml), which was dissolved in an internal solution that contained (in mM): 110 potassium gluconate, 10 NaCl, and 5 NaHEPES, adjusted to pH 7.2. The extracellular Ringer solution contained (in mM): 115 NaCl, 2 KCl, 1.8 CaCl2, and 4 NaHEPES, adjusted to pH 7.3.
The G-clamp dynamic clamp system (Kullmann et al., 2004) was operated at 10 kHz in the present experiments and consisted of an Axoclamp 2B amplifier (Molecular Devices, Sunnyvale, CA), an embedded Pentium III controller running under a real-time operating system (National Instruments, Austin, TX), a Windows-based host computer and G-clamp software (http://hornlab.neurobio.pitt.edu) written in National Instruments LabVIEW-RT 6.1 (G-clamp version 1.2) or LabVIEW-RT 8.0 (G-clamp version 2.0).
Virtual nicotinic synapses were implemented based on Isyn(t) = k × gsyn(t) × (VM − Erev), where k is a dimensionless scaling factor used to adjust synaptic strength and gsyn(t) models the time course of the synaptic conductance as the sum of two exponentials (Schobesberger et al., 2000). The time constants were 1 ms for the rising phase and 5 ms or 10 ms for the falling phase in accord with experimentally measured synaptic currents (Marshall, 1986; Shen et al., 1995). To produce gsyn waveforms with a peak of 1 nS, the time course was calculated as 1.869 (e−t/5 − e−t) for τ = 5 ms and as 1.435 (e−t/10 − e−t) for τ = 10 ms. The reversal potential (Erev) for nicotinic currents was set to 0 mV (Shen et al., 1995). Threshold-gsyn, defined as the minimum synaptic conductance required to trigger an action potential, was determined with an automated binary search routine that delivered a virtual nicotinic EPSP every 2 seconds and typically found threshold-gsyn within 10 trials (Kullmann et al., 2004; Schobesberger et al., 2000).
Secretomotor B cells and vasomotor C cells were identified by their different responses to bath-applied muscarinic agonists (1–10 μM oxotremorine-M or 1–10 μM ±-muscarine chloride) using slow voltage-ramps in a voltage-clamp protocol (Kurenny et al., 1994). Muscarinic stimulation inhibited M-current in B cells and activated an inwardly rectifying potassium current in C cells. Input resistances were measured in the linear range of the steady-state I–V relation, generally between −60 and −80 mV.
Simulations of a conductance-based model sympathetic neuron utilized custom-written MATLAB software (Neurosim 2.1, http://hornlab.neurobio.pitt.edu (Schobesberger et al., 2000; Wheeler et al., 2004)). The conductance densities and reversal potentials included a fast, inactivating sodium conductance (gNa: 8 nS/pF, Erev = 60 mV), a non-inactivating delayed rectifier potassium conductance (gK: 20 nS/pF, Erev = −90 mV), an M-type potassium conductance (gM: 0.4 nS/pF, Erev = −90 mV) and a voltage-insensitive leak conductance (gleak: 0.03 nS/pF, Erev = −40 mV). Gating of the voltage-sensitive conductances followed published kinetic equations (Schobesberger et al., 2000).
Action potential parameters (AP threshold, maximum dV/dt and AP peak) were determined from spikes elicited by virtual EPSPs at threshold-gsyn using the dynamic clamp. AP threshold was measured by eye as the point where dV/dt begins to increase at the foot of the upstroke.
Averages are expressed as the mean ± SEM, unless noted otherwise. Statistical comparisons between grouped data employed two-sided t-tests or Mann Whitney tests, with p<0.05 as the criterion for significance.
3. Results
3.1. Differences in the excitability of B and C neurons
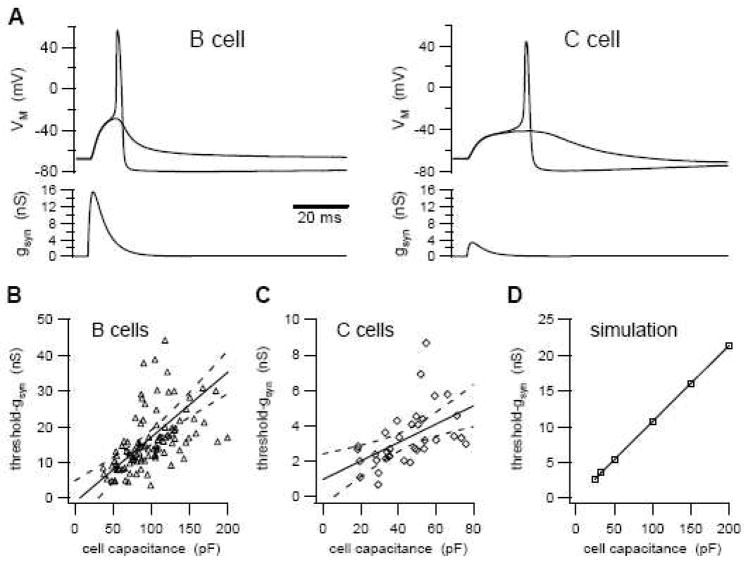
The excitability of secretomotor B neurons and vasomotor C neurons was compared by measuring threshold-gsyn in cells that had first been identified by their responses to muscarinic stimulation. B neurons required a much larger synaptic conductance to reach threshold than C neurons (Fig. 1). The recordings in Figure 1A illustrate voltage responses that closely straddled threshold and the corresponding synaptic conductance waveforms used as the command signal for the dynamic clamp. Similar results were observed in a large group of recordings where threshold-gsyn was 17.1 ± 1.2 nS in 104 B cells and 3.3 ± 0.3 nS in 35 C cells (p<0.0001, Mann-Whitney test). Cell numbers are the same in subsequent data, except where noted otherwise.
Figure 1.
Threshold-gsyn in bullfrog B and C neurons is proportional to cell size. A Examples of responses that straddle action potential threshold in a B neuron and a C neuron (top traces). These virtual EPSPs were produced using nicotinic synaptic conductance waveforms as the command signal for the dynamic clamp. The gsyn waveforms (lower traces) reflect threshold-gsyn. B–C Plots of threshold-gsyn versus cell size have different slopes for B neurons (B) and C neurons (C). Broken lines indicate 95% confidence limits of the linear regressions (solid lines). D Simulations of a conductance-based model sympathetic neuron. A linear relation exists between threshold-gsyn and cell capacitance when conductance densities are held constant.
The five-fold difference in threshold-gsyn between B and C neurons could not be accounted for by cell size. Consistent with observations that B neurons are larger than C neurons (Dodd et al., 1983; Jan et al., 1982), whole-cell capacitance was 100.1 ± 3.5 pF in B cells and 44.3 ± 2.7 pF in C cells (p<0.0001, t-test). Dividing threshold-gsyn by whole-cell capacitance showed that C cells required less synaptic conductance to fire than did B cells (76 ± 5 pS/pF vs. 169 ± 8 pS/pF; p<0.0001, Mann-Whitney test). Linear regression analysis of the threshold vs. capacitance data for individual cells confirmed the phenotypic difference in excitability (Fig. 1B, C). The slope of the relationship was 182 ± 29 pS/pF in B cells (p<0.0001, Spearman correlation coefficient r=0.6785) and 52 ± 15 pS/pF in C cells (p=0.002, Spearman correlation coefficient r=0.6546). These linear correlations suggest that in both cell types excitability scales with size. Simulation of a conductance-based model sympathetic neuron confirmed that threshold-gsyn was proportional to cell surface area when conductance densities were held constant (Fig. 1D).
The different correlations between threshold-gsyn and capacitance indicate that B and C cells differ either in the types of non-synaptic ion channels they express or possibly in channel densities. Further evidence of such phenotypic specialization came from measurements of passive membrane properties. Although the resting potentials of B and C neurons were indistinguishable (B cells: −65.6 ± 0.9 mV, C cells: −63.1 ± 1.6 mV; p=0.182, t-test), C neurons had higher input resistances than B neurons (1906 ± 210 MΩ vs. 1241 ± 88 MΩ; p=0.0022, Mann Whitney test). However, after normalizing for cell size the specific membrane conductance was actually larger in C cells than in B cells (24.4 ± 4.3 pS/pF vs. 14.5 ± 1.5 pS/pF; p=0.023, Mann Whitney test). All else being equal, the higher resting membrane conductance of C neurons would tend to make them less excitable than B cells. Since the opposite was observed, differences in resting membrane conductance cannot account for the phenotypic difference in threshold-gsyn.
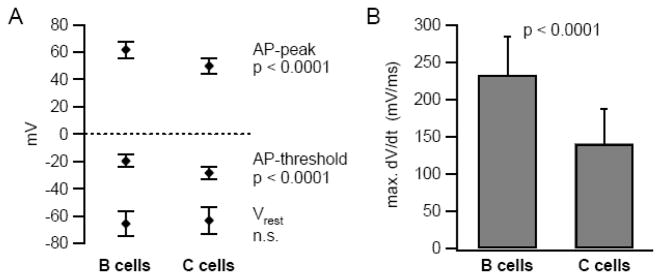
Another possible explanation for the greater excitability of C neurons is that they express a higher density of voltage dependent Na+ channels than B neurons. If this were the case, one would expect to see differences in action potential threshold, amplitude and rate of rise (Fig. 2). Consistent with this prediction, action potential threshold was significantly more negative in C cells (−28.4 ± 0.7 mV) than in B cells (−19.7 ± 0.4 mV; p<0.0001, t-test) (also see Fig. 1A). However, maximum dV/dt during the upstroke, which reflects peak inward current, and membrane potential at the peak of the action potential peak were both lower in C cells (max. dV/dt: 140.1 ± 8.0 vs. 232.7 ± 5.1 mV/ms; p<0.0001, Mann Whitney test; AP peak: 49.8 ± 0.9 vs. 61.7 ± 0.6 mV; p<0.0001, t-test). The upstroke and spike amplitude data are consistent with higher Na+ channel density in B neurons, but cannot explain the more negative spike threshold seen in C neurons. To account for the data, we postulate that Na+ channels in the two cell types differ in their voltage dependence and possibly kinetics.
Figure 2.
B and C neurons differ in action potential threshold, AP peak (A) and maximum upstroke velocity (B). Error bars in this figure indicate standard deviations (SD).
3.2. Excitability remains stable in vitro
Growing dissociated bullfrog sympathetic neurons in serum-free culture medium can alter the expression of voltage-dependent Na+ and Ca2+ channels (Lei et al., 1997; Lei et al., 2001). Although the cells in our experiments were grown in 5% serum for up to 12 days in vitro (DIV), we wanted to test whether the time in culture could somehow account for the observed cell specific differences in threshold-gsyn. When the threshold-gsyn density data for individual B and C cells was plotted as a function of time in culture, linear regression analysis failed to reveal any changes in threshold-gsyn density over 12 DIV (Fig. 3; B cells: −5.8 ± 3.6 (pS/pF)/DIV, p=0.108, Spearman correlation coefficient r=−0.1474; C cells: −1.3 ± 2.8 (pS/pF)/DIV, p=0.639, Spearman correlation coefficient r=−0.137). Moreover, there was no difference in the distributions of DIV sampled for threshold-gsyn measurements in B and C cells (p=0.939, Kolmogorov-Smirnov test).
Figure 3.
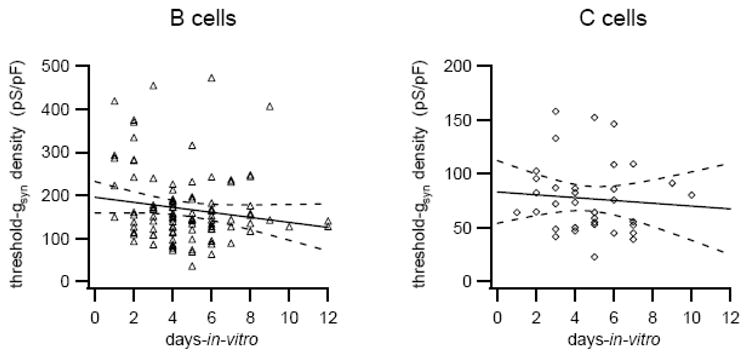
Differences in threshold-gsyn density between B and C neurons do not change with time in culture (days-in-vitro). Broken lines indicate 95% confidence limits of the linear regressions (solid lines).
3.3. Nicotinic channel kinetics contributes to the cellular disparity in threshold-gsyn
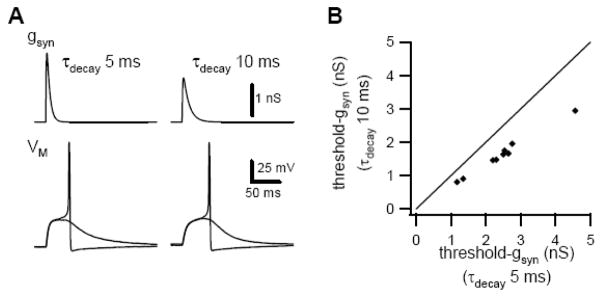
In experiments to this point the same virtual synaptic conductance waveform was used to study B and C neurons (τrise=1 ms, τdecay=5 ms). However, voltage clamp analysis of real synaptic currents in this system has shown that EPSCs decay at a slower rate in C cells (τdecay= 10 ms) than in B cells (τdecay= 5 ms) (Marshall, 1986; Shen et al., 1995). We therefore made paired measurements of threshold-gsyn in C cells using virtual conductance waveforms with decay time constants of 5 ms and 10 ms. Slowing the decay of the virtual synaptic conductance reduced threshold-gsyn in 9 neurons by 34% from 2.45 ± 0.32 nS to 1.62 ± 0.21 nS (p<0.0001, paired t-test; Fig. 4).
Figure 4.
Prolonging the decay time constant of the virtual synaptic conductance reduces threshold-gsyn. A Sub-threshold and supra-threshold responses of a C neuron when stimulated with virtual nicotinic conductances having different decay time constants. B Comparison of threshold-gsyn in 9 C neurons determined using virtual nicotinic conductances with decay time constants of 5 and 10 ms.
3.4. Patterns of phasic and tonic firing in B and C neurons
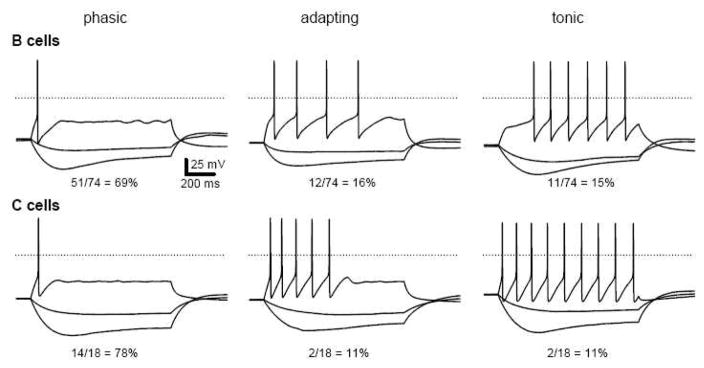
Differences in firing dynamics may contribute to the phenotypic specialization of autonomic neurons (Cassell et al., 1986; Jobling et al., 1999; Luther et al., 2009; Wang et al., 1995). In response to long depolarizing current pulses whose amplitudes are sufficient to drive maximal responses, phasic neurons fire one or two action potentials, tonic neurons fire repetitively and adapting neurons fire several times before going silent. Although most, if not all, sympathetic neurons in paravertebral ganglia are believed to be phasic, we found this to be false in dissociated bullfrog sympathetic neurons. Large majorities of 74 B neurons and 18 C neurons were phasic, but the other two firing patterns were also found in both cell types (Fig. 5). Adapting neurons were not converted to tonic firing by increasing the magnitude of current injections. In response to one second depolarizing current pulses, 69% of B neurons were phasic, 15% tonic, and 16% adapting. Similarly, 78% of C neurons were phasic, 11% tonic and 11% adapting. Thus the diversity of firing responses to depolarization did not correlate with cellular identity. In addition, we observed that for all firing patterns in both cell types, current injections that elicited hyperpolarizing responses beyond −85 mV showed evidence of depolarizing relaxations (Fig. 5). Unlike sag responses caused by closure of M-channels, which become fully deactivated at −70 mV, sag responses like those shown in Figure 5 grew in magnitude between −85 mV and −120 mV and are known to arise from activation of H-current (Tokimasa et al., 1990).
Figure 5.
B and C neurons express a similar diversity of firing patterns, yet all express hyperpolarizing responses that sag at negative potentials due to H-current. Current pulses are −40, −16 and 100 pA for B cells and −20, −8 and 50 pA for C cells. Dotted lines denote 0 mV.
4. Discussion
Using the dynamic clamp method to produce virtual nicotinic synapses of arbitrary strength, we have shown that vasomotor sympathetic C neurons are more easily excited by synaptic currents than sympathetic secretomotor B neurons and that this difference cannot be explained simply by differences in cell size. Instead the data reveals that B and C neurons differ in their intrinsic excitability. In more general terms, the study shows that cellular excitability scales linearly with cell size and that the scaling relation can vary for different cell types. These findings have implications for the analysis of mammalian sympathetic neurons and for developmental mechanisms that regulate synaptic strength and ion channel expression.
After taking cell size into account, the simplest explanation for the 2.2-fold lower synaptic threshold-gsyn in C neurons than B neurons (Fig. 1) is that C cells have a more negative voltage-threshold for spike initiation (Fig. 2). However, the lower voltage-threshold of C neurons is paradoxical given the larger inward currents in B neurons, as evidenced by a greater maximum dV/dt during the upstroke and a more positive peak AP potential. One explanation is that B and C neurons express different types of Na+ channels.
Several observations provide evidence for heterogeneous Na+ currents in bullfrog sympathetic neurons. An earlier voltage-clamp study of dissociated bullfrog sympathetic neurons having an average whole cell capacitance of 90 pF and diameters of 40–60 μm, reported that Na+ currents begin to activate near −20 mV (Jones, 1987). Although they were not identified, the cells were probably B neurons based on size. As a comparison, identified B cells in the present study had an average capacitance of 100 pF, which corresponds to a diameter of 56 μm, while C cells had a capacitance of 44 pF, which corresponds to a diameter of 37 μm. These data are also consistent with direct size measurements indicating average diameters of 49 μm in B cells and 31 μm in C cells (Dodd et al., 1983). More important, the activation voltage for Na+ currents under voltage-clamp (Jones, 1987) agrees well with our finding that action potentials in B neurons have a threshold voltage of −19.7 ± 0.4 mV. A second interesting observation in the voltage-clamp data was the small slowly inactivating component of Na+ current that was insensitive to 1–10 μM tetrodotoxin (TTX) and sensitive to 200 μM Cd2+ (Jones, 1987). Less direct additional evidence for phenotypic heterogeneity in the Na+ currents of B and C cells is provided by extracellular recordings of postganglionic compound action potentials elicited by preganglionic stimulation (Keizer et al., 2003). In these experiments 10 μM TTX completely blocked the population B cell response, but had no effect on the population C cell response.
Functional Na+ channels are encoded by nine isoforms of pore forming α-subunits for NaV1 channels and four β-subunits that modulate the voltage sensitivity of activation (Catterall, 2000; Isom et al., 1992). Three of the α-subunits (NaV 1.5, 1.8 and 1.9) are TTX-resistant and may contribute to TTX insensitive currents in bullfrog ganglion cells. Although amphibian Na+ channel homologs have not been identified in bullfrog sympathetic neurons, the rat superior cervical ganglion (SCG) may provide clues. TTX-sensitive NaV1.1 and NaV1.7 are expressed in the SCG (Boeshore et al., 2004; Toledo-Aral et al., 1997), but TTX-resistant NaV1.8 is absent (Akopian et al., 1996). Because NaV1.9 has very slow kinetics, it seems more likely that the amphibian TTX-resistant currents are encoded by a NaV1.5 homolog. Alternatively, point mutations in other NaV subunits can significantly decrease TTX insensitivity. In this way, some species tolerate high TTX levels in their tissues without being poisoned while other animals eat TTX containing prey without harm (Lee et al., 2008). Resolving these issues may open the way to understanding mechanisms that regulate excitability and allow it to scale with cell size and type. It may also prove interesting to determine whether analogous phenotypic specialization of excitability operates in subtypes of mammalian sympathetic neurons.
The disparity in threshold-gsyn between B and C neurons becomes greater after taking nicotinic channel kinetics into account. When measured with B cell nicotinic channel kinetics (τdecay= 5 ms), threshold-gsyn density was 2.22 times greater in B cells than C cells. However, after adjusting for the 34% decrease in threshold-gsyn seen with C cell nicotinic kinetics (τdecay = 10 ms) (Fig. 4), the B to C ratio for threshold-gsyn density increases to 3.38. This could become important when considering mechanisms that control the number of synaptic boutons on sympathetic neurons and the density of nicotinic receptors at each synapse. The number of boutons on autonomic neurons scales linearly with surface area (Sargent, 1983) resulting in more boutons on B cells than C cells (Nishi et al., 1967). Clustering of nicotinic receptors on the surface of autonomic neurons is also a tightly regulated, dynamic process and it can be rapidly disrupted by dennervation and axotomy (McCann et al., 2008). How then do subclasses of sympathetic neurons regulate the strength of primary and secondary nicotinic synapses and the varying levels of synaptic convergence observed in sympathetic ganglia?
Acknowledgments
Supported by NIH grant NS21065.
Footnotes
Publisher's Disclaimer: This is a PDF file of an unedited manuscript that has been accepted for publication. As a service to our customers we are providing this early version of the manuscript. The manuscript will undergo copyediting, typesetting, and review of the resulting proof before it is published in its final citable form. Please note that during the production process errors may be discovered which could affect the content, and all legal disclaimers that apply to the journal pertain.
References
- Akopian AN, Sivilotti L, Wood JN. A tetrodotoxin-resistant voltage-gated sodium channel expressed by sensory neurons. Nature. 1996;379:257–262. doi: 10.1038/379257a0. [DOI] [PubMed] [Google Scholar]
- Boeshore KL, Schreiber RC, Vaccariello SA, Sachs HH, Salazar R, Lee J, Ratan RR, Leahy P, Zigmond RE. Novel changes in gene expression following axotomy of a sympathetic ganglion: a microarray analysis. J Neurobiol. 2004;59:216–235. doi: 10.1002/neu.10308. [DOI] [PubMed] [Google Scholar]
- Cassell JF, Clark AL, McLachlan EM. Characteristics of phasic and tonic sympathetic ganglion cells of the guinea-pig. J Physiol. 1986;372:457–483. doi: 10.1113/jphysiol.1986.sp016020. [DOI] [PMC free article] [PubMed] [Google Scholar]
- Catterall WA. From ionic currents to molecular mechanisms: the structure and function of voltage-gated sodium channels. Neuron. 2000;26:13–25. doi: 10.1016/s0896-6273(00)81133-2. [DOI] [PubMed] [Google Scholar]
- Dodd J, Horn JP. A reclassification of B and C neurones in the ninth and tenth paravertebral sympathetic ganglia of the bullfrog. J Physiol. 1983;334:255–269. doi: 10.1113/jphysiol.1983.sp014493. [DOI] [PMC free article] [PubMed] [Google Scholar]
- Gibbins IL. Chemical neuroanatomy of sympathetic ganglia. In: McLachlan EM, editor. Autonomic Ganglia. Vol. 6. Harwood; Luxembourg: 1995. p. 518. [Google Scholar]
- Honma S. Functional differentiation in sB and sC neurons of toad sympathetic ganglia. Jpn J Physiol. 1970;20:281–295. doi: 10.2170/jjphysiol.20.281. [DOI] [PubMed] [Google Scholar]
- Isom LL, De Jongh KS, Patton DE, Reber BF, Offord J, Charbonneau H, Walsh K, Goldin AL, Catterall WA. Primary structure and functional expression of the beta 1 subunit of the rat brain sodium channel. Science. 1992;256:839–842. doi: 10.1126/science.1375395. [DOI] [PubMed] [Google Scholar]
- Ivanoff AY, Smith PA. In vivo activity of B- and C-neurones in the paravertebral sympathetic ganglia of the bullfrog. J Physiol. 1995;485 (Pt 3):797–815. doi: 10.1113/jphysiol.1995.sp020770. [DOI] [PMC free article] [PubMed] [Google Scholar]
- Jan LY, Jan YN. Peptidergic transmission in sympathetic ganglia of the frog. J Physiol. 1982;327:219–246. doi: 10.1113/jphysiol.1982.sp014228. [DOI] [PMC free article] [PubMed] [Google Scholar]
- Jänig W. The Integrative Action of the Autonomic Nervous System. Cambridge University Press; Cambridge: 2006. p. 610. [Google Scholar]
- Jobling P, Gibbins IL. Electrophysiological and morphological diversity of mouse sympathetic neurons. J Neurophysiol. 1999;82:2747–2764. doi: 10.1152/jn.1999.82.5.2747. [DOI] [PubMed] [Google Scholar]
- Jones SW. Sodium currents in dissociated bull-frog sympathetic neurones. J Physiol. 1987;389:605–627. doi: 10.1113/jphysiol.1987.sp016674. [DOI] [PMC free article] [PubMed] [Google Scholar]
- Karila P, Horn JP. Secondary nicotinic synapses on sympathetic B neurons and their putative role in ganglionic amplification of activity. J Neurosci. 2000;20:908–918. doi: 10.1523/JNEUROSCI.20-03-00908.2000. [DOI] [PMC free article] [PubMed] [Google Scholar]
- Keizer DW, West PJ, Lee EF, Yoshikami D, Olivera BM, Bulaj G, Norton RS. Structural basis for tetrodotoxin-resistant sodium channel binding by mu-conotoxin SmIIIA. J Biol Chem. 2003;278:46805–46813. doi: 10.1074/jbc.M309222200. [DOI] [PubMed] [Google Scholar]
- Kullmann PHM, Horn JP. Excitatory muscarinic modulation strengthens virtual nicotinic synapses on sympathetic neurons and thereby enhances synaptic gain. J Neurophysiol. 2006;96:3104–3113. doi: 10.1152/jn.00589.2006. [DOI] [PMC free article] [PubMed] [Google Scholar]
- Kullmann PHM, Horn JP. Activity-dependent regulation of the M-type K+ conductance contributes to specialized integrative properties of vasomotor and secretomotor sympathetic neurons. Society for Neuroscience Abstracts 2007 [Google Scholar]
- Kullmann PHM, Wheeler DW, Beacom J, Horn JP. Implementation of a fast 16-Bit dynamic clamp using LabVIEW-RT. J Neurophysiol. 2004;91:542–554. doi: 10.1152/jn.00559.2003. [DOI] [PubMed] [Google Scholar]
- Kurenny DE, Chen H, Smith PA. Effects of muscarine on K+-channel currents in the C-cells of bullfrog sympathetic ganglion. Brain Res. 1994;658:239–251. doi: 10.1016/s0006-8993(09)90031-2. [DOI] [PubMed] [Google Scholar]
- Lee CH, Ruben PC. Interaction between voltage-gated sodium channels and the neurotoxin, tetrodotoxin. Channels (Austin) 2008;2:407–412. doi: 10.4161/chan.2.6.7429. [DOI] [PubMed] [Google Scholar]
- Lei S, Dryden WF, Smith PA. Regulation of N- and L-type Ca2+ channels in adult frog sympathetic ganglion B cells by nerve growth factor in vitro and in vivo. J Neurophysiol. 1997;78:3359–3370. doi: 10.1152/jn.1997.78.6.3359. [DOI] [PubMed] [Google Scholar]
- Lei S, Dryden WF, Smith PA. Nerve growth factor regulates sodium but not potassium channel currents in sympathetic B neurons of adult bullfrogs. J Neurophysiol. 2001;86:641–650. doi: 10.1152/jn.2001.86.2.641. [DOI] [PubMed] [Google Scholar]
- Luther JA, Birren SJ. p75 and TrkA signaling regulates sympathetic neuronal firing patterns via differential modulation of voltage-gated currents. J Neurosci. 2009;29:5411–5424. doi: 10.1523/JNEUROSCI.3503-08.2009. [DOI] [PMC free article] [PubMed] [Google Scholar]
- Marshall LM. Different synaptic channel kinetics in sympathetic B and C neurons of the bullfrog. J Neurosci. 1986;6:590–593. doi: 10.1523/JNEUROSCI.06-02-00590.1986. [DOI] [PMC free article] [PubMed] [Google Scholar]
- McCann CM, Tapia JC, Kim H, Coggan JS, Lichtman JW. Rapid and modifiable neurotransmitter receptor dynamics at a neuronal synapse in vivo. Nat Neurosci. 2008;11:807–815. doi: 10.1038/nn.2145. [DOI] [PMC free article] [PubMed] [Google Scholar]
- McLachlan EM, Davies PJ, Habler HJ, Jamieson J. On-going and reflex synaptic events in rat superior cervical ganglion cells. J Physiol. 1997;501 (Pt 1):165–181. doi: 10.1111/j.1469-7793.1997.165bo.x. [DOI] [PMC free article] [PubMed] [Google Scholar]
- McLachlan EM, Habler HJ, Jamieson J, Davies PJ. Analysis of the periodicity of synaptic events in neurones in the superior cervical ganglion of anaesthetized rats. J Physiol. 1998;511 (Pt 2):461–478. doi: 10.1111/j.1469-7793.1998.461bh.x. [DOI] [PMC free article] [PubMed] [Google Scholar]
- Nishi S, Soeda H, Koketsu K. Studies on sympathetic B and C neurons and patterns of pregnaglionic innervation. J Cell Physiol. 1965;66:19–32. doi: 10.1002/jcp.1030660103. [DOI] [PubMed] [Google Scholar]
- Nishi S, Soeda H, Koketsu K. Release of acetylcholine from sympathetic preganglionic nerve terminals. J Neurophysiol. 1967;30:114–134. [Google Scholar]
- Purves D, Rubin E, Snider WD, Lichtman J. Relation of animal size to convergence, divergence, and neuronal number in peripheral sympathetic pathways. J Neurosci. 1986;6:158–163. doi: 10.1523/JNEUROSCI.06-01-00158.1986. [DOI] [PMC free article] [PubMed] [Google Scholar]
- Sargent PB. The number of synaptic boutons terminating on Xenopus cardiac ganglion cells is directly correlated with cell size. J Physiol. 1983;343:85–104. doi: 10.1113/jphysiol.1983.sp014882. [DOI] [PMC free article] [PubMed] [Google Scholar]
- Schobesberger H, Wheeler DW, Horn JP. A model for pleiotropic muscarinic potentiation of fast synaptic transmission. J Neurophysiol. 2000;83:1912–1923. doi: 10.1152/jn.2000.83.4.1912. [DOI] [PubMed] [Google Scholar]
- Shen WX, Horn JP. A presynaptic mechanism accounts for the differential block of nicotinic synapses on sympathetic B and C neurons by d-tubocurarine. J Neurosci. 1995;15:5025–5035. doi: 10.1523/JNEUROSCI.15-07-05025.1995. [DOI] [PMC free article] [PubMed] [Google Scholar]
- Smith PA. Amphibian sympathetic ganglia: an owner’s and operator’s manual. Prog Neurobiol. 1994;43:439–510. doi: 10.1016/0301-0082(94)90062-0. [DOI] [PubMed] [Google Scholar]
- Tokimasa T, Akasu T. Cyclic AMP regulates an inward rectifying sodium-potassium current in dissociated bull-frog sympathetic neurones. J Physiol. 1990;420:409–429. doi: 10.1113/jphysiol.1990.sp017920. [DOI] [PMC free article] [PubMed] [Google Scholar]
- Toledo-Aral JJ, Moss BL, He ZJ, Koszowski AG, Whisenand T, Levinson SR, Wolf JJ, Silos-Santiago I, Halegoua S, Mandel G. Identification of PN1, a predominant voltage-dependent sodium channel expressed principally in peripheral neurons. Proc Natl Acad Sci U S A. 1997;94:1527–1532. doi: 10.1073/pnas.94.4.1527. [DOI] [PMC free article] [PubMed] [Google Scholar]
- Wang HS, McKinnon D. Potassium currents in rat prevertebral and paravertebral sympathetic neurones: control of firing properties. J Physiol. 1995;485 (Pt 2):319–335. doi: 10.1113/jphysiol.1995.sp020732. [DOI] [PMC free article] [PubMed] [Google Scholar]
- Wheeler DW, Kullmann PHM, Horn JP. Estimating use-dependent synaptic gain in autonomic ganglia by computational simulation and dynamic-clamp analysis. J Neurophysiol. 2004;92:2659–2671. doi: 10.1152/jn.00470.2004. [DOI] [PubMed] [Google Scholar]


