Abstract
Genome wide association studies (GWAS) are an important approach to understanding the genetic mechanisms behind human diseases. Single nucleotide polymorphisms (SNPs) are the predominant markers used in genome wide association studies, and the ability to predict which SNPs are likely to be functional is important for both a priori and a posteriori analyses of GWA studies. This article describes the design, implementation and evaluation of a family of systems for the purpose of identifying SNPs that may cause a change in phenotypic outcomes. The methods described in this article characterize the feasibility of combinations of logical and probabilistic inference with federated data integration for both point and regional SNP annotation and analysis. Evaluations of the methods demonstrate the overall strong predictive value of logical, and logical with probabilistic, inference applied to the domain of SNP annotation.
Keywords: Single nucleotide polymorphisms (SNPs), Federated data integration, SNP annotation system, logical inference, probabilistic inference, SNP evaluation
1. Introduction
The future of both public health and healthcare likely will include aspects of the vision of predictive, preventive and personalized medicine articulated by both Hood and Zerhouni [1, 2]. They describe using molecular mechanisms to better identify diseases before they become symptomatic as a core challenge that will require a translational approach. Paramount to achieving this vision is an in-depth understanding of the genetic risks of individual patients.
Genome wide association studies (GWAS) play an important role in uncovering the genetic mechanisms behind human disease. Using single nucleotide polymorphisms (SNPs) as markers, genome wide association studies measure the correlation between polymorphisms and phenotypic traits of interest using traditional epidemiologic measures [3, 4]. While genome wide association studies have shown some promise, the results have been modest and often lacking in evidence for a functional mechanism [5]. Understanding the functional mechanisms of the results reported in genome wide association studies is the first step to making the connection between correlation and causation. This process, which we term SNP annotation, can be conducted either before or after the GWAS is completed.
2. Background - Related Work
Informatics systems for the purpose of conducting SNP annotation in an automated manner are a recent phenomenon. Previous work has been limited to certain categories, such as the PolyDoms system that looks at nonsynonymous SNPs [6] or MutDB, which examines missense SNPs [7]. No previously developed systems use a federated data integration system with a common data model in order to pull SNP-related annotation information. And, unfortunately, formal evaluations of SNP-oriented systems are at best few and far between, and at worst completely absent from literature.
Using combinations of logical and probabilistic inference, our system analyzes biological information on genetic variations. The system was built on top of a previous system, SNPit (SNP Integration Tool). SNPit is a SNP annotation system that uses the BioMediator federated data integration system [8] in order to integrate a wide range of data sources related to genetic variation annotation.
2.1. Functional SNP Annotation
A GWAS allows researchers to investigate SNPs that are shared in a group of individuals and produces a list of SNPs that are statistically associated with a particular phenotype being studied. As seen in a scenario presented in Figure 1, markers in the form of SNPs are frequent (Figure 1,1); a is then GWAS conducted where tens to hundreds of SNPs are found to be statistically significant (Figure 1, 2) correlating with the observed phenotype. However, once a GWAS is completed, investigators still need to determine the biological significance of the statistically noteworthy SNPs. Lack of reproducibility in previous GWAS studies have necessitated that studies need to be replicated in order to be published, and require that biological background be provided as part of the results [9]. Furthermore, limitations in time and costs provide additional incentive for researchers to filter their list of SNPs for resequencing purposes.
Figure 1.
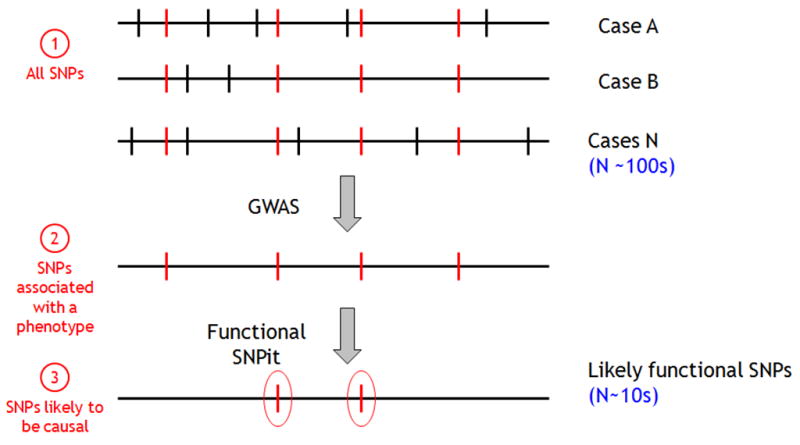
Diagram of the role of GWAS. Starting from a population of individuals with common SNPs, a GWAS is conducted, which highlights those SNPs that are statistically associated with the phenotype of interest.
Figure 2.
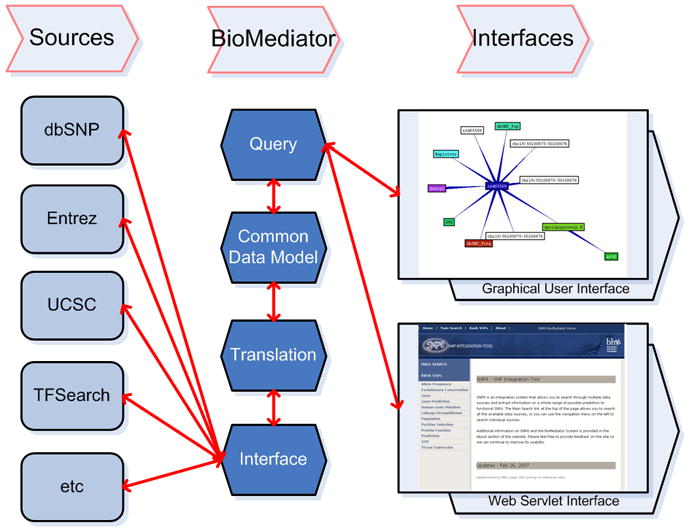
Overview diagram of SNPit [15]. The system is comprised of three sections: data sources related to SNP annotation, the BioMediator federated data integration system, and both a graphical user and web servlet interface.
The process of uncovering the functional impact of a SNP marker is what we term SNP annotation. Though this process has been done mostly via manual methods, in recent years, some informatics tools have also been created to annotate SNPs in a semi-automated or automated fashion. SNP annotation permits identification of the most likely causative, functional SNPs among those associated with a phenotype (Figure 1,3).
Figure 3.

Generalized diagram of the different components of BioMediator.
2.2. Current SNP Tools
Previous informatics tools focusing on SNP annotation have typically utilized a non-generalized data warehouse approach to data integration and examined limited categories of SNP annotations. For this manuscript, we limited our review of previous systems to those that include data integration and are published and available for use. Table 1 displays the various strengths and weaknesses of the different SNP tools currently available.
Table 1.
Table includes the comparisons of different previous SNP annotation systems.
| System Name | Focus | Limitations | Data Integration Type | Evaluation Type |
|---|---|---|---|---|
| FastSNP [9] | Changing amino acids, transcription factor, splicing | No mediated scheme, use of minor allele frequency as validation | Uses web wrappers | Case study, looking at allele frequencies |
| F-SNP [10] | splicing, transcription, translation and post- translation | Not federated, limited number of SNPs included, no evaluation | Data warehouse | None |
| LS-SNP [11] | Nonsynonymous SNPs, Protein sequences and models, pathways | Pipeline, links out to other sources | Data warehouse, links to outside sources | Case study |
| MutDB [7] | Missense SNPs | No evaluation, no federated integration system | Data warehouse, MySQL | None |
| PolyDoms [6] | Nonsynonymous SNPs | Lack of analysis tools, doesn’t look at LD, no evaluation | Data warehouse, Oracle | None |
| PupaSuite [12] | Transcription factor binding, splicing, introns, exons, evolutionary, haplotypes | No federated data integration, no evaluation | Data warehouse | None |
| SNPs3D [13] | Nonsynonymous SNPs and protein function, uses support vector machine learning | Not federated data integration, | MySQL database | Case study |
| SNPSelector [14] | Allele frequency, genotyping data | LD, dbSNP annotation, regulatory, repeat status | Data warehouse, MySQL | None |
Many of the previous SNP tools focused on annotating certain categories of SNPs, for example, LS-SNP, PolyDoms, and SNPs3D annotate nonsynonymous SNPs. Other approaches examined a wider spectrum of functional SNP predictors; systems such as FastSNP and F-SNP look at both transcription and translational mechanisms. However, a limitation of these systems is reliance on ad hoc data warehousing techniques for information storage, which places a limit to the currency of the data stored and presents challenges to incorporating additional sources of SNP information into a system. In addition, in general the ad hoc approach to data integration and warehousing has prevented the development of any formal common data models for these systems. Thus, the transformation of the individual data sources into a uniform schema during the cleaning and importing process is not often flexible enough to easily accommodate evolution of the schema for the warehouse. The exception to this limitation is FastSNP, which uses generalized wrappers to integrate information, though it still does not include a common data model in its implementation. In addition, none of the previous SNP annotation systems formally evaluated their implementations comprehensively. Evaluations that did occur generally used a limited case study approach, i.e., only a small handful of SNPs were tested and the results of this testing described in a qualitative fashion. In contrast to these existing tools, our system is the first to use a federated integration approach using both logical and probabilistic inference for the purposes of ranking functional SNP annotations; it is also the first to use a formalized evaluation approach.
2.3. Previous Work on SNPit
The SNP Integration Tool (SNPit) was implemented using the BioMediator data integration system [8, 10, 11]. Details on the implementation of the previous baseline SNPit system including the federated data integration component and common data model can be found in a previous publication [12]. There are three primary components to SNPit: the data sources themselves, which are queried on the fly by wrappers and contain data relevant to genetic variation analysis; the BioMediator federated data integration system, which accomplishes the mapping between the common data model and the data sources via the interface and translation layers; and the two interfaces that can be used by researchers to access the system (Figure 2).
3. Methods - Models
Due to the limitations of current approaches, we opted to implement our SNPit system using a federated data integration approach, thus ensuring data is always up to date. We utilized a mediated schema (common data model) in order to reconcile differences in the modelling of the different data sources to which we linked. The underlying architecture of SNPit is highly modular, and allows a user to add or remove data sources without having to modify the common data model. Modification of the common data model is facilitated by the modular architecture as well since the wrapper (interface) layer can remain the same and only the mapping layer (translation layer) from wrapper to common data model needs to be adjusted. This translation layer uses a set of mapping directives to facilitate this step. In this article, we describe important extensions to the SNPit system - specifically a framework supporting ranking of integrated SNPit results based on both logical and probabilistic inference. Providing a list of ranked SNPs allows researchers to be able to prioritize which SNPs to spend their resources on.
3.1. Federated Data Integration
The SNPit system is built upon the BioMediator data integration system developed at the University of Washington by the Biomedical Data Integration and Analysis Group [8, 11]. BioMediator was used as the underlying system to SNPit for several reasons: the federated architecture, flexible mediated schema, ease in querying, and the use of XML as a data standard. These features of BioMediator allow SNPit to retrieve recent and timely data, allow for quick adaptation or deletion of data sources, facilitate mediated schema evolution, support user friendly interfaces and retrieve disparate data in a uniform manner. The ability of the BioMediator system to bring diverse sources into a syntactically and semantically uniform representation is particularly important for supporting logical and probabilistic inference.
As a federated data integration system, BioMediator queries data sources in real time making a large and potentially cumbersome local relational data warehouse unnecessary. BioMediator has a flexible architecture and integrates both structured and semi-structured biologic data. Figure 3 displays the generalized organization of the modular components of BioMediator.
The architecture of BioMediator allows users to send a query via the user interface. The query passes through a query processor layer, which references the mediated schema for mappings between the query and the data sources. The query then passes to the metawrapper and wrappers, which translate the query semantically and connects to the data sources in their native query formats. Regardless of the original source formats, BioMediator returns results in XML. This XML is mapped onto the mediated schema by the metawrapper, is passed back through the query processor and then finally retrieved by the user through the user interface (Figure 3).
3.2. Logical Inference
BioMediator’s extensible architecture easily accommodates the inclusion of various supporting modules, including ones that apply logical and probabilistic approaches to functional SNP identification and prioritization. These orthogonal methods to SNP annotation take as input the XML data generated from the BioMediator metawrapper from various sources (in a semantically and syntactically uniform format) and produces reasoned assertions and probabilistic estimates of “belief” for retrieved, integrated database records.
The former approach, logical inference, has been employed in the past to reason over biological data, and is effective at automating some types of analyses that are usually done manually. Systems that leveraged logical reasoning have included those whose focuses were gene function assignment and phylogenetic inference [13, 14]. Previous work with BioMediator coupled the data integration engine with an expert system for the express purpose of protein annotation, where it was found that one of the greatest advantages of this approach was the transparency and ease of translating a human annotator’s decision-making process into a rule-based representation [15].
Developing an expert system to operate over SNP data follows a similar method and process; rules for functional SNP annotation and prioritization are elicited from an expert scientist (see details in section 4.1) and can be supplemented with evidence from the literature. Within the BioMediator system, a rule executes over data retrieved from multiple sources, which are semantically integrated such that the rules themselves are independent of data source, and instead reference general entities, per the mediated schema. This approach maximizes generalizability of the rules over any number of data sources, allowing rules to remain the same as individual data sources change a common occurrence in federated query and retrieval systems.
In BioMediator, when a rule is triggered and executed, the result is some assertion of fact that is readily derivable from the query graph (e.g., a database record indicates that the query SNP q does change the amino acid of its corresponding protein, and thus a new fact, IsNonSynonymous(q), is created). These assertions, in turn, can act as the antecedents to other rules, allowing for a chaining of rules. BioMediator can continue to execute rules until no further information is entailed by the current query graph.
3.3. Probabilistic Inference
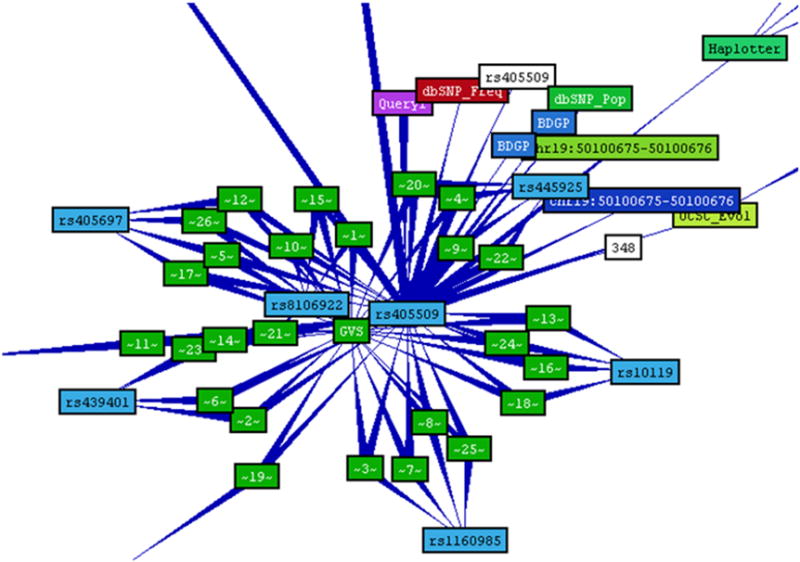
BioMediator employs an exploratory approach to query answering. First it queries the mediated data network for records that directly satisfy the query condition(s). Then it expands on these initial results by successive joins with other related records. If the network of data sources is even moderately well-connected, this exploratory method tends to produce large result sets [10]. The results take the form of a directed graph (Figure 8, see section 4.2), and an inference engine (logical and probabilistic) may reason over this graph. A seed node represents the query itself, and all other nodes represent resultant data records. The joins performed by BioMediator are represented via edges. Ideally, all of the records in a result graph would be both factual and highly-relevant to the query. In practice, however, many are speculative in nature, or weakly related. Inspection of the poorer quality results suggests that characterizing and leveraging this uncertainty could improve query result ranking (returning more certain and reliable results higher in the list). The intuition for this is simple -- biomedical data sources frequently contain tentative data. As we follow a chain of evidence through multiple records (potentially residing in multiple data sources) where each record (or connection between records) introduces additional uncertainty, our confidence in subsequent results should correspondingly decrease.
Figure 8.

Snapshot of the result graph for a sample SNP, demonstrating how each SNP resembles a cluster.
Ongoing work in biomedical data integration, the Uncertainty in Information Integration project (UII) [16], seeks to characterize the uncertainty present in biomedical data records as well as the uncertainty introduced via mediation and exploratory data integration. Nodes and edges in the graph are augmented with metrics representing our confidence (belief) in each individual record or join respectively. Nodes are given values Pi = Ps * Pri where Ps is our prior belief in nodes of a given type and source (i.e. any SNP record from dbSNP) and Pri is a posterior modifier for our belief in record i specifically, given its content (SNP records in dbSNP have a Validation Method attribute which, depending on its value, could affect our belief in record i). Similarly edges are enhanced with values Qi = Qs * Qri. P and Q values range from 0 to 1 inclusive and are interpreted as probabilistic node or edge weights respectively. Prior beliefs as well as posterior belief functions are subjective and intended to reflect the beliefs of our scientific experts.
Given a result graph with probabilistic node and edge weights, our goal is then to compute, for each record, a measure of its relevance to the query. To do so we adapted techniques from network reliability theory (2 terminal or s-t reliability). These techniques were originally conceived for calculating the reliability of communication networks in the presence of connection failures. In our case we use them to calculate the relevance of query results in the presence of uncertain data and joins. The network reliability approach allows us to compute the strength of the connection, given all connecting paths in the result graph, of a result to the original query. We rank our results according to this relevance measure (UII score).
Previous UII work, involving the functional annotation of proteins, showed promising results using probabilistic methods [10, 16]. Additionally this work addressed the appropriateness of treating subjective belief measures as probabilities and demonstrated the utility of doing so on a specific biomedical data integration task. In this work we investigate whether or not this utility carries over to our current task, functional annotation of SNPs.
4. Methods - Implementation
Previous methods to probabilistic and logical inference were extended onto the SNPit system for the purpose of predicting the functional outcome of genetic polymorphisms as detailed below.
4.1. Building Logical Inference into SNPit
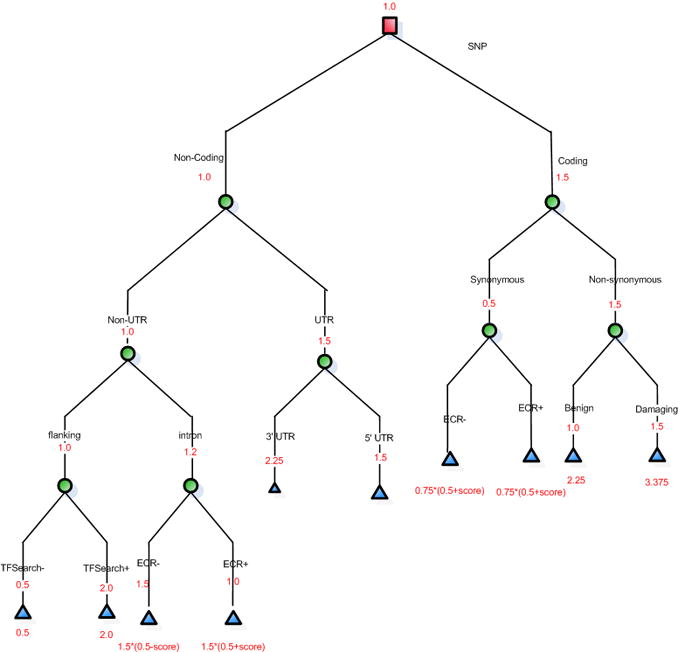
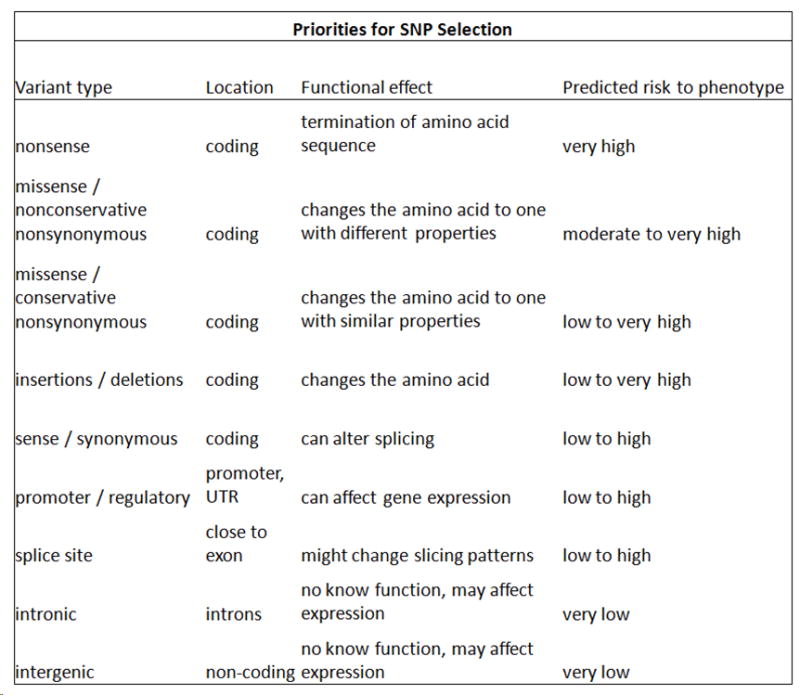
Basic biological principles as to where a SNP is located along the genome assisted us in the creation of logical rules based on a decision tree [12]. Where a SNP is located on the genome can impact the SNP’s role in transcription, translation, and regulation -- all of which play a role in creation of a normal amount of normally functioning protein. For example, nonsynonymous SNPs are thought to be the most damaging because they result in either a changed amino acid triplet or the production of a stop codon; the end result is a high likelihood of an abnormal pathologic phenotype (Figure 4). For a list of the logical algorithms used in our inference, please Appendix A in the Supplementary section. Local experts and the published literature were consulted during the process of creating our decision tree [17-20].
Figure 4.
Biological principles from previous literature used to create a decision tree (reproduced here for clarity from [25]).
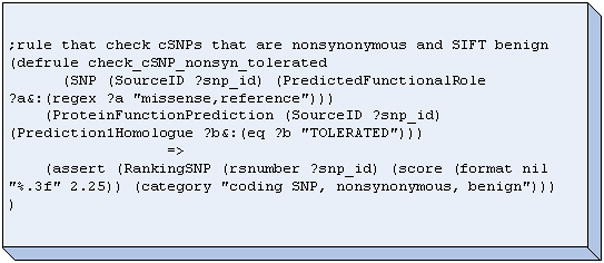
A decision tree was created based on this biological knowledge and corroborated with two SNP experts (one of whom is a co-author in this paper, CC). Heuristic weights of increasing rank and importance ranging from 1 to 4 was assigned to each node along the path of the decision tree (Figure 5). Inference rules were then created to capture this decision tree in the form of rules using a reasoning plug-in called Java Expert System Shell (Jess) [21, 22] which was incorporated into the BioMediator system. For example, Figure 6 demonstrates one such rule in Jess, in this case, the rule is fired only for nonsynonymous SNPs that are also deemed tolerant. The antecedent of the rule is a SNP that is predicted to be both coding-nonsynonymous and tolerant, and the consequent is to categorize the SNP as “coding SNP, nonsynonymous, benign” and assign it a score. Rules such as this example are then placed in working memory, and when a SNP is queried, the rules are activated and new facts represented by the rules are added to working memory. Figure 7 shows a screenshot of the logical component of SNPit, with three SNPs being ranked based on the logical inference rules described previously.
Figure 5.
Decision tree with heuristic weights assigned to the nodes (reproduced here for clarity from [15]).
Figure 6.

Jess rule checking for nonsynonymous SNPs that are predicted to be tolerant.
Figure 7.
Screenshot of the logical inference component of SNPit, demonstrating the ranking of three separate SNPS.
4.2. Building Probabilistic Inference into SNPit
In collaboration with SNP experts, probabilistic measures of prior belief, Ps and Qs, were assigned for each SNPit source. Appropriate functions were also determined for computing posterior belief values, Pr and Qr. Table 2 describes the assignments of Ps and Pr for the SNPit data sources (see 3.3 for definition of Ps and Pr).
Table 2.
Descriptions of how Pr and Ps scores are assigned to the SNPit system.
| Source | Entity | Ps (a priori belief in how good a node is) | Rationale | Pr (post belief after the record is examined) | Rationale |
|---|---|---|---|---|---|
| dbSNP | SNP | 0.9 |
|
depends |
|
| dbSNP | Allele | 0.9 |
|
depends | |
| dbSNP | Allele Frequency | 0.9 | depends | ||
| dbSNP | Population | 0.9 | depends | ||
| dbSNP | Population Group | 0.9 | depends | ||
| EntrezGene | Gene | 0.95 |
|
||
| TRANSFAC | Transcription Factor Binding | 0.7 |
|
||
| TRANSFAC | TFRecord | 0.7 | |||
| BDGP | Splice Site | 0.8 |
|
||
| HGMD | Human Gene Mutation | 0.8 |
|
||
| Haplotter | Positive Selection Evidence | 0.8 |
|
||
| SIFT | Protein Function Prediction | 0.85 |
|
||
| GVS | Linkage Disequilibrium | 0.95 |
|
||
| UCSC | Gene Prediction | 0.8 | |||
| UCSC | Tissue Expression | 0.85 |
|
||
| UCSC | Tissue Expression Score | 0.8 | |||
| UCSC | Evolutionary Conservation | 0.8 | |||
| UCSC | Evolutionary Conservation Score |
In the previous application of UII (Uncertainty in Information Integration project), functional annotation of proteins, P and Q measures were computed on a per-record basis, based solely on the data found within the record, independent of other results. For our SNPit application, however, computing P values for SNP records required knowledge external to the record itself. In part this was because we required our belief in a SNP record to reflect not just our belief in its correctness, but also our belief in its functional potential (ability to affect phenotypic outcomes). Determining a SNP’s functional potential required examining the neighbouring results in the result graph. Figure 8 shows an example SNP result graph demonstrating its clustered topology. A cluster of attribute records, further describing the SNP, surrounds each SNP record. We modified the existing UII protocol to include an additional pre-processing step augmenting the Pr value for each SNP record based on its neighbouring results.
In order to create a customized algorithm for SNP annotation, we first averaged the sources that were related to each other. Then we took the maximum score out of the unrelated sources, and averaged the independent sources. This was done in a sequential manner and a SNP score was produced. This SNP score was then combined with the original UII score to get a customized belief score with probabilistic properties. Then the UII algorithm is run and a final UII score is produced. Figure 9 is a screenshot of the probabilistic results that SNPit returns.
Figure 9.
Screenshot of the SNPit system showing the probabilistic results.
4.3. Building Logical and Probabilistic Inference into SNPit
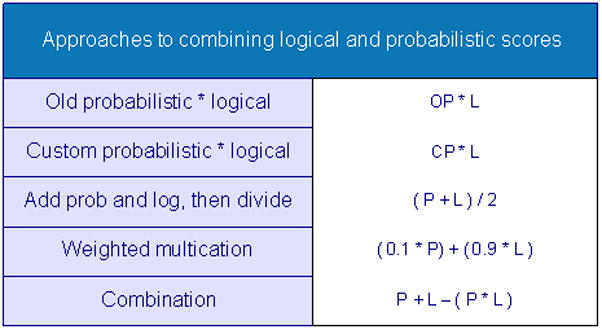
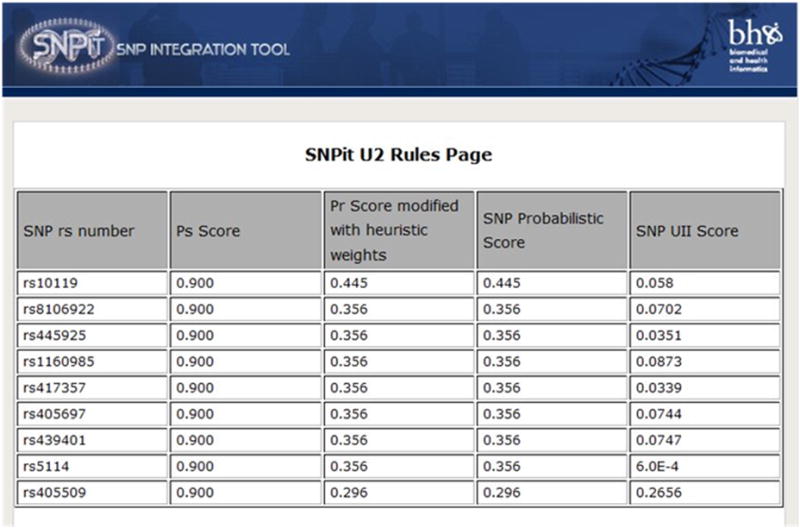
Combining the logical and probabilistic components of our system required modification of the heuristic weights we had previously described in section 4.1. The heuristic weights were transformed from a range of 1 to 4 into a number between 0 and 1. This revised logical inference value was then combined with the original Pr score to arrive at a new Pr score. This new Pr score was then applied to the UII algorithm to generate a new SNP UII score. In the process of developing this combined logical and probabilistic score, we explored numerous ways in which to combine these two metrics. Figure 10 lists the five methods we used to combine the scores: multiplying the original Pr score with the logical score, multiplying the customized probabilistic score with the logical score, averaging the logical and probabilistic scores, taking a weighed average, and using a formula for combining the probability of two independent events. Figure 11 is a screenshot of the SNPit output for both the logical and probabilistic inference approach for a regional SNP. In this example, we used the first method for combining the two scores.
Figure 10.
Different algorithms used to combine the logical and probabilistic metrics.
Figure 11.
Screenshot of logical and probabilistic inference ranking page.
5. Evaluation
One of the main challenges that we faced when trying to develop a formal evaluation of the SNPit system was the fact that as of the completion of this manuscript, there are no true gold standards for the annotation of SNPs. This is especially the case for complex diseases where genetic factors would only account for a portion of the final phenotype. We had initially considered the use of GWAS hits, but there is a subtle difference between reproducible statistical association and function. Each SNP reported from a GWAS is a tagSNP, which is usually in strong LD with one to a dozen other SNPs. All of these statistically confounded SNPs will show a statistically reproducible association, but only one is likely to be functional. On average, tagSNPs are confounded with more than 5 other SNPs in European populations, and the tagSNP does not appear any more likely to be functional than the tagged SNP. Thus, at best 20% of the tagSNPs with reproducible associations will be functional polymorphisms, so this was a less than optimal resource to use as a gold standard.
In order to arrive at an alternative standard that could be used to test the different inference methods applied to SNPit, we opted for the Human Gene Mutation Database (HGMD) as an alternative standard (version 2009.2) [23]. We chose HGMD because it provides evidence on GWAS SNPs that have been found to be statistically significant through manual curation as well as other SNPs that have been found to be potentially functional due to in vivo techniques.
We faced a similar obstacle in trying to identify a source of true negatives for our SNPit system. We eventually decided to use dbSNP; the version of dbSNP that we used (build 129) shows that out of a total approximate number of human SNPs with rs numbers, only a small percentage had some kind of functional class and were cited in PubMed [24, 25]. This strongly suggests that most of the SNPs found in dbSNP would not have a functional impact, and thus we decided to use dbSNP as our source of true negatives.
5.1. Evaluating Logical Inference of SNPit
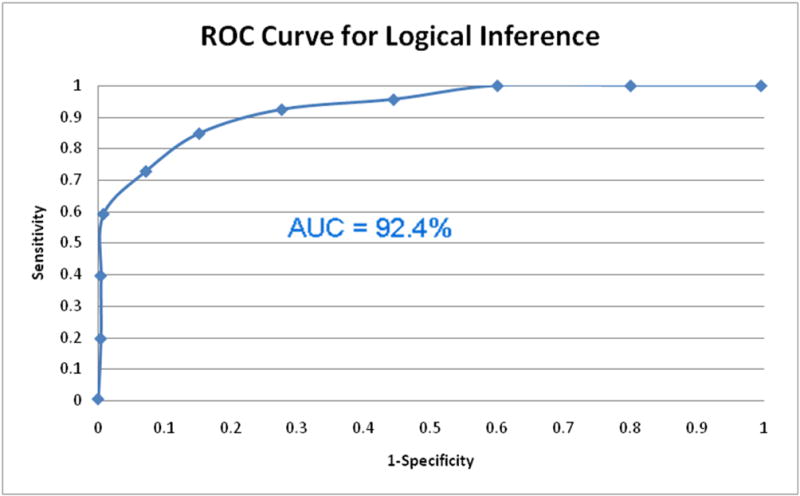
To evaluate the ranked lists of SNPs created using logical inference, recall and precision values were measured for our system. We ran 250 random SNPs from HGMD and 250 random SNPs from dbSNP through the SNPit system. The scores from the decision tree were recorded from our sources of true positives and negatives. Recall and precision measures were then taken at 50 level intervals. A receiver operating characteristic (ROC) curve was then created to assess the predictive power of SNPit using logical inference (Figure 12). The ROC curve indicated very good performance in terms of predictive ability. Using the trapezoid rule, the area under the curve (AUC) was found to be 92.4%
Figure 12.
ROC curve for SNPit with logical inference.
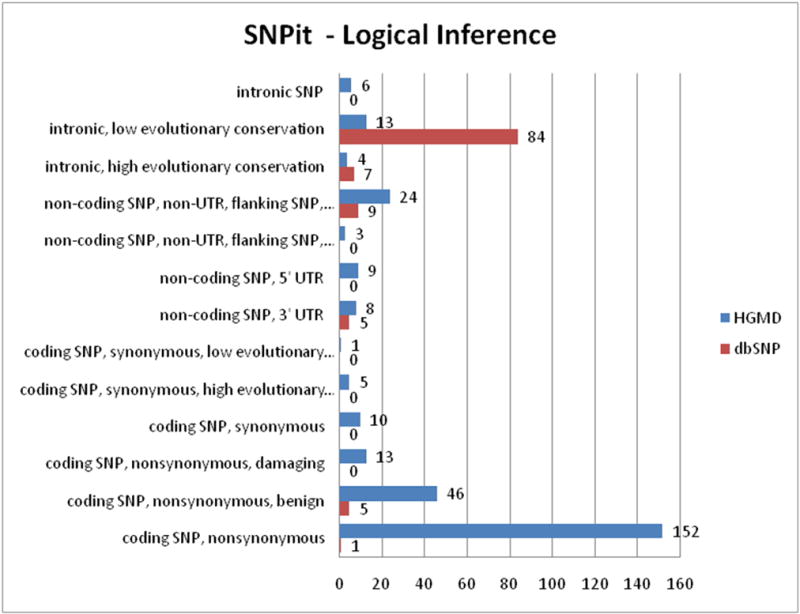
The breakdown of the classification groups that make up the logical rules (Figure 13) demonstrates that the majority of SNPs randomly selected from HGMD are classified as “coding SNP, nonsynonymous” and “coding SNP, nonsynonymous, damaging” SNPs. SNPs randomly selected from dbSNP were mainly classified as “intronic, low evoluntionary conservation”.
Figure 13.
Classification groups for logical inference results.
5.2. Evaluating Probabilistic Inference of SNPit
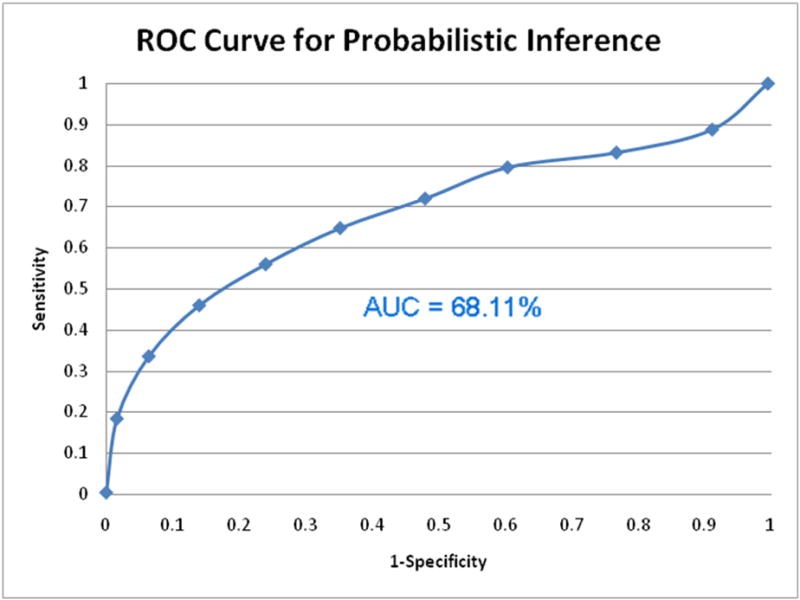
To evaluate the list of ranked SNPs produced using probabilistic inference, we again measured the recall and precision values of our ranked list. We used the 250 random SNPs from HGMD and another 250 random SNPs from dbSNP as our sources for true postives and true negatives. When the ROC curve was created for this version of our SNPit system, we found that probabilistic inference performed moderately well. The ROC curve did extend beyond the diagonal towards the upper left corner and the AUC was 68.11% (Figure 14). When we randomly split our 500 test SNPs for the probabilistic method into 10 sets of 50, we found that the average ROC is 0.68904, the 95% confidence interval is (0.626630788, 0.751449212).
Figure 14.
ROC curve for SNPit with probabilistic inference.
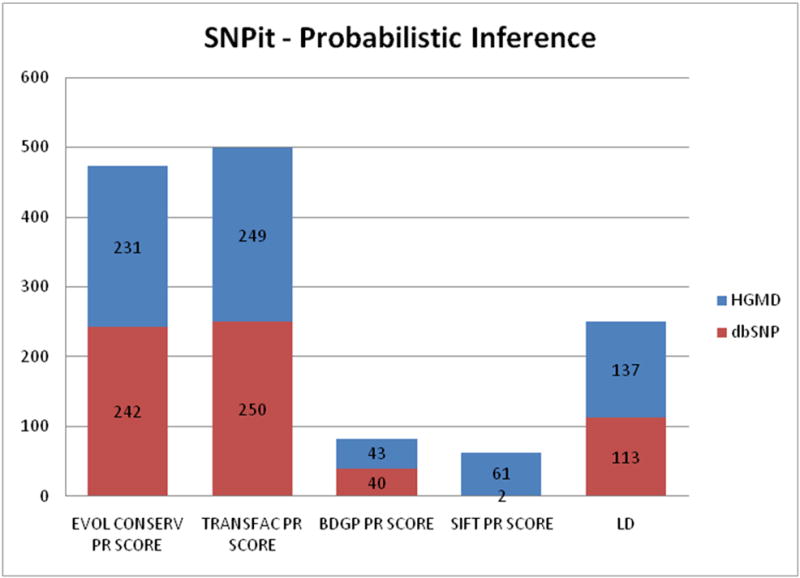
The break down of the categories that provide information for probabilistic inference reveals that randomly selected SNPs from HGMD provide more information from the SIFT and BDGP data sources, which provide nonsynonymous and splice site predictions. Information from data sources related to evolutionary conservation, transcription factor binding sites, and linkage disequilibrium provided approximately equivalent levels of information for SNPs randomly selected from HGMD and dbSNP (Figure 15).
Figure 15.
Classification groups for the data sources that provided information on probabilistic inference.
5.3. Evaluating Logical and Probabilistic Inference of SNPit
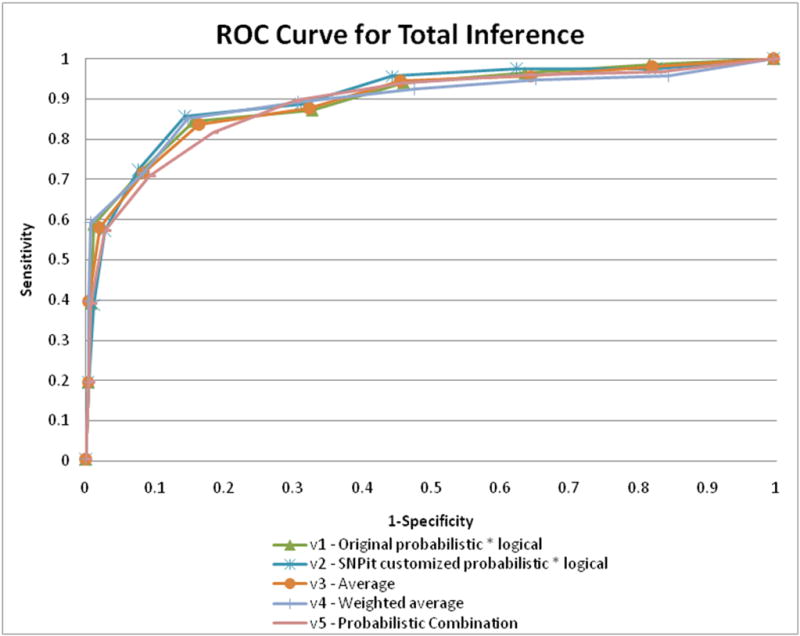
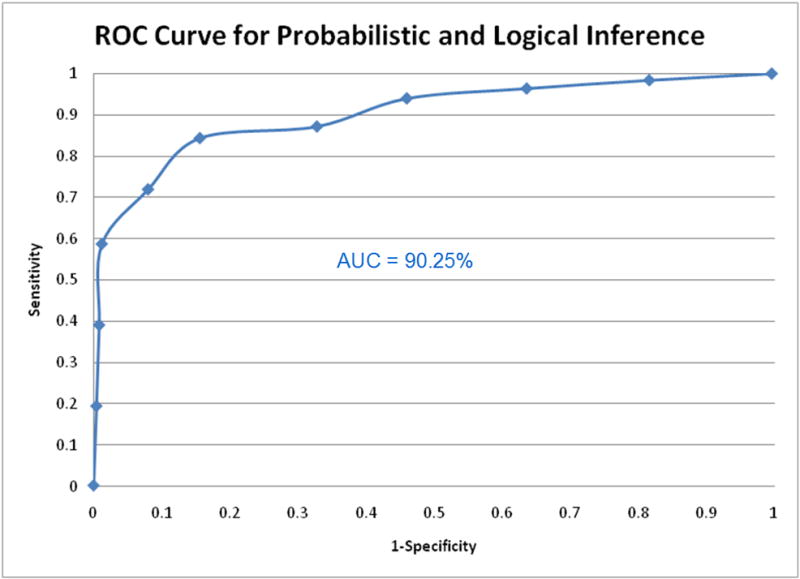
Evaluation of the logical and probabilistic inference component of SNPit followed the same procedures as described in sections 5.1 and 5.2. ROC curves were created for all five methods of combining the scores previously detailed in section 4.3. The ROC curves for all five combination methods demonstrated good predictive ability as it curves towards the top left corner of the graph; notably, the customized probabilistic score multiplied by the logical score performed the best (Figure 16). The method that performed the best, the SNPit customized probabilistic metric multiplied by the logical metric, had an area under the curve of 90.25% (Figure 17).
Figure 16.
ROC curves for the five different methods that were used to combine the logical and probabilistic scores.
Figure 17.
ROC curve of the combined probabilistic and logical inference which performed the best, the area under the curve is 90.25%.
5.4. Cross Evaluations of the Combinations of Logical and Probabilistic Inference of SNPit
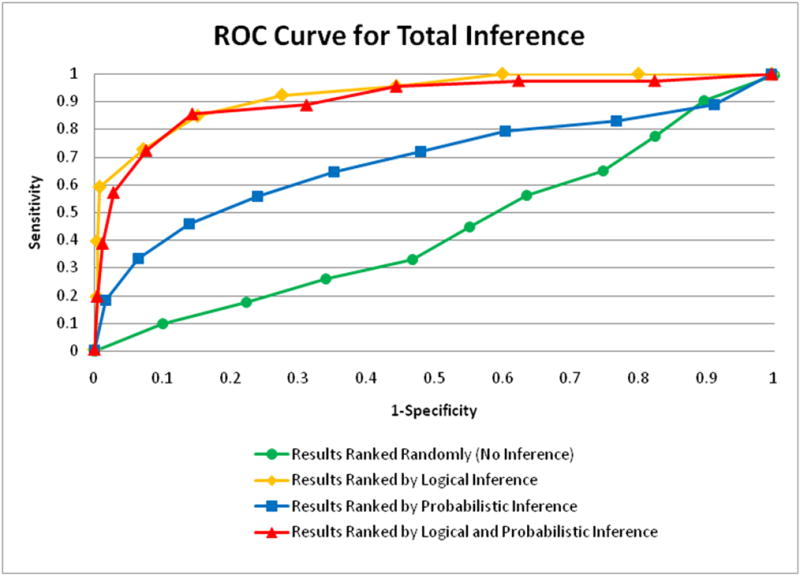
In order to evaluate all the different combinations of logical and probabilistic inference that were created and implemented for SNPit, we carried out a multiple comparison ROC curve. This allowed us to cross evaluate the results ranked by logical inference, with the results ranked by probabilistic inference, with the results ranked by the best combination method of logical and probabilistic inference, with the results ranked randomly.
The multiple comparisons ROC curve showed that logical inference performed the best. Results ranked by combined logical and probabilistic inference (using the combination method, see Figure 10) performed approximately the same, albeit slightly lower. The results ranked by probabilistic inference performed low relative to logical (though above random), and the results of random rankings performed as expected (approximating a diagonal with AUC of roughly 50%). (Figure 18).
Figure 18.
Multiple comparions ROC curve for the different versions of SNPit.
6. Discussion
This article described the design, implementation, and evaluation of a SNP annotation system with combinations of logical and probabilistic inference. We detailed the methods we used to create such a system, previously unknown in the domain of SNP annotation. To our knowledge, there had not been research in the areas of combining data integration with both logical inference and probabilistic inference in the same system.
6.1. Results
The results of this study demonstrated that SNPit with logical inference provided surprisingly good predictive power in the domain of SNP annotation. SNPit with probabilistic inference performed better than random in the domain of SNP annotation, though not nearly as well as logical. SNPit with logical and probabilistic inference combined together does perform very well, but does not contribute significantly to predictive power as compared to logical inference alone.
While the rankings generated by the probabilistic approach alone were poorer than expected (based on previous work) we considered the possibility that, when used in conjunction with logical methods, probabilistic methods might potentially improve ranking performance over logical alone. In the end they did not appear to add significant value, although the logical inference component performed strongly.
The ROC curve and AUC performed well overall for both logical and logical combined with probabilistic inference. Using the optimal threshold value of 85% sensitivity on the ROC curve, the accuracy rates were as follows: probabilistic inference - 0.648, logical inference - 0.848, logical and probabilistic inference - 0.856, and random ranking - 0.448. This demonstrates that the logical and probabilistic inference combination performs slightly better than logical inference alone, though not by a statistically significant amount.
The reasons why logical inference performed better than probabilistic inference could be that only two of the five functional categories of functional SNP data sources provided preferential information to the SNPs scored as true positives (Figure 13). Furthermore, the SNPit adaption of the UII algorithm for probabilistic inference was not fine tuned, the SNPit UII metrics could have been too closely grouped together and thus, did not provide strong classification predictions.
6.2. Limitations
The results of this article are not necessarily generalizable outside the domain of SNP annotation or the specific methods details previously. This is due to the limitations of this study stemming from both the lack of gold standards as well as the need to refine various methods in the study. As discussed previously in section 3, we were faced with the challenge of identifying a source of true positives and true negatives in this study, there is the possibility of true negatives being present in HGMD and true positives being present in dbSNP. As a result, evaluations based on these datasets may not be completely accurate, although we estimate that the error rates would be relatively small and largely inconsequential.
A further limitation concerns rs numbers that can go stale or lead to falsely dead links when different versions of dbSNP are used as the basis for lookups. For this very reason, we have favored the use of the actual SNP sequence when possible, as in the queries of BDGP and TFSEARCH. With regard to dbSNP, although rs numbers evolve over time, the database is reverse compatible, so that a query on a stale rs number that has collapsed into a new rs number will typically retrieve the correct sequence (unless the original entry has been withdrawn, rather than merged).
Another source of limitation in our evaluation stems from the lack of refinement to our logical and probabilistic methods. We did not use machine learning when designing our decision tree or UII metrics, we did not address SNPs that reside on more than one path in the decision tree and the customized algorithm used in our probabilistic inference method was not exhaustively tested and its mathematical properties were not fully explored. These limitations need to be kept in mind when examining the results.
7. Conclusions
This study demonstrates that it is feasible to incorporate combinations of both logical and probabilistic inference onto a federated data integration system for the purposes of SNP annotation. Cross evaluations of the different methods of inference demonstrated that probabilistic inference alone did not contribute significantly to the predictive power of the SNP annotation system.
In the end, combining probabilistic methods with logical methods didn’t really add value. While the probabilistic methods alone did not out-perform the logical methods, it was still possible that, in conjunction with logical methods, probabilistic methods might add some additional selectivity. We did not know beforehand if combining them would add utility or not. In the end it didn’t. We publish this as a finding nonetheless, for others who might consider a similar approach.
We point out the possibility that some optimization might improve on these results, including the choices of prior and posterior belief metrics, as well as the customized algorithm for each SNP to incorporate neighboring information when determining the posterior belief. The reason we believe optimization might improve results is that in prior work by Louie [26] optimization of parameters in a probabilistic inference system over integrated data did improve performance. These possible modifications to the prior and posterior beliefs are directions for future experiments. Time to assemble results for a given query would be another interesting parameter to present for future experiments. The difficulty of fitting the probabilistic method to a new problem (the probabilistic approach was used successfully on a previous task, protein annotation) is informative. Additionally it is informative that it may be difficult to tune the probabilistic parameters, while the logical decision tree closely mimics the way human experts would manually rank SNP results.
These results were limited by the lack of a gold standard as well as the lack of optimization in the inference techniques applied. Since this is the first study, to our knowledge, that attempts to formally evaluate a federated data integration system with combinations of logical and probabilistic inference in the domain of SNP annotation, the fact that our best performing method produced an area under the curve greater than 90 percent demonstrates that informatics methods can be used to accurately predict the functional impact of SNPs.
Supplementary Material
Acknowledgments
We would like to acknowledge the members of the Bio-DIAG team for their suggestions during the implementation of this project. We would also like to extend thanks to Drs. Melissa Austin, Jim Brinkley, and Kelly Fryer-Edwards for their insights and recommendations throughout the development of this project. Finally, we would like to thank the following funding resources: BioMediator grant: NIH R01 HG02288, UII grant: NSF # IIS-0513877, and the NLM training grant: NIH # T15 LM07442.
Footnotes
Publisher's Disclaimer: This is a PDF file of an unedited manuscript that has been accepted for publication. As a service to our customers we are providing this early version of the manuscript. The manuscript will undergo copyediting, typesetting, and review of the resulting proof before it is published in its final citable form. Please note that during the production process errors may be discovered which could affect the content, and all legal disclaimers that apply to the journal pertain.
References
- 1.Hood L, Heath JR, Phelps ME, Lin B. Systems biology and new technologies enable predictive and preventative medicine. Science. 2004;306(5696):640–3. doi: 10.1126/science.1104635. [DOI] [PubMed] [Google Scholar]
- 2.Zerhouni EA. US biomedical research: basic, translational, and clinical sciences. Jama. 2005;294(11):1352–8. doi: 10.1001/jama.294.11.1352. [DOI] [PubMed] [Google Scholar]
- 3.Attia J, Ioannidis JP, Thakkinstian A, McEvoy M, Scott RJ, Minelli C, et al. How to use an article about genetic association: A: Background concepts. Jama. 2009;301(1):74–81. doi: 10.1001/jama.2008.901. [DOI] [PubMed] [Google Scholar]
- 4.Cordell HJ, Clayton DG. Genetic association studies. Lancet. 2005;366(9491):1121–31. doi: 10.1016/S0140-6736(05)67424-7. [DOI] [PubMed] [Google Scholar]
- 5.Altshuler D, Daly M. Guilt beyond a reasonable doubt. Nat Genet. 2007;39(7):813–5. doi: 10.1038/ng0707-813. [DOI] [PubMed] [Google Scholar]
- 6.Jegga AG, Gowrisankar S, Chen J, Aronow BJ. PolyDoms: a whole genome database for the identification of non-synonymous coding SNPs with the potential to impact disease. Nucleic Acids Res. 2007;35(Database issue):D700–6. doi: 10.1093/nar/gkl826. [DOI] [PMC free article] [PubMed] [Google Scholar]
- 7.Dantzer J, Moad C, Heiland R, Mooney S. MutDB services: interactive structural analysis of mutation data. Nucleic Acids Res. 2005;33(Web Server issue):W311–4. doi: 10.1093/nar/gki404. [DOI] [PMC free article] [PubMed] [Google Scholar]
- 8.Shaker R, Mork P, Brockenbrough J, Donelson L, Tarczy-Hornoch P. The BioMediator System as a Tool for Integrating Databases on the Web. Proceedings of the Workshop on Information Integration on the Web; 2004; August, 2004; Toronto, ON. 2004. [Google Scholar]
- 9.Hirschhorn JN, Lohmueller K, Byrne E, Hirschhorn K. A comprehensive review of genetic association studies. Genet Med. 2002;4(2):45–61. doi: 10.1097/00125817-200203000-00002. [DOI] [PubMed] [Google Scholar]
- 10.Louie B, Detwiler T, Dalvi N, Shaker R, Tarczy-Hornoch P, Suciu D. Incorporating Uncertainty Metrics into a General-Purpose Data Integration System. presented at 19th International Conference on Scientific and Statistical Database Management (SSDBM); 2007; Banff, Canda. 2007. [Google Scholar]
- 11.Mork P, Halevy AY, Tarczy-Hornoch P. A Model for Data Integration Systems of BioMedical Data Applied to Online Genetic Databases. Proceedings of the American Medical Informatics Annual Fall Symposium; 2001 Nov. 3–7; Washington, D.C. 2001. pp. 473–77. [PMC free article] [PubMed] [Google Scholar]
- 12.Shen TH, Carlson CS, Tarczy-Hornoch P. SNPit: a federated data integration system for the purpose of functional SNP annotation. Comput Methods Programs Biomed. 2009;95(2):181–9. doi: 10.1016/j.cmpb.2009.02.010. [DOI] [PMC free article] [PubMed] [Google Scholar]
- 13.Gaasterland T, Sensen CW. MAGPIE: automated genome interpretation. Trends Genet. 1996;12(2):76–8. doi: 10.1016/0168-9525(96)81406-5. [DOI] [PubMed] [Google Scholar]
- 14.Gouret P, Vitiello V, Balandraud N, Gilles A, Pontarotti P, Danchin EGJ. Figenix: intelligent automation of genomic annotation: expertise integration in a new software platform. BMC Bioinformatics. 2005;6:198. doi: 10.1186/1471-2105-6-198. [DOI] [PMC free article] [PubMed] [Google Scholar]
- 15.Cadag E, Louie B, Myler PJ, Tarczy-Hornoch P. Biomediator data integration and inference for functional annotation of anonymous sequences. Pac Symp Biocomput. 2007:343–54. [PubMed] [Google Scholar]
- 16.Detwiler L, Gatterbauer W, Louie B, Suciu DPT-H. Integrating and Ranking Uncertain Scientific Data. Proceedings of 25th International Conference on Data Engineering (ICDE); 2009; 2009. pp. 1235–1238. IEEE. [Google Scholar]
- 17.Nakamura Y. DNA variations in human and medical genetics: 25 years of my experience. J Hum Genet. 2009;54(1):1–8. doi: 10.1038/jhg.2008.6. [DOI] [PubMed] [Google Scholar]
- 18.Ouzounis C, Karp P. The past, present and future of genome-wide re-annotation. Genome Biology. 2002;3(2):2001.1–2001.6. doi: 10.1186/gb-2002-3-2-comment2001. [DOI] [PMC free article] [PubMed] [Google Scholar]
- 19.Pearson TA, Manolio TA. How to interpret a genome-wide association study. Jama. 2008;299(11):1335–44. doi: 10.1001/jama.299.11.1335. [DOI] [PubMed] [Google Scholar]
- 20.Tabor HK, Risch NJ, Myers RM. Candidate-gene approaches for studying complex genetic traits: practical considerations. Nat Rev Genet. 2002;3(5):391–7. doi: 10.1038/nrg796. [DOI] [PubMed] [Google Scholar]
- 21.Friedman-Hill E. Jess In Action: Rule-Based Systems in Java. 1. CT: Manning Publications Co; 2003. [Google Scholar]
- 22.Friedman-Hill E. Jess (Java Expert Systems Shell) 2008. [cited; Available from: http://www.jessrules.com/jess/index.shtml.
- 23.Stenson PD, Ball EV, Mort M, Phillips AD, Shiel JA, Thomas NS, et al. Human Gene Mutation Database (HGMD): 2003 update. Hum Mutat. 2003;21(6):577–81. doi: 10.1002/humu.10212. [DOI] [PubMed] [Google Scholar]
- 24.Sherry ST, Ward MH, Kholodov M, Baker J, Phan L, Smigielski EM, et al. dbSNP: the NCBI database of genetic variation. Nucleic Acids Res. 2001;29(1):308–11. doi: 10.1093/nar/29.1.308. [DOI] [PMC free article] [PubMed] [Google Scholar]
- 25.NCBI. The NCBI Handbook. The Single Nucleotide Polymorphism Database (dbSNP) of Nucleotide Sequence Variation. 2009 [cited; Available from: http://www.ncbi.nlm.nih.gov/books/bv.fcgi?rid=handbook.section.ch5.ch5-s1.
- 26.Louie B. PhD Dissertation. University of Washington; 2008. Modeling Uncertainty in Data Integration for Improving Protein Function Assignment. [Google Scholar]
Associated Data
This section collects any data citations, data availability statements, or supplementary materials included in this article.


