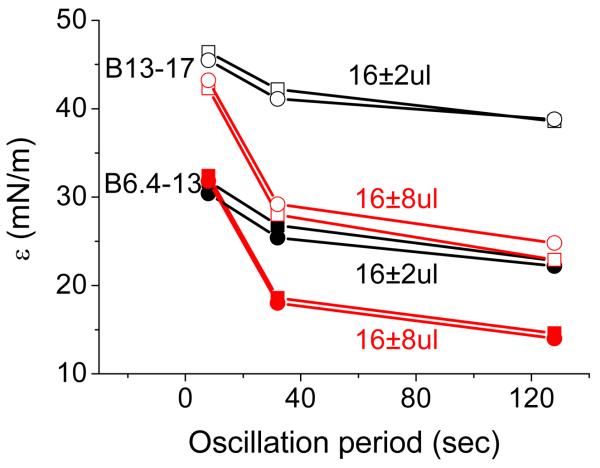
Fig. 6.
Comparison for the changes of the elasticity modulus (ε) as a function of the oscillation period of B6.4-13 and B13-17 at the TO/W interface derived from the oscillations before and after the buffer exchange procedure. The peptide concentration in the aqueous phase before buffer exchange was 2.0×10⁻⁷M for B6.4-13 or 2.1×10⁻⁷M for B13-17. After buffer exchange, both peptides were absent from the aqueous phase. Solid symbols are for B6.4-13; open symbols are for B13-17; squares are for pre-exchange; circles are for post-exchange; black symbols are for 16±2 μl oscillations; red symbols are for 16±8 μl oscillations.

