

Abstract
Purpose
To determine the genomic organization of the zebrafish crx gene and to evaluate if mutations in crx are responsible for the retinal degeneration phenotype in the zebrafish (Danio rerio) mutants niezerka (niem743) and mikre oko (mokm632).
Methods
Overlapping fragments were PCR amplified from genomic DNA isolated from homozygous mutant embryos and wild-type siblings (sibs). Amplicons were sequenced and sequence data assembled into contigs. Genomic organization was determined by alignment of contigs with published cDNA sequences and zebrafish genomic sequence from Sanger and Ensembl databases. Linkage analysis used DNA from mapping panels of single homozygous mutant animals with mixed genetic backgrounds.
Results
The analysis indicated that the zebrafish crx gene consisted of three exons and 2 introns, and spans 3.8 kb of genomic DNA. The splice junctions were all located within the coding region. Highly repetitive sequences present in non-coding regions of crx and extended tetra-nucleotide repeats in intronic regions were associated with sequence variation between different strains. Homozygous mokm632 or niem743 mutants and their respective wild-type sibs, showed identical patterns of heterozygosity and sequence variations within each line. No mutation in crx were identified in homozygous mokm632 or niem743. Consistent with the absence of identified mutations, linkage analysis excluded linkage of the mutant phenotypes to crx.
Conclusions
Despite the presence of sequence variations in their respective genetic backgrounds, within each line the sequence of crx was identical. Consistent with the absence of mutations, further analysis excluded linkage of the mutant phenotypes to crx. Analysis is in progress to map these loci and identify the genes responsible for the retinal degeneration phenotype in these mutant lines.
Crx (cone rod homeobox) is a divergent member of the Otx/orthodentical family of transcription factors and functions as a key transcriptional regulator of photoreceptor-specific gene expression [1,2]. It is expressed in rod and cone photoreceptors, horizontal cells and inner nuclear layer neurons in the retina and cells within the photosensitive pineal gland in mammals [1-3] and zebrafish [4]. Mutations in CRX have been identified in human patients with various degenerative retinal diseases including cone-rod dystrophy [5-8], Leber congenital amaurosis [7,8,9,10-12], and autosomal dominant retinitis pigmentosa [8]. Mice homozygous for a targeted disruption of Crx initially have a morphologically normal retina, but subsequently manifest changes in both the outer and inner nuclear layers [13,14]. In the outer nuclear layer, rod and cone photoreceptors fail to elaborate outer segments and degenerate; in the inner nuclear layer, bipolar and horizontal cells show increasingly abnormal arborization of their axonal and dendritic processes with age. To date, a crx null mutation in zebrafish has not been identified, although morpholino knockdown of crx expression during embryogenesis results in reduced retinal size, reduced proliferation and increased death of retinal progenitors, and a near total absence of rhodopsin and cone opsin immunoreactivity in the retina by three days post-fertilization (dpf) [15].
Zebrafish have become increasingly valuable as a model system for studying development in general, and the development of the visual system in particular, because of their extra-uterine development, transparency of their embryos, availability of methods to manipulate gene expression, and the rapid maturation of their visual system [16-19]. The optic primordium is visible by 12 h post-fertilization (hpf), the first differentiated ganglion cells are identifiable by 30 hpf [20,21], and visually evoked behaviors such as the startle reflex are detectable around 68 hpf [16,22]. In a large-scale zebrafish mutagenesis using N-ethyl-N-nitrosourea, 49 recessive mutations with morphological defects in the eye were identified and subsequently classified into seven phenotypic groups [23]. The mutant phenotypes include neuronal patterning defects, cyclopia, defects of the outer retina, and retinal degeneration. Among those with outer retinal defects or retinal degeneration, only niezerka (niem743), and mikre oko (mokm632) display a retina-specific phenotype without obvious morphological defects in other tissues.
Although non-allelic, both niem743 [24] and mokm632 [25] homozygotes show retinal degeneration as early as 3 dpf that is characterized primarily by a failure of the photoreceptors to develop proper morphology, increased cell death in the outer nuclear layer and degeneration of both rod and cone photoreceptors. In both mutant lines, the loss of photoreceptors is distinguished by the loss of immunoreactivity to opsin-specific antibodies that progresses from the peripheral to central retina. In addition to the loss of photoreceptors, homozygous niem743 and mokm632 larvae manifest defects in the inner retina that include an approximately 34% decrease in the total number of inner nuclear layer cells in niem743, a reduction in the number of Müller glia in mokm632, and an absence of morphologically identifiable horizontal cells in both.
The retinal defects observed in niem743 and mokm632 mutants are localized to crx expressing cells [4] and the failure of outer segment formation, early death of photoreceptors and changes in the inner retina are remarkably similar to the pattern of retinal defects observed in Crx null mice [13,14]. We undertook these studies to determine the genomic organization of the zebrafish crx gene and to evaluate whether mutations in crx are responsible for the retinal phenotype in niem743 and mokm632.
Methods
Zebrafish breeding, handling, and genotyping
Zebrafish (Danio rerio) mutants, niem743 and mokm632, were recovered in a large scale mutagenesis screen in zebrafish and were maintained in an AB, Tubingen, or WIK background [23]. Animals were kept on a 14 h light/10 h dark cycle according to standard procedures [26]. Embryos were collected from pairwise matings of heterozygous animals and raised at 28.5 °C. Homozygous mutant embryos were distinguished from their heterozygous and wild-type siblings (sibs) by morphology under a dissecting microscope at 5 dpf. The genetic crosses used to generate the mapping panels for linkage analysis are shown in Figure 1. Briefly, G0 (generation zero) heterozygous males [niem743 (AB background) or mokm632 (AB background)] were mated with wild-type females (WIK background). Heterozygous F1 progeny from individual clutches were mated to each other to generate homozygous F2 mutant embryos that were identified on the basis of their morphology as previously described [24,25]. All procedures using fish were performed in accord with the ARVO Statement for the Use of Animals in Ophthalmic and Vision Research.
Figure 1.
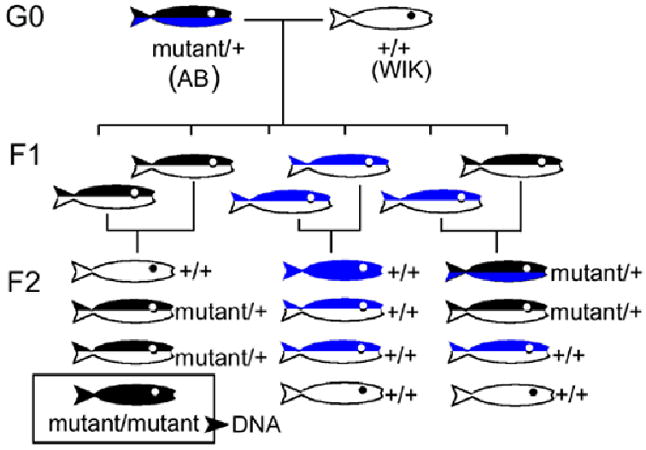
Genetic crosses used to generate homozygous mutant fish. Diagram showing genetic crosses used to generate homozygous mutant fish for linkage analysis. In the F1 and F2 generations, the relative Mendelian proportions of each class of progeny is shown. Homozygotes are solid color, heterozygotes are two colors. The mutant chromosome is shown in black. The wild type chromosomes (+) are shown in blue (AB background) or white (WIK background).
DNA purification
Genomic DNA was isolated from either homozygous mutant embryos or a combination of heterozygous and wild-type sibs by standard methods [27]. For linkage analysis, DNA was isolated from individual homozygous F2 mutant animals. Briefly, embryos were extensively digested in Proteinase K (0.05 mg/ml Proteinase K in 10 mM TrisHCl, pH 8.0, 5 mM EDTA, 0.1 M NaCl, 0.5% SDS) followed by phenol/chloroform extraction, ethanol precipitation and resuspension in TE.
PCR amplification and sequencing
Genomic DNA was PCR amplified using primers listed in Table 1. PCR was done in 100 μl reactions using Taq polymerase (Invitrogen, Carlsbad, CA) with 1.5 mM MgCl2 (2 min denaturation at 94 °C, 35 cycles of 94 °C, 30 s; anneal 30 s (Table 1); 72 °C, 2 min; and a final 10 min 72 °C extension). PCR amplification of introns 1 and 2 used the Advantage PCR system (Clontech, Palo Alto, CA) following manufacturer's recommendations. PCR products, purified using PCR purification columns (Qiagen, Inc., Va lencia, CA), were sequenced using CEQ Dye Terminator Cycle Sequencing kit (Beckman Coulter, Fullerton, CA) and analyzed using a Beckman CEQ2000 according to manufacturer's instructions. For each fragment both forward and reverse strands were sequenced with 2-4 fold coverage. Sequence assembly and alignment used Contig Express and AlignX software (Vector NTI version 8; Invitrogen, Carlsbad, CA). For microsatellite analysis, PCR was carried out in a 20 μl reaction mixture containing 50 ng of genomic DNA, 2 mM MgCl2 and 1.0 U of EX-Taq polymerase (Takara Mirus Bios Inc.; Madison, WI) for 32 cycles. PCR products were analyzed by electrophoresis on 6% denaturing polyacrylamide gels. Sequence data has been deposited in GenBank: genomic crx sequence for mokm632 (AY703034, AY703035) and for niem743 (AY703036, AY703037, AY703038).
Table 1. Primers for PCR amplification of zebrafish CRX from genomic DNA.
| Forward primer (5′-3′) | Reverse primer (5′-3′) | Target | Temp (anneal) (°C) | Size (bp) |
|---|---|---|---|---|
| CTCATAGTGTCCCGCTCCTGTCC | GCTCTCTCTCTCCCTCCCTCTCTCAC | exon 1 : 5′ | 60 | 364 |
| TTCTCGCATATAGACATTTATTTG | ATAAAACGTCTAACAGAAACACCATTA | exon 1 : 3′ | 55 | 471 |
| AACCTCCTGAATTGTTTTAAGCTG | TGTTGAGAAGGATGTGTGAGAGGC | exon 2 | 55 | 242 |
| ATCCATCCATTCATCCATCTAACAC | CTCTCTCACTTTCTTTTCTACAGCAC | exon 3 : 5′ | 55 | 990 |
| ACGGTCAGCCCTCTTCCTACAGCC | GGAAGGCTCAGATATAGGGGTGG | exon 3 : mid | 60 | 725 |
| GGAAGGAAAGATGCGTGAAGAAG | AACCTTCAGCTCCCCTCTGTACGTG | exon 3 : 3′ | 60 | 933 |
| TTCTCGCATATAGACATTTATTTG | TGTCTGGATAGCGTGTTTTGGTGA | intron 1 | 62 | 1243 |
| ACCACCTTCACTCGCACCCAG | TGTAGGAAGAGGGCTGACCGTAGC | intron 2 | 62 | 1026-1064 |
| AACCTGCCAGAGGGTTACT | TCAACAGATGGCTTCAGTGC | Z13833 | 50 | 177 [33] |
Oligonucleotide primers used for PCR amplification of zebrafish crx for sequence analysis were designed using Primer3 (Primer3) or Vector NTI (Invitrogen Corp.) software and the published zebrafish crx cDNA sequence (GenBank accession number AF503443) [4] and obtained from IDT as standard, desalted oligonucleotides (25 nmole synthesis). Annealing temperatures were optimized using a gradient program on a MJ Research DNA Engine thermocycler (BioRad).
Results & Discussion
To determine the sequence and genomic organization of the zebrafish crx gene, we used a PCR based strategy with oligonucleotide primers that were designed using the published zebrafish crx cDNA sequence (GenBank accession number AF503443; Table 1) [4]. Amplicons (Figure 2) were sequenced and the overlapping genomic fragments were assembled; exons were identified by alignment with zebrafish crx cDNAs. Zebrafish crx consisted of three exons: exon 1 (>507 bp), containing 410 bp of the 5′ UTR, the ATG initiation methionine, and 97 bp of coding sequence; exon 2 (152 bp), containing part of the homeodomain; and exon 3 (1726 bp), containing 594 bp of coding sequence including the remaining portion of the homeodomain, a TAG stop codon, and a 1129 bp 3′ UTR. (Figure 3). All identified introns were located within the coding region and examination of the intron/exon boundaries showed that all followed the AG/GT rule (Table 2). The splice junctions in zebrafish crx were located at the same position, relative to the translation initiation (ATG) site, as were the splice junctions within the coding regions of human and mouse Crx (Table 2).
Figure 2.
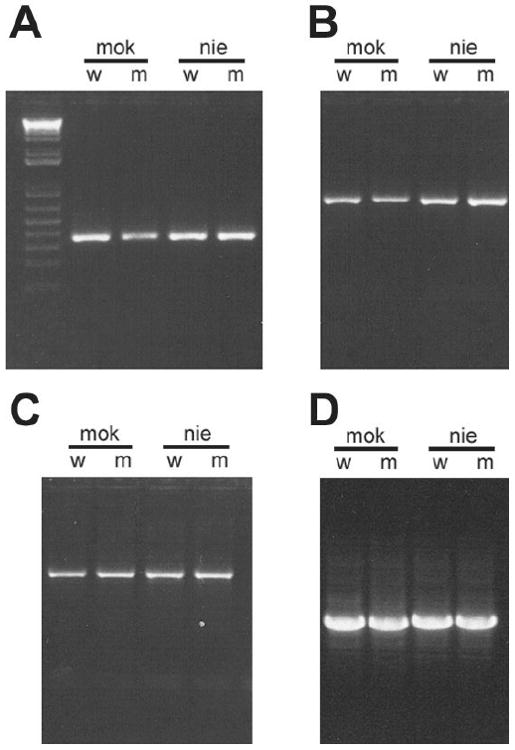
PCR amplification zebrafish crx fragments from genomic DNA used for sequence analysis. Photographs of ethidium bromide-stained agarose gels showing representative PCR amplifications of zebrafish crx from genomic DNA isolated from mok (mikre oko), nie (niezerka) homozygous mutants (m) and their phenotypically wild-type sibs (w) using primers listed in Table 1. A: 5′ end of Exon 1 including repetitive region within 5′ untranslated region (UTR). B: 5′ coding region of Exon 3 and flanking portion of Intron 2. C: 3′ end of coding region of exon 3 and repetitive sequences in 3′ UTR. D: Intron 2 shows a small, but detectable difference in the size between mok (1026 bp) and nie (1064 bp) although within each line, the amplicons from homozygous mutant and wild-type sibs co-migrate.
Figure 3.

Genomic organization and sequence of zebrafish crx. Consensus genomic sequence of zebrafish crx obtained from wild-type sibs in the mokm632 background. Exons are in capital letters with the coding sequence shown in  ; introns are in lower case. Bases in
  indicate intron 1 sequence from Sanger contig (zcl2909). Three regions of sequence variability located in exon 1 (
 ), intron 2 (
 ), and exon 3 (
 ) are shown in detail in Figure 4.
Table 2. Phylogenetic comparison of CRX exon-intron splice boundaries.
| Species | Exon | Acceptor splice site | Exon size (bp) | Donor splice site | Intron size (bp) |
|---|---|---|---|---|---|
| human* | 1 | >103 | TTCTGAAGgtgagcgtc | 12392 | |
| mouse** | 1 | >78 | TTCCAAAGgtgagtctt | 8540 | |
| zebrafish | 1 | >515 | ATG(n90)CTACCCAGgtcagttca | 731 | |
| human | 2 | tctcttgcagGCCCCCTG | 135 | ATG(n90)CTACCCAAgtgagtaca | 859 |
| mouse | 2 | tctcttgtagGTGCCCTC | 135 | ATG(n90)ATACTCAAgtaagtatg | 1633 |
| zebrafish | 2 | gtatgtatagCCACTCCG | 152 | GAGTTCAGgtgagtcct | 583 |
| human | 3 | cccaccccagGCGCCCCC | 152 | GGGTTCAGgtggggtgg | 1698 |
| mouse | 3 | ccccgcttagGTGCCCCT | 152 | GGGTCCAGgtaggatga | 953 |
| zebrafish | 3 | gtttcttcagGTGTGGTT(n586)TGA | 1725 | ||
| human | 4 | tatcccccagGTTTGGTT(n637)TGA | 1829 | ||
| mouse | 4 | ctctatctagGTCTGGTT(n637)TGA | 2478 |
Alignment of splice junctions of zebrafish crx with human and mouse CRX reveals conservation of splice acceptors and donor sites located within the coding regions. The identified 5′ UTR in zebrafish crx is contained entirely in exon 1, whereas the 5′ UTR in mouse and human crx is divided into two exons. Despite this difference, the positions of the splice junctions in coding regions are highly conserved. The splice junction between exons 1 and 2 in zebrafish crx is located at the same position, relative to the ATG initiation codon, as the splice junctions between exons 2 and 3 in human and mouse. Splice junctions were identified by aligning cDNA sequences with the corresponding genomes using the BLAT program at the UCSC genome database (UCSC). The human sequence (BC016664) marked with an asterisk (*) is aligned with the human genome May 2004 assembly; the mouse sequence (AK053533) marked with a double asterisk (**) is aligned with the mouse genome October 2003 assembly; zebrafish (AF503443) is aligned with the zebrafish genome June 2004 assembly. There are additional splice-variants unique to human crx [28].
The zebrafish crx introns were relatively small: 722 bp for intron 1 and 585 bp for intron 2. A tetra-nucleotide (ATCT) repetitive element was identified in both introns; it contained 34 and 21 repeats in introns 1 and 2, respectively. Intron 2 contained an additional ATCC element that was repeated ten times. We compared our genomic sequence data to the publicly available zebrafish genome sequences from the Ensembl and Sanger databases and the published zebrafish crx cDNA sequence (GenBank accession number AF503443). We found several areas of sequence variation: one in the 5′ untranslated region (UTR), a second in intron 2, and a third in the 3′ UTR (Figure 4). These regions showed variability in the number of repeat elements, along with minor single nucleotide substitutions or small deletions/insertions. However, none of these variants were located within the crx coding region, therefore, these changes would likely not affect the CRX protein.
Figure 4.

Alignment of DNA sequences of zebrafish crx showing regions of sequence variability. Alignment of crx sequence data from mok and nie wild-type sibs with published zebrafish genomic and cDNA sequences reveals areas of sequence variability associated with repetitive sequence elements in both non-coding and intronic regions. A: The GA repeat in the 5′ untranslated region of exon 1; B: the CATC tretranucleotide repeat region in intron 2; and C: the GA repetitive element and flanking G/A rich sequence in the 3′ untranslated region in exon 3. Asterisks (*) under sequence indicate variable bases; dashes indicate gaps introduced to optimize alignment. Sequence data from mok and nie were obtained from the present study; additional zebrafish sequences were obtained from the publicly available databases as follows: AF0503443 from crx cDNA sequence NCBI database [4]; zc12909 genomic sequence from Sanger database; and ctg13244 genomic sequence from Ensembl Database.
Overall, the zebrafish crx gene was relatively small, with the three exons spanning 3.8 kb of genomic DNA. This differs from mammalian crx genes that span considerably larger regions; mouse and human CRX genes encompass 15 kb and 25 kb, respectively [28]. The difference between the mammalian and non-mammalian crx genes appears to be attributable to the presence of an additional intron(s) in the mammalian genes that subdivides the 5′ UTR [28]. The 5′ UTR (410 bp) in the identified zebrafish crx cDNAs (Figure 5 and Liu et al. [4]) is considerably longer than the identified 5′ UTR in any of the mammalian crx genes (e.g., 207 bp in human (BG396702); 126 bp in mouse (AK053533) [28]; 102 bp in canine (AF454668) [29]). Although we cannot exclude the possibility of an additional 5′ exon in zebrafish, several observations would argue against it. First, there are currently eleven zebrafish crx cDNAs in the public databases that contain 5′ UTR sequence, none of which extend further 5′ than AF503443 or contain additional introns within the known exon 1 sequence. Second, there is sequence conservation between the zebrafish exon 1 and both exons 1 and 2 of the mammalian Crx orthologues (Figure 5; Table 3). Zebrafish crx exon 1 shares 47.6-49.3% sequence identity with mammalian Crx exon 1 and 55.6-57.1% identity with exon 2, compared to 33.6-42.5% between the 3′ UTR sequences of zebrafish and mammalian Crx (Table 3). Third, cross-species comparisons of the known mammalian Crx cDNAs to zebrafish and fugu genome databases failed to identify any regions of sequence homology with the genomic region 5′ to exon 1 of zebrafish crx. Likewise, there is no detectible sequence homology between the genomic regions 5′ of zebrafish crx and syntenic regions of mouse, human, or fugu genomes. Finally, the length of zebrafish crx cDNA (2.385 kb) corresponds closely to the transcript size as determined by Northern blot (approximately 2.4 kb) [4].
Figure 5.

Alignment of exon 1 from zebrafish crx with exons 1 and 2 from mammalian CRX identifies two regions of sequence similarity. Exon 1 of zebrafish crx contains regions of sequence similarity with both exons 1 and 2 of the mammalian CRX genes. The highest sequence identity is in the coding region and flanking 5′ untranslated regions of exon1 in zebrafish crx and exon 2 in mammalian crx. There is a second region of sequence similarity between the 5′ UTR of the zebrafish and exon 1 of the mammalian crx genes. The translation start site (ATG) is indicated by the three astericks (***) and identical bases are shown in blue. The following sequences were used in this alignment: Zebrafish (Danio rerio; AF503443) human (Homo sapiens; BC016664, BG396702); mouse (Mus musculus; AK053533); and dog (Canis familiaris; AF454668).
Table 3. Comparisons of CRX sequences by exon across species (percent identity).
| A. 5′ UTR (non-coding) | ||||
| Z EXON 1 | H EXON 1 | M EXON 1 | D EXON 1 | |
| Z EXON 1 | 100 | 55.5 | 47.6 | 49.3 |
| H EXON 1 | 100.0 | 69.2 | 66.2 | |
| M EXON 1 | 100.0 | 60.0 | ||
| B. 5′ UTR + Coding | ||||
| Z EXON 1 | H EXON 2 | M EXON 2 | D EXON 2 | |
| Z EXON 1 | 100.0 | 56.0 | 57.1 | 55.6 |
| H EXON 2 | 100.0 | 84.4 | 87.6 | |
| M EXON 2 | 100.0 | 75.5 | ||
| C. Coding | ||||
| Z EXON 2 | H EXON 3 | M EXON 3 | D EXON 3 | |
| Z EXON 2 | 100.0 | 74.3 | 69.7 | 73.0 |
| H EXON 3 | 100.0 | 90.8 | 88.2 | |
| M EXON 3 | 100.0 | 88.9 | ||
| Z EXON 3 | H EXON 4 | M EXON 4 | D EXON 4 | |
| Z EXON 3 | 100.0 | 56.4 | 53.0 | 57.2 |
| H EXON 4 | 100.0 | 87.0 | 88.8 | |
| M EXON 4 | 100.0 | 84.7 | ||
| D. 3′ UTR (non-coding) | ||||
| Z EXON 3 | H EXON 4 | M EXON 4 | D EXON 4 | |
| Z EXON 3 | 100.0 | 41.6 | 33.6 | 42.5 |
| H EXON 4 | 100.0 | 44.9 | 48.1 | |
| M EXON 4 | 100.0 | 45.6 | ||
Cross-species sequence comparisons of Crx. The three identified exons in zebrafish Crx share sequence identity with all the four identified exons in the mammalian CRX genes. A: Zebrafish Crx Exon 1 shares a region of moderate sequence identity with human, mouse and dog Crx Exon 1 in the non-coding, 5′ untranslated region. B: A second region of zebrafish Crx Exon 1 shares slightly higher sequence identity with human, mouse and dog Crx Exon 2. This slight increase in sequence identity is attributable to the high sequence identity within the coding regions. C: The coding regions in Zebrafish Crx Exon 2 and the mammalian Exon 3 and zebrafish Exon 3 and the mammalian Exon 4 share the highest sequence identity. D: The lowest level of identity is in the non-coding, 3′ untranslated regions of zebrafish Crx exon 3 and the mammalian CRX exon 4. These comparisons used sequences from zebrafish (“Z”; Danio rerio; AF0503443); human (“H”; Homo sapiens; BC016664, BG396702); mouse (“M”; Mus musculus; AK053533); dog (“D”; Canis familiaris; AF454668).
To look for crx mutations in nie743 and mokm632, we sequenced all exons, splice junctions, and flanking intronic regions of the crx locus in homozygous mutant animals and their phenotypically wild-type sibs. Based on Mendelian segregation of gametes and the recessive inheritance of these two mutations [24,25], the population of phenotypically wild-type animals from each clutch should consist of a combination of heterozygous mutants and wild-type sibs with a predicted ratio of one mutant to two wild-type chromosomes. Sequence heterozygosity observed in the control group that was not present in the homozygous mutant animals would be considered a potential mutation. We found no evidence for crx mutations in either mokm632 or niem743 homozygous mutant lines. There were bases that were heterozygous in the control group and in each case, the same pattern of heterozygosity was also present in DNA from homozygous mutants. Ambiguous bases can be the result of sequencing artifacts, however these are typically specific to one direction of sequencing and are not detected when sequencing in the opposite direction. Although this was the case for a fraction of the ambiguous bases detected, there were multiple instances where the same pattern of heterozygosity was present in the sequence of both the forward and reverse strands. The absence of identifiable mutations in crx in the two mutant lines and the presence of sequence heterozygosity in homozygous niem743 and mokm632 mutants support the conclusion that retinal degeneration in these animals is not attributable to mutations in crx.
At least 14 neurological diseases are associated with dynamic instability of tandem arrayed repetitive elements located in both coding and non-coding regions of genes [30]. Expansion of tetra- or penta-nucleotide repeats within intronic regions have been shown to contribute to splicing anomalies in myotonic dystrophy [31] and spinocerebellar ataxia type 10 [32]. To look for possible expansion of the tetranucleotide repetitive elements, introns 1 and 2 were PCR amplified using primers located in the flanking exons (Table 1). In all cases, the size of the amplicons from homozygous mutant animals was indistinguishable from those amplified from their wild-type sibs (e.g., Figure 2D) and we concluded that variations in repeat length within introns 1 or 2 are not responsible for the mutant phenotype.
Our analysis of crx in mokm632 and niem743 mutants focused on the coding region, flanking untranslated regions, and splice junctions. Mutations located in regulatory regions of crx would not have been detected. In order to definitively exclude crx, we used linkage analysis. For these analyses, we generated mapping panels for each mutant line by out-crossing heterozygous mutants to wild-type fish of a different genetic background (Figure 1). By mating the resulting F1 progeny to each other, we generated homozygous mutant embryos that each carried two identical alleles of the mutated chromosome originating from a single G0 (generation zero) parent. If the mutant phenotype and crx are linked, we expect little or no heterozygosity or sequence variation within crx in homozygous mutants. Although sequence heterozygosity or variations can result from recombination between the mutant and wild-type chromosomes in the F1 animals, the frequency of recombination within tightly linked loci is, by definition, extremely low. For niem743, five of seven homozygotes had at least one base that showed heterozygosity or a substitution compared to the consensus (Figure 6). This result is consistent with independent segregation of crx and the mutant phenotype and we conclude that niem743 and crx are not linked.
Figure 6.
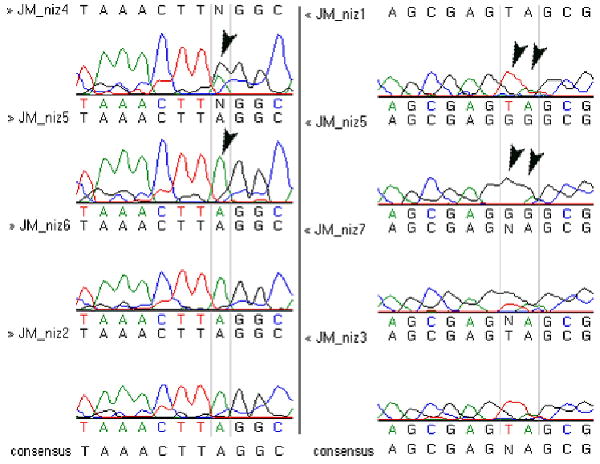
Chromatographs showing representative results of linkage analysis of the crx gene in homozygous niem743 mutants from mapping panel. Variable regions of crx exon 1 were PCR amplified from a mapping panel generated from individual homozygous niem743 mutants (JM_niz1 thru JM_niz7) and sequenced. Alignment of the sequence data using VectorNTI/Contig Express software (Invitrogen) identified regions of sequence variability, indicated on the chromatographs by vertical gray lines and arrowheads. In the left panel, JM_niz4 has a double peak (heterozygous for A and G) compared to JM_niz5 has a single peak (homozygous for A). In the right panel, arrowheads indicate a variable di-nucleotide sequence: TA in JM_niz1 and GG in JM_niz 5.
Similar analysis of mokm632 did not identify any sequence variations in a mapping panel of 8 homozygotes, therefore a second panel was used for mapping analysis using microsatellite markers [33]. The CA repeat marker Z13833 maps to a location 50.3 cM from the top of Linkage Group 5, close to the known map location of crx (49.6-54.5 cM from the top of Linkage Group 5) [4]. Given an estimated distance of 4.2 cM between Z13833 and crx, the recombination frequency between these markers should be less than 5% and no more than one in 20 homozygous mutant animals would be expected to have a recombinant genotype for Z13833 and crx. We observed that all allele combinations (AA, AB, and BB) were present in both the wild-type and the mokm632 mapping panels (Table 4). A maximum of four of eight mutant animals (50 percent) displayed a single allele combination. Therefore, we conclude that segregation of Z13833 is independent of the mutant phenotype and that mokm632 is not linked to either Z13833 or crx. Studies are currently underway to complete the mapping and characterization of the genes responsible for the mutant phenotypes.
Table 4. Linkage of microsatellite repeat Z13833 in MOKM632 mapping panel.
| Allele | |||
|---|---|---|---|
| AA | AB | BB | |
| mutant (n=8) | 4 | 3 | 1 |
| wild-type (n=10) | 2 | 3 | 5 |
Linkage analysis of the CA microsatellite repeat Z13833, located about 4.2 cM from crx on chromosome 5, identified two alleles (designated A and B) in the mokm632 mapping panel. All allele combinations (AA, AB and BB) are present in both homozygous mutant mokm632 and their wild-type sibs. A maximum of 4 out of 8 homozygous mokm632 mutants showed a single allele combination, corresponding to a 50% recombination rate. In contast, the predicted recombination rate between Z13833 and the closely linked crx gene is 4.2%. These results indicate that Z13833 and crx segregate independently from the mokm632 mutant phenotype.
Linkage analysis in human patients and murine models has made major contributions to the identification of genes and mutations that cause inherited retinal degenerative disease. However, the potential of zebrafish models for studying the visual system has just begun to be realized. Progress in completion of the genome projects of zebrafish and other vertebrate species will continue to facilitate the identification of both developmentally important and disease-associated genes. The identification of genes and mutations that underlie the phenotypes of zebrafish mutants isolated from large scale mutagenesis screens through the analysis of candidate genes and linkage analysis has the potential to identify novel genes and pathways involved in both normal development and to provide new models for the understanding of degenerative retinal disease.
Acknowledgments
The authors would like to thank Ms. Kelly Donovan for technical assistance. This research was supported in part by grants from the National Eye Institute (F32EY13499 to DCO, EY09769 to DJZ, and EY11882 to JM), Foundation Fighting Blindness, and by generous gifts from Marshall and Stevie Wishnack and from Robert and Clarice Smith. DJZ is the Guerrieri Professor of Genetic Engineering and Molecular Ophthalmology and is recipient of a Senior Investigator Award from Research to Prevent Blindness, Inc.
References
- 1.Chen S, Wang QL, Nie Z, Sun H, Lennon G, Copeland NG, Gilbert DJ, Jenkins NA, Zack DJ. Crx, a novel Otx-like paired-homeodomain protein, binds to and transactivates photoreceptor cell-specific genes. Neuron. 1997;19:1017–30. doi: 10.1016/s0896-6273(00)80394-3. [DOI] [PubMed] [Google Scholar]
- 2.Furukawa T, Morrow EM, Cepko CL. Crx, a novel otx-like homeobox gene, shows photoreceptor-specific expression and regulates photoreceptor differentiation. Cell. 1997;91:531–41. doi: 10.1016/s0092-8674(00)80439-0. [DOI] [PubMed] [Google Scholar]
- 3.Bibb LC, Holt JK, Tarttelin EE, Hodges MD, Gregory-Evans K, Rutherford A, Lucas RJ, Sowden JC, Gregory-Evans CY. Temporal and spatial expression patterns of the CRX transcription factor and its downstream targets. Critical differences during human and mouse eye development. Hum Mol Genet. 2001;10:1571–9. doi: 10.1093/hmg/10.15.1571. [DOI] [PubMed] [Google Scholar]
- 4.Liu Y, Shen Y, Rest JS, Raymond PA, Zack DJ. Isolation and characterization of a zebrafish homologue of the cone rod homeobox gene. Invest Ophthalmol Vis Sci. 2001;42:481–7. [PubMed] [Google Scholar]
- 5.Swain PK, Chen S, Wang QL, Affatigato LM, Coats CL, Brady KD, Fishman GA, Jacobson SG, Swaroop A, Stone E, Sieving PA, Zack DJ. Mutations in the cone-rod homeobox gene are associated with the cone-rod dystrophy photoreceptor degeneration. Neuron. 1997;19:1329–36. doi: 10.1016/s0896-6273(00)80423-7. [DOI] [PubMed] [Google Scholar]
- 6.Freund CL, Gregory-Evans CY, Furukawa T, Papaioannou M, Looser J, Ploder L, Bellingham J, Ng D, Herbrick JA, Duncan A, Scherer SW, Tsui LC, Loutradis-Anagnostou A, Jacobson SG, Cepko CL, Bhattacharya SS, McInnes RR. Cone-rod dystrophy due to mutations in a novel photoreceptor-specific homeobox gene (CRX) essential for maintenance of the photo-receptor. Cell. 1997;91:543–53. doi: 10.1016/s0092-8674(00)80440-7. [DOI] [PubMed] [Google Scholar]
- 7.Jacobson SG, Cideciyan AV, Huang Y, Hanna DB, Freund CL, Affatigato LM, Carr RE, Zack DJ, Stone EM, McInnes RR. Retinal degenerations with truncation mutations in the cone-rod homeobox (CRX) gene. Invest Ophthalmol Vis Sci. 1998;39:2417–26. [PubMed] [Google Scholar]
- 8.Sohocki MM, Sullivan LS, Mintz-Hittner HA, Birch D, Heckenlively JR, Freund CL, McInnes RR, Daiger SP. A range of clinical phenotypes associated with mutations in CRX, a photoreceptor transcription-factor gene. Am J Hum Genet. 1998;63:1307–15. doi: 10.1086/302101. [DOI] [PMC free article] [PubMed] [Google Scholar]
- 9.Cremers FP, van den Hurk JA, den Hollander AI. Molecular genetics of Leber congenital amaurosis. Hum Mol Genet. 2002;11:1169–76. doi: 10.1093/hmg/11.10.1169. [DOI] [PubMed] [Google Scholar]
- 10.Freund CL, Wang QL, Chen S, Muskat BL, Wiles CD, Sheffield VC, Jacobson SG, McInnes RR, Zack DJ, Stone EM. De novo mutations in the CRX homeobox gene associated with Leber congenital amaurosis. Nat Genet. 1998;18:311–2. doi: 10.1038/ng0498-311. [DOI] [PubMed] [Google Scholar]
- 11.Swaroop A, Wang QL, Wu W, Cook J, Coats C, Xu S, Chen S, Zack DJ, Sieving PA. Leber congenital amaurosis caused by a homozygous mutation (R90W) in the homeodomain of the retinal transcription factor CRX: direct evidence for the involvement of CRX in the development of photoreceptor function. Hum Mol Genet. 1999;8:299–305. doi: 10.1093/hmg/8.2.299. [DOI] [PubMed] [Google Scholar]
- 12.Tzekov RT, Liu Y, Sohocki MM, Zack DJ, Daiger SP, Heckenlively JR, Birch DG. Autosomal dominant retinal degeneration and bone loss in patients with a 12-bp deletion in the CRX gene. Invest Ophthalmol Vis Sci. 2001;42:1319–27. [PMC free article] [PubMed] [Google Scholar]
- 13.Furukawa T, Morrow EM, Li T, Davis FC, Cepko CL. Retinopathy and attenuated circadian entrainment in Crx-deficient mice. Nat Genet. 1999;23:466–70. doi: 10.1038/70591. [DOI] [PubMed] [Google Scholar]
- 14.Pignatelli V, Cepko CL, Strettoi E. Inner retinal abnormalities in a mouse model of Leber's congenital amaurosis. J Comp Neurol. 2004;469:351–9. doi: 10.1002/cne.11019. [DOI] [PubMed] [Google Scholar]
- 15.Shen YC, Raymond PA. Zebrafish cone-rod (crx) homeobox gene promotes retinogenesis. Dev Biol. 2004;269:237–51. doi: 10.1016/j.ydbio.2004.01.037. [DOI] [PubMed] [Google Scholar]
- 16.Easter SS, Jr, Malicki JJ. The zebrafish eye: developmental and genetic analysis. Results Probl Cell Differ. 2002;40:346–70. doi: 10.1007/978-3-540-46041-1_17. [DOI] [PubMed] [Google Scholar]
- 17.Malicki JJ, Pujic Z, Thisse C, Thisse B, Wei X. Forward and reverse genetic approaches to the analysis of eye development in zebrafish. Vision Res. 2002;42:527–33. doi: 10.1016/s0042-6989(01)00262-0. [DOI] [PubMed] [Google Scholar]
- 18.Malicki J, Jo H, Wei X, Hsiung M, Pujic Z. Analysis of gene function in the zebrafish retina. Methods. 2002;28:427–38. doi: 10.1016/s1046-2023(02)00262-1. [DOI] [PubMed] [Google Scholar]
- 19.Goldsmith P, Harris WA. The zebrafish as a tool for understanding the biology of visual disorders. Semin Cell Dev Biol. 2003;14:11–8. doi: 10.1016/s1084-9521(02)00167-2. [DOI] [PubMed] [Google Scholar]
- 20.Schmitt EA, Dowling JE. Early eye morphogenesis in the zebrafish, Brachydanio rerio. J Comp Neurol. 1994;344:532–42. doi: 10.1002/cne.903440404. [DOI] [PubMed] [Google Scholar]
- 21.Hu M, Easter SS. Retinal neurogenesis: the formation of the initial central patch of postmitotic cells. Dev Biol. 1999;207:309–21. doi: 10.1006/dbio.1998.9031. [DOI] [PubMed] [Google Scholar]
- 22.Easter SS, Jr, Nicola GN. The development of eye movements in the zebrafish (Danio rerio) Dev Psychobiol. 1997;31:267–76. doi: 10.1002/(sici)1098-2302(199712)31:4<267::aid-dev4>3.0.co;2-p. [DOI] [PubMed] [Google Scholar]
- 23.Malicki J, Neuhauss SC, Schier AF, Solnica-Krezel L, Stemple DL, Stainier DY, Abdelilah S, Zwartkruis F, Rangini Z, Driever W. Mutations affecting development of the zebrafish retina. Development. 1996;123:263–73. doi: 10.1242/dev.123.1.263. [DOI] [PubMed] [Google Scholar]
- 24.Doerre G, Malicki J. Genetic analysis of photoreceptor cell development in the zebrafish retina. Mech Dev. 2002;110:125–38. doi: 10.1016/s0925-4773(01)00571-8. [DOI] [PubMed] [Google Scholar]
- 25.Doerre G, Malicki J. A mutation of early photoreceptor development, mikre oko, reveals cell-cell interactions involved in the survival and differentiation of zebrafish photoreceptors. J Neurosci. 2001;21:6745–57. doi: 10.1523/JNEUROSCI.21-17-06745.2001. [DOI] [PMC free article] [PubMed] [Google Scholar]
- 26.Westerfield M. The zebrafish book: a guide for the laboratory use of zebrafish Danio (Brachydanio) rerio. 4th. Eugene (OR): University of Oregon Press; 2000. [Google Scholar]
- 27.Sambrook J, Russell DW. Molecular cloning: a laboratory manual. 3rd. Cold Spring Harbor (NY): Cold Spring Harbor Laboratory; 2001. [Google Scholar]
- 28.Hodges MD, Vieira H, Gregory-Evans K, Gregory-Evans CY. Characterization of the genomic and transcriptional structure of the CRX gene: substantial differences between human and mouse. Genomics. 2002;80:531–42. doi: 10.1006/geno.2002.6854. [DOI] [PubMed] [Google Scholar]
- 29.Akhmedov NB, Baldwin VJ, Zangerl B, Kijas JW, Hunter L, Minoofar KD, Mellersh C, Ostrander EA, Acland GM, Farber DB, Aguirre GD. Cloning and characterization of the canine photoreceptor specific cone-rod homeobox (CRX) gene and evaluation as a candidate for early onset photoreceptor diseases in the dog. Mol Vis. 2002;8:79–84. [PubMed] [Google Scholar]
- 30.Costa Lima MA, Pimentel MM. Dynamic mutation and human disorders: the spinocerebellar ataxias (review) Int J Mol Med. 2004;13:299–302. [PubMed] [Google Scholar]
- 31.Liquori CL, Ricker K, Moseley ML, Jacobsen JF, Kress W, Naylor SL, Day JW, Ranum LP. Myotonic dystrophy type 2 caused by a CCTG expansion in intron 1 of ZNF9. Science. 2001;293:864–7. doi: 10.1126/science.1062125. [DOI] [PubMed] [Google Scholar]
- 32.Matsuura T, Fang P, Lin X, Khajavi M, Tsuji K, Rasmussen A, Grewal RP, Achari M, Alonso ME, Pulst SM, Zoghbi HY, Nelson DL, Roa BB, Ashizawa T. Somatic and germline instability of the ATTCT repeat in spinocerebellar ataxia type 10. Am J Hum Genet. 2004;74:1216–24. doi: 10.1086/421526. [DOI] [PMC free article] [PubMed] [Google Scholar]
- 33.Shimoda N, Knapik EW, Ziniti J, Sim C, Yamada E, Kaplan S, Jackson D, de Sauvage F, Jacob H, Fishman MC. Zebrafish genetic map with 2000 microsatellite markers. Genomics. 1999;58:219–32. doi: 10.1006/geno.1999.5824. [DOI] [PubMed] [Google Scholar]