Abstract
Successful therapeutic angiogenesis requires an understanding of how the milieu of growth factors available combine to form a mature vascular bed. This requires a model in which multiple physiological and cell biological parameters can be identified. The adenoviral-mediated mesenteric angiogenesis assay as described here is ideal for that purpose. Adenoviruses expressing growth factors (vascular endothelial growth factor [VEGF] and angiopoietin 1 [Ang-1]) were injected into the mesenteric fat pad of adult male Wistar rats. The clear, thin, and relatively avascular mesenteric panel was used to measure increased vessel perfusion by intravital microscopy. In addition, high-powered microvessel analysis was carried out by immunostaining of features essential for the study of angiogenesis (endothelium, pericyte, smooth muscle cell area, and proliferation), allowing functional data to be obtained in conjunction with high-power microvessel ultrastructural analysis. A combination of individual growth factors resulted in a distinct vascular phenotype from either factor alone, with all treatments increasing the functional vessel area. VEGF produced shorter, narrow, highly branched, and sprouting vessels with normal pericyte coverage. Ang-1 induced broader, longer neovessels with no apparent increase in branching or sprouting. However, Ang-1-induced blood vessels displayed a significantly higher pericyte ensheathment. Combined treatment resulted in higher perfusion, larger and less-branched vessels, with normal pericyte coverage, suggesting them to be more mature. This model can be used to show that Ang-1 and VEGF use different physiological mechanisms to enhance vascularisation of relatively avascular tissue.
Keywords: Angiogenesis, angiopoietin 1, pericyte, VEGF
1. Introduction
The proangiogenic effects of endothelial growth factor overexpression have been characterised in a wide range of models. For instance, for vascular endothelial growth factor (VEGF), the rat mesentery (1, 2), skeletal muscle (3, 4), cardiac muscle (5), trachea (6), skin (7-9), and corneal eye pocket (10, 11) have all been used. With the exception of the trachea and mesenteric models, a reductionist approach has relied on quantifying the increase in vessel density as the angiogenic response. Although the primary end point of angiogenesis should be increased vessel density, this does not reveal any details regarding the manner in which angiogenesis proceeds, such as whether growth is by a sprouting or nonsprouting mechanism. Moreover, in many of these systems, it has proven difficult, if not impossible, to quantify the increase in parameters such as vessel branch point density, proliferating endothelial cells (PECs), and so on. Furthermore, the physiological characterisation of vessels undergoing angiogenesis within the microvessel network is normally not possible. The mesentery is currently used for physiological recordings of microvessel permeability (12), compliance (13), vasoreactivity (14), and conducted vasodilation (15), so an angiogenesis assay in the same tissue allows the determination of functionality of the neovessels formed, measuring parameters such as vascular reactivity, hydraulic conductivity, vessel compliance, and more.
To illustrate this, we describe an angiogenesis assay that compares two different growth factors: angiopoietin 1 (Ang-1) and VEGF. Details of the work here have been published (16), but the methodology is described here in detail (17). For a full description of the angiogenic phenotype to be considered (e.g., type of vessel growth, time course, mechanisms), the use of a two-dimensional microvascular network such as the mesentery offers significant advantages. Although models using the tracheal microvessel network are able to rely on a well-studied system, the method of perfusion fixation and the three-dimensional networks mean that (1) only perfused vessels are analysed, (2) measurements of perfusion are indirect, and (3) the tracheal vasculature cannot be visualised in vivo.
For therapeutic purposes, the most successful end result of angiogenesis would be a direct increase in tissue perfusion. The rat mesentery surpasses the limitations of the tracheal system and offers the ability to quantify the vessel phenotype and how this might be manifested anatomically. We can image the perfused mesenteric microvasculature on d 1 and d 7 in vivo and if required perform physiological measurements such as those for permeability (12), perfusion (17), and vessel reactivity (14, 18), then stain and image the mesentery by confocal fluorescence or electron microscopy. This enables quantitative assessments of vessel density, branching, sprouting, length and diameter, and the degree and constituents of mural support, and this can be linked to the degree of tissue perfusion.
2. Methods
2.1. Angiogenesis and Arteriogenesis Preparation
All surgical procedures need to be performed using sterile equipment. Male Wistar rats (300–350 g) are anaesthetised by 5% halothane inhalation, and anaesthesia is maintained with 3% halothane. A rectal temperature probe is inserted and attached to a thermostatically controlled heated blanket (Harvard CCM79 animal blanket control unit, Kent, UK) to maintain core body temperature at 37°C. A small portion of the ventral surface is shaved and sterilised with Betadine (7.5% povidine-iodine, Napp, Lodi, NJ, USA) and 70% ethanol. A laparotomy is performed, creating an incision approximately 1.5–2 cm long.
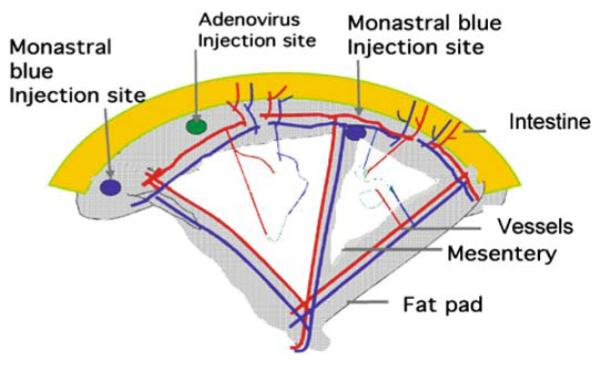
A small region of the small intestine is gently teased out and draped over a quartz pillar (see Fig. 15.1). A mesenteric panel with a flowing microvessel bed is visualised using a Leica DC350F (Leica, Bucks, UK) connected to an intravital microscope (Leica DMIL) and a personal computer. Then, 25 μL of adenovirus are injected into the surrounding fat pad using a 30-gauge needle and Hamilton syringe (VWR, Leicester, UK). Surrounding panels are tattooed with 0.6% w/v Monastral blue in mammalian Ringer (millimolar concentrations: 132.0 NaCl, 4.6 KCl, 1.27 MgSO4, 2.0 CaCl2, 25.0 NaHCO3, 5.5 D-glucose, 3.07 HEPES acid, and 2.37 HEPES sodium salt, pH corrected to 7.45 ± 0.02 with 0.115M NaOH). This enables the same panel to be located on d 7 or 14. The following viruses have been used for the angiogenesis assay adenovirus-cytomegalovirus (Ad-CMV)–VEGF165, titre 8*108 plaque-forming units (PFU)/mL; Ad-CMV-Ang-1, titre 8*108 PFU/mL; Ad-CMV-eGFP (enhanced green fluorescent protein), titre 5*108 PFU/mL; and Ad-CMV-eNOS, titre 6*108. In experiments requiring multiple viruses to be used, 25 μL of each virus are used but injected as a mixture.
Fig. 15.1.
A schematic representation of rat mesenteric angiogenesis assay demonstrating the intestine (grey), the fat pad (shingle), the transparent mesentery (white). Within the mesenteric panel are the microvessels, showing approximately equal distributions of pre-, post-, and true capillary order vessels. The adenovirus is injected into the fat pad (marked checked circle), and the panel is located by placing a tattoo on either side of the injected panel.
Throughout the procedure (which should last approximately 2–5 min), the mesentery and surrounding intestine are superfused with mammalian Ringer, kept at a constant 37°C ± 1°C. Temperature is maintained by connecting the superfusate to a heat exchange coil fed by a thermostatically controlled water bath. The abdominal cavity and skin are sutured and the animal allowed to recover on 100% O2 before being transferred to a warmed, clean animal cage. Analgesia is provided by a single intramuscular injection of buprenorphine (Temgesic®, Schering-Plough, Hare-field, UK). All postoperative animals are caged individually and checked hourly and, after 24 h postprocedure, daily.
2.2. Immunofluorescence on Whole-Mount Mesentery
For angiogenesis assays, 6/13 d later (d 7/14) the same animal is anaesthetised, a laparotomy is performed, and the same mesenteric panel is located (by the Monastral blue tattoo). The panel is imaged as before and fixed in vivo with 4% paraformaldehyde (in 1*phosphate-buffered saline [PBS], pH 7.40) for 5 min. The animal is then killed by cervical dislocation, and the mesenteric panel is excised. The fat pads are removed and snap frozen in liquid nitrogen for later examination of protein expression and stored at −20°C. The panel is washed in mammalian Ringer and refixed for a maximum of 1 h at room temperature in the same fixative.
The panels are washed with 0.5% Triton X-100 in PBS (0.5% PBX), for 1 h, changing solutions every 10 min at room temperature. The panels are blocked in 1% bovine serum albumen (BSA)-0.5% PBX, or 1.5% normal goat serum for 1 h. The mesentery is incubated overnight at 4°C with 10 μg/mL biotinylated Griffonia simplicifolia isolectin IB4 (GSI-IB4, Molecular Probes, Cambridge, UK) and mouse monoclonal antibodies to either Ki-67 (Novocastra Lab, Newcastle upon Tyne, UK, NCL-L-Ki67-MM1) for dividing cells, NG2 (Chemicon, Temecula, CA, USA, MAB5384, 5 μg/mL) for pericytes, or α-smooth muscle actin (DAKO, Glostrup, Denmark, M 0851, 1.4 μg/mL) for smooth muscle.
Panels are washed as before and TRITC-labelled streptavidin (1 μg/mL, S-870, Molecular Probes) and Alexa Fluor 488, 350 goat antimouse immunoglobulin G (IgG; 2 μg/mL, Molecular Probes) are used as secondary detection antibodies to lectin, Ki67, and VEGF and smooth muscle actin, respectively. Primary antibodies and lectin are incubated overnight on a rocker at 4°C. The panels are washed for 1 h, changing the PBX solution six times and incubating with secondary antibodies for 2 h at room temperature on a rocker. The panels are washed a further six times, and if appropriate Hoechst 33324 (1 μM, Molecular Probes) is added to stain mesenteric nuclei.
The panels are carefully manipulated using fine forceps and flattened on a glass slide before being mounted in Vectashield (Vector Lab, Peterborough, UK), and a coverslip is carefully placed on the tissue. The tissue is imaged using a Leica confocal microscope (Leica confocal TCS-NT DMIRBE). Five random sections of each panel are imaged and analysed offline at ×40 magnification with oil immersion.
2.3. Microvessel Analysis
Data obtained from intravital microscopy are analysed to provide information regarding the maturity of the neovessels formed. The red blood cells flowing through the microvessel bed contrast with the clear mesothelial layer surrounding the vessels. Consequently, fractional vessel area (FVA) is measured as the area of flowing blood vessels per area of mesenteric tissue. All microvessel analysis is carried out using Openlab 3.1 (Improvison, Coventry, UK). The vessel area is selected using the Wand tool, with a pixel threshold of 32. The FVA is a measure of the percentage of vessel area per mesenteric panel. The angiogenesis index (AI) is expressed as the following equation:
2.4. Microvessel Measurement
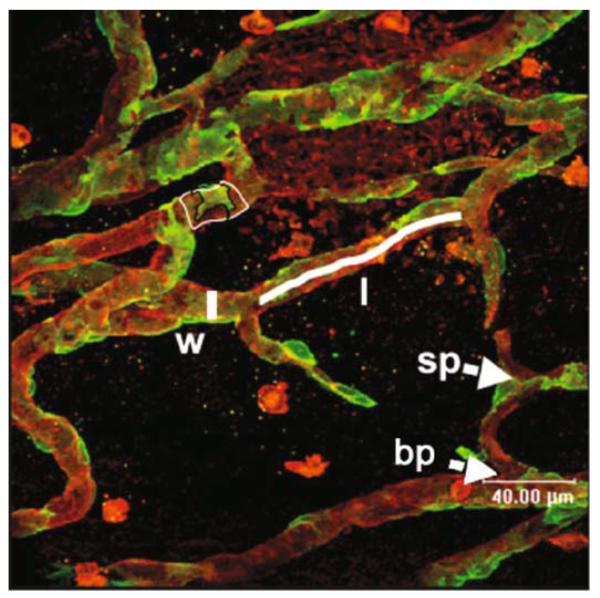
The images obtained from the confocal imaging are also analysed using Openlab software. The scale is calibrated using the scale obtained from the confocal microscope. Measurements are made for vessel diameter, vessel length (distance of vessel not broken by a branch or sprout point), vessel number, sprout point number, branch point number, and PEC number (see Fig. 15.2). The mean value from four or five panels is taken, and the density (mm−2) can then be calculated. The fractional pericyte area (FPA) is calculated as the percentage of the vessel covered by pericyte (NG2 positive). Staining for α-smooth muscle actin is used to confirm the presence of vascular smooth muscle cells (vSMCs); therefore, the density of vSMC-positive vessels can also calculated as well as the fractional smooth muscle area (FSMA). See Fig. 15.2 for an illustration of the analyses. To calculate the frequency histogram of vessel diameters, all vessel diameters are pooled, and a contingency table is calculated as either absolute values or as a percentage of maximum frequency.
Fig. 15.2.
Measurement of microvascular parameters on stained mesenteries. Red isolectin-stained vessels, green NG2-stained pericytes. Parameters of width (measured line by w), length (measured line by l), sprouts (sp), branches (bp), and pericyte coverage (delineated green divided by delineated red areas by pc). Note that the pericytes can be seen right up to the tips of the sprouts (grey arrowhead).
2.5. Adenovirus Amplification
Although all adenoviruses we have used have been previously used and characterised, it is necessary to ensure that they are still biologically active. For this, plaque assays are carried out to minimise the amplification of defective adenovirus.
2.6. Plaque Purification
Under aseptic conditions, HEK-293 cells are grown in Dulbecco’s modified Eagle’s medium (DMEM) supplemented (per 500-mL bottle) with 50 mL foetal bovine serum (FBS), 10 mL L-glutamine, 10 mL HEPES buffer, and 10 mL penicillin/streptomycin. For normal passage and amplification, cells are grown in 75-cm2 cell culture plates. Cells are split at 80% confluency. Cell splitting is carried out by removing the growth media and washing in 3*PBS before the addition of 5 mL trypsin-EDTA (ethylenediaminetetraacetic acid). The flasks are incubated at 37°C for 5 min. The cell suspension is then added to 10 mL DMEM and centrifuged for 5 min. The medium is removed and the cell pellet resuspended and added to new flasks.
HEK-293 cells are plated and grown on 60-mm Petri dishes in DMEM. When cells reach 80% confluency, the medium is removed. Then, 10 μL adenovirus are diluted in 990 μL PBS2+ (0.1 mg/mL CaCl2, 0.1 mg/mL MgCl2 in PBS); this is then serially diluted an additional five times. To each place, carefully add 200 μL of the viral solution. The plate is carefully agitated every 5 min for 1 h.
A sterile 1% w/v agarose solution (Bioline, London) is melted and an equal volume added to 25 mL of 0.2 μm filter-sterilised 2*DMEM overlay medium (5 mL 10*DMEM), 5 mL heat-inactivated FCS, 2.5 mL 7.5% w/v sodium bicarbonate, 12.5 mL ddH2O [double-distilled water]). The 10 mL agarose overlay is gently added to each dish when it cools to 37°C. The plates are left at room temperature until the overlay sets, and then they are placed at 37°C in 5% CO2. Cytolytic plaques can be observed by eye and microscope by 8 d postinfection.
2.7. Plaque Isolation
Well-isolated plaques that appear 8 d after transfection are chosen for screening. A plug of agarose around each viral plaque is removed and placed in 1 mL sterile PBS. The plaque is then lysed in liquid nitrogen and thawed before vortexing the tube. Low-passage Chinese hamster ovary (CHO) cells are previously grown to 80% confluency in 25-cm2 culture flasks with 3 mL F-12 medium (supplemented with 5 mL penicillin/streptomycin and 50 mL FBS; Gibco). The medium is removed, and 500 μL of PBS2+/plaque mix are spread across the cell monolayer. The flask is then incubated at 37°C for 4 d. The remainder of the plaque solution is stored at −80°C until further use.
2.8. Large-Scale Amplification
Following verification of gene product expression, 500 μL of the PBS/agarose mix are added to a 75-cm2 (Nunc, UK ) flask of 80% confluent HEK-293 cells. Low-passage HEK-293 cells are grown to 80% confluency in 10*175 cm2. When the first flask reaches full cytopathic effect (CPE) and begins detaching from the culture plate, the media and cell suspension are removed and added to the 10*175 cm2. Approximately 3 d postinfection, the cells reach CPE but have not detached. The cells are removed and centrifuged at 2000 rpm for 10 min at 22°C. The cell pellets are pooled and resuspended in 5 mL of 200 mM Tris-HCl (pH 7.5) solution and stored at −20°C overnight.
2.9. Adenovirus Purification
Viruses are liberated from HEK-293 by a single freeze/thaw cycle followed by sonication on ice for four 30-s pulses. The suspension is then centrifuged at 2000 rpm for 10 min to remove all cell debris. The supernatant (now containing released viral particles) is added to 0.6 volumes of CsCl-saturated 100 mM Tris-HCl (pH 7.5). This is transferred to a 11.2-mL OptiSeal polyallomer ultracentrifuge tube (Beckman, Fullerton, CA, USA), and the volume is made up to 11.2 mL with a solution containing 0.6 volumes CsCl-saturated 100 mM Tris-HCl at pH 7.5 to one volume of 100 mM Tris-HCl. The tube is centrifuged at 65,000 rpm (NVTi 65.1 ultracentrifuge rotor, Beckman) for at least 8 h at 25°C. The resultant white virus particle band (approximately 200 μL) is removed from the tube with an 18-gauge needle and 5-mL syringe. To ease removal of the band, 3*27-gauge needles are placed in the top of the tube. The viral isolate is then added to approximately 11 mL of CsCl-Tris-HCl solution as before and centrifuged at 65,000 rpm for at least 8 h at 25°C. The resultant viral band is removed as before, and the volume made up to 2.5 mL with 100 mL Tris-HCl (pH 7.5) in a sterile bijou.
Salt residues are removed from the viral isolate with a Sephadex PD10 column (Pharmacia Biotech, USA ) is equilibrated with 25 mL of storage buffer (10 mM Tris-HCl, 1 mM MgCl2, pH 8.0) and the viral isolate added to the column. The purified virus is eluted from the column by addition of a further 3.5 mL storage buffer and collected in a sterile bijou. The desalted viral suspension is then filtered using a 0.2-μm sterile filter (Sartorius, Edgewood, NY, USA), aliquoted into sterile Eppendorf tubes, snap-frozen in liquid nitrogen, and stored at −80°C.
2.10. Recombinant Adenovirus Titration by Tissue Culture Infectious Dose 50
To determine the viral titre, the tissue culture infectious dose 50 (TCID50) method is used. This has the advantage of having greater reliability, ease, and speed of results and more consistency between individuals.
The following procedures are carried out in duplicate. A 75-cm2 flask of HEK-293 cells is taken, suspended in 20 mL of 2% FBS-DMEM, and counted using a haemocytometer. Add 100 μL of cell suspension per well (approximately 104 cells) of a 96-well plate. The cells are allowed to attach overnight.
Add 990 μL of 2% FBS-DMEM to 0.1 μL viral stock and agitate, forming a 10−2 dilution. Eight 15-mL Falcon tubes with 1.8 mL of 2% FBS-DMEM are taken, and 200 μL of the 10−2 viral solution are added to the first tube. This is then serially diluted from 10−3 to 10−10. A new filtered pipette tip (Starlab, Milton Keynes) is used each time. two columns are used as controls, with only cells and 2% FBS-DMEM in each well.
Add 100 μL of each viral solution to each well and incubate at 37°C for 10 d, with each row representing increased dilution. At 10 d postinfection, the wells that underwent CPE are counted, and a fraction of cells with CPE per row is measured as a ratio. The following equation is used to calculate titre:
where S is the sum of the ratios starting at 10(−1) dilution. If all cells died, then the ratio is 1; d is the log dilution factor. The average of both plates is taken as the viral titre. Conversion to PFU per millilitre is carried out by dividing the TCID50 by 0.7.
3. Results
3.1. Ang-1 and VEGF Increase Functional Vessel Area
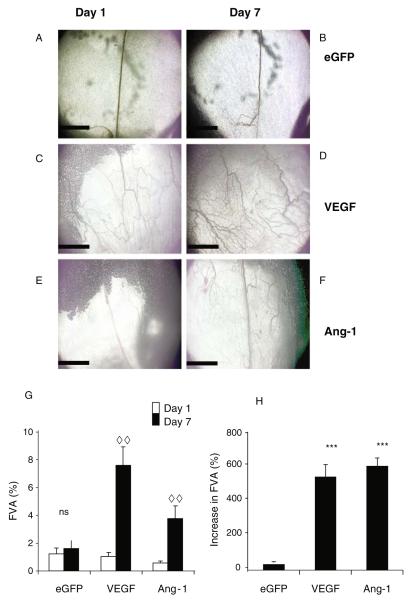
To quantify functional changes brought about by growth factor expression (as confirmed by enzyme-linked immunosorbent assay [ELISA]; 16), intravital microscopy is used to image the microvessel bed before and after administration of the growth factor. On d 1, clear, functional vessels (FVA) are seen ( Fig. 15.3a,c,e). The area covered by these vessels (FVA) is measured using Open-Lab. After 6 d of infection with Ad-GFP, a similar functional vessel area Is seen ( Fig. 15.3b,g), but following injection of angiogenic growth factors there is an increase in the perfused area (Fig. 15.3d,f,g,h). Application of eGFP does not result in a significant increase in FVA (Fig. 15.3g), and consequently there is no angiogenic response (AI%, Fig. 3h). VEGF induces a significant increase in FVA (Fig. 15.3g) and significantly increases AI compared with control (Fig. 15.3h). Ang-1 also increases FVA ( Fig. 15.3g) and increases the AI compared with control (Fig. 15.3h), but this increase is no different from VEGF.
Fig. 15.3.
Intravital images of mesenteric panels before and after growth factor overexpression (A–F). Intravital images obtained by −4 objective lens of patent vessels. Vessels on d 1 (A, C, E) and the same vessels imaged 6 d later (B,D,F). Vessels are visible due to the contrast of the blood flow. An increase in functional vessel area (FVA) is determined by an increase in patent vessel area (G), the magnitude of this increase is measured in H. ***p < 0.001 versus enhanced green fluorescent protein (eGFP), analysis of variance (ANOVA), ..p < 0.01 d 1 versus d 7, t-test. Scale bar 1 mm, n = 5 all groups, mean ± standard error of the mean (SEM). Ang-1 angiopoietin 1, VEGF vascular endothelial growth factor
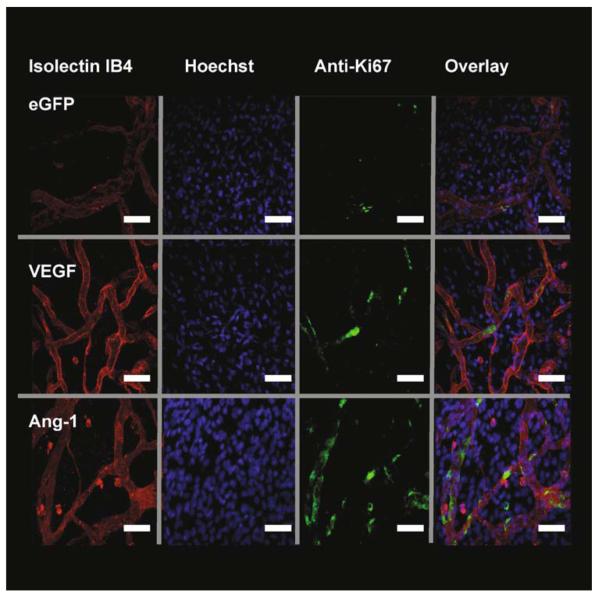
In summary, both growth factors are capable of increasing vessel perfusion (as determined by an increased area of visible blood vessel), but to determine if this is due to a haemodynamic effect (VEGF is a known vasodilating agent (Horowitz et al., 1997) or if there is an angiogenic response (e.g., increase in vessel density, sprouting, proliferation, etc.), a detailed examination of the microvessel bed is necessary, and this can be done by immunofluorescence and confocal microscopy. Images obtained from immunofluorescent confocal microscopy ( Fig. 15.4) using antibodies to Ki67, with lectin and Hoechst 33324 counterstaining, are used to examine neovessel phenotype. Overlaid images of the three image stacks are used to identify the density of PECs.
Fig. 15.4.
Growth factor expression stimulates endothelial cell (EC) proliferation. Fluorescent staining of mesenteries after injection of adenovirus-enhanced green fluorescent protein (Ad-EGFP) (control) or Ad-growth factors. Isolectin IB4-TRITC (red) stains endothelial cells ECs, Hoechst 33324 (blue) stains all mesenteric nuclei and antibodies to Ki67-AF488 (green) to detect proliferating cells. Overlaying of the stack images is used to calculate the number of proliferating endothelial cells (PECs). Images are triple stained with TRITC-streptavidin and biotinylated GSL lectin IB4 (EC, red). Alexa Fluor 488-labeled goat antimouse immunoglobulin G and mouse monoclonal anti-Ki67 antibody (proliferating cells, green) and overlay. The PECs can be distinguished from other cells by their position within the vessel wall. White arrow demonstrates a PEC. VEGF vascular endothelial growth factor. Scale bar 40 μm
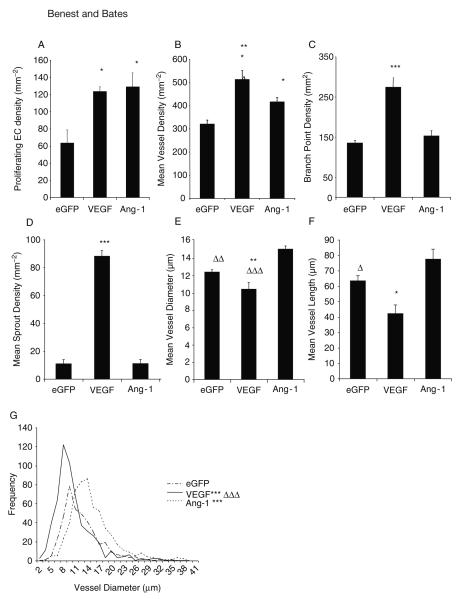
The analysis of the stained mesenteries can produce a lot of information about the nature of the angiogenesis. This is summarised in Fig. 15.5. To begin, it is clear that the increase in vessel perfusion brought about by growth factors must be due to vessel proliferation, not just vasodilation. The assay shows that both VEGF and Ang-1 increase PEC density compared with control as the Ki67-positive endothelial nuclei are increased. However, there is no difference between the growth factors. In the relatively avascular mesentery, generation of new blood vessels will increase the vessel density (vessels per area of tissue) as the new vessels are more likely to invade into previously unvascularised mesothelial tissue. VEGF and Ang-1 both increase vessel density compared with eGFP, and VEGF also increased the vessel density compared with Ang-1. However, this method allows a subtler interpretation. The manner in which the microvessels are formed, the branch point density, and the sprout point density can be measured. Consistent with VEGF inducing sprout formation, there is a significant increase in sprout point density following VEGF but not Ang-1 application compared with control. Moreover, the branch point density follows an identical pattern. Taken together, this assay can demonstrate that Ang-1 does not induce sprout formation or increase branching, whereas VEGF does, although both VEGF and Ang-1 increased the FVA to approximately the same level. As blood flow is largely dependent on the vessel diameter, this increase in flow could be brought about by an increase in diameter of the vessels. This assay also allows measurement of microvessel diameter. Consistent with the notion that VEGF induces sprout formation and then remodels them to form neovessels, VEGF produces narrower microvessels, which were significantly narrower than with eGFP and Ang-1. Of note, Ang-1 significantly increases the vessel diameter. Ang-1 produces significantly longer vessels than VEGF, which may be representative of the reduced sprouting and branching behaviour rather than independent effect. In addition to the increased mean vessel diameter, frequency histograms of microvessel diameters can be generated, and these demonstrate that VEGF produces a significantly different distribution compared with eGFP and Ang-1 (analysed by χ2 analysis).
Fig. 15.5.
Vascular endothelial growth factor (VEGF) and angiopoietin 1 (Ang-1) are proangiogenic, yet result in different vessel phenotypes. Analysis of blood vessel parameters, from confocal stack data of mesenteries stained for lectin, Hoechst, and Ki67. Analysis of proliferation data (A), microvessel density (B), branch point (C), and sprout point (D) revealed that VEGF induced a hyperplasic response, but Ang-1 increased proliferation, but vessel density only increased by a moderate degree. Additional analysis of microvessels from confocal data. VEGF reduced vessel diameter and vessel length, reflective of increases in branching and sprouting (A, B). Consistent with increased branching and sprouting, Ang-1 increased mean vessel diameter (E) but did not alter vessel length (F). VEGF produced shorter vessels, and Ang-1 produced longer ones. Frequency histogram of mean vessel diameters of each vessel measured demonstrates a significant difference in the distribution of each treatment group (G). *p < 0.05, ***p < 0.001 versus enhanced green fluorescent protein (EGFP), Δ p < 0.05, .. p < 0.01, … p < 0.001 versus Ang-1. All values shown are mean ± standard error of the mean (SEM), n = 5. EC endothelial cell
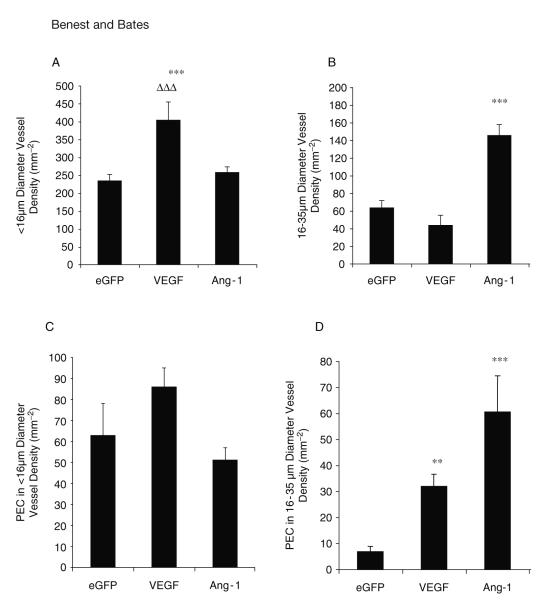
It has been shown that VEGF selectively affects microvessels according to their size in the mesentery (17), and in the tracheal system it has been demonstrated that Ang-1 affects venules specifically (19-21). This assay can be used to analyse if there is a difference between exchange (<16-μm diameter) and larger, conduit capillaries (16–35 μm). This is based on the antique works of Schleier, who analysed the diameters of all vessels present in the dog mesentery, leading to the classification of vessels smaller than 16 μm to be exchange (terminal capillaries) and 16- to 35-μm vessels to be conduit capillaries (22). For instance, Ang-1 produces more conduit vessels compared with eGFP and VEGF, whereas VEGF produces more exchange capillaries than eGFP or Ang-1 ( Fig. 15.6). It can also be determined that Ang-1 induces a greater degree of proliferation in the larger microvessels than eGFP and VEGF. Taken together, these results suggest that the assay can be used to show that Ang-1 is a more potent inducer of microvascular hypertrophy, and VEGF is more potent at neovascular angiogenesis.
Fig. 15.6.
Different growth factors preferentially produce and activate different subtypes of vessel. Vascular endothelial growth factor (VEGF) stimulated the generation of sub-16-μm diameter vessels compared with angiopoietin 1 (Ang-1) or green fluorescent protein (GFP) (A). Ang-1 transfections stimulated the generation of 16- to 35-μm diameter vessels to a greater extent than enhanced GFP (eGFP) or VEGF (B).In larger vessels, VEGF and Ang-1 stimulated endothelial proliferation, Ang-1 to a greater extent (C), whereas in smaller vessels endothelial cell proliferation was not increased (D). All values shown are mean ± standard error of the mean (SEM), n = 5. *p < 0.05, **p < 0.01, ***p < 0.001 versus EGFP, … p < 0.001 versus Ang-1. PEC proliferating endothelial cells
3.2. Pericyte Support
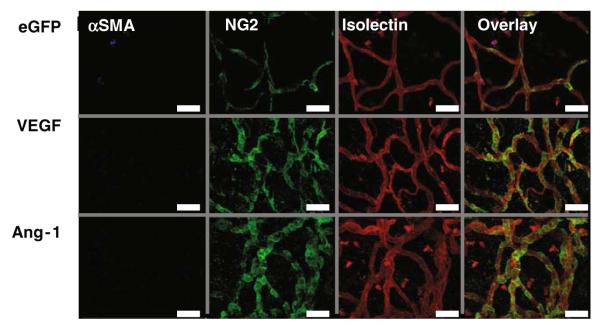
The role of periendothelial support in angiogenesis is not clear, with the majority of data coming from tumour studies. But, transgenic studies indicated that the Ang-1/Tie2 system has a role in regulating the degree of periendothelial support (23-25). This assay enables analysis of mural cell association with the microvessels. Figure 15.7 demonstrates pericytes wrapping around the vessel, with what appears to be a close association between the endo- and periendothelium. The absence of any αSMA-containing cells in the presence of NG2-labelled pericytes demonstrates that the periendothelium was entirely pericyte derived. VEGF-stimulated vessels appear to have pericytes not only along the length of the vessel but also at branch and sprout points. Ang-1 induces vessels that have a considerably higher degree of association, with the majority of the vessel covered in pericyte.
Fig. 15.7.
Growth factor expression stimulates endothelial cell (EC) proliferation. Fluorescent staining of mesenteries after injection of adenovirus-enhanced green fluorescent protein (Ad-EGFP) (control) or Ad-growth factors. Isolectin IB4-TRITC (red) stains ECs, Hoechst 33324 (blue) stains all mesenteric nuclei and antibodies to Ki67-AF488 (green) to detect proliferating cells. Overlaying of the stack images is used to calculate the number of proliferating endothelial cells (PECs). Images are triple stained with TRITC-streptavidin and biotinylated GSL lectin IB4 (ECs, red). Alexa Fluor 488-labeled goat antimouse immunoglobulin G and mouse monoclonal anti-Ki67 antibody (proliferating cells, green) and overlay. The PECs can be distinguished from other cells by their position within the vessel wall. White arrow demonstrates a PEC. Scale bar 40 μm. SMA smooth muscle area
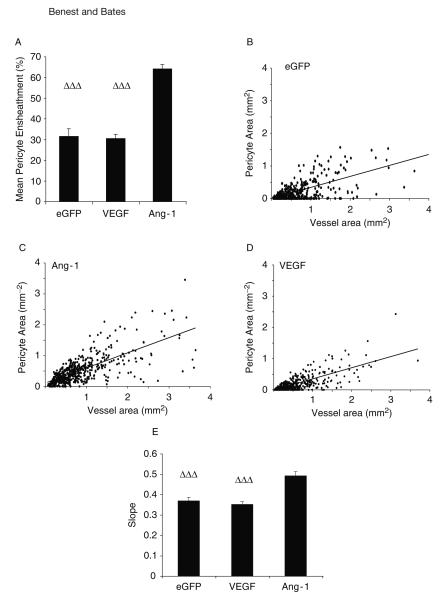
The pericyte coverage (FPA) can be calculated as the percentage of endothelium covered by pericyte. Ang-1 increases the FPA (almost double) compared with eGFP and VEGF, whereas VEGF does not change the coverage compared with control. By plotting the vessel area (mm2) against the pericyte area (mm2) for the different treatment groups, the relationship between pericyte and endothelial cells can be investigated. This is increased by Ang-1 (Fig. 15.8).
Fig. 15.8.
Angiopoietin 1 (Ang-1) enhances the association between pericyte and blood vessel area. The area of each blood vessel covered by pericyte (fractional pericyte area, A) is increased by Ang-1 but is not changed between enhanced green fluorescent protein (eGFP) or vascular endothelial growth factor (VEGF). Correlation analysis between vessel area and pericyte area eGFP (B), Ang-1(C), VEGF(D). Comparison of the slope by analysis of variance (ANOVA) reveals Ang-1 has a greater association (E), that is, larger vessels have a better pericyte coverage. … p < 0.001 versus Ang-1. All values shown are mean ± standard error of the mean (SEM), n = 5
4. Discussion
Growth factor-induced angiogenesis can be characterised in many models. However, the advantage of the rat mesenteric adenovirus assay (17) is that it allows detailed and subtle phenotypic differences between growth factors to be analysed as shown here. The key advantage of this assay is to marry such detailed and subtle phenotypic measurements with functional assessment, including flow measurements, permeability, compliance, and ultrastructural investigations. For instance, we provide evidence that VEGF does increase the FVA; in addition to this, we can also record an increase in vessel density. Likewise, although the therapeutic potential of Ang-1 has been tested in rabbit hindlimb ischaemia models, and Ang-1 was seen to enhance tissue perfusion via naked plasmid transfection (26, 27), the potential impact of the previously induced ischaemia might obscure any measurable role of Ang-1.
4.1. Increased Vascularity
The use of angiography as a measure of “angiogenesis” relies on the caveat that there was a vasodilatating effect of the growth factors used. VEGF is a potent vasodilator (28), but so far there have been no reports of such an effect by Ang-1. Using this assay, we can show that both VEGF and Ang-1 significantly increase the vessel density over eGFP. Moreover, it should be noted that the effect of Ang-1 was only modest in comparison to VEGF. VEGF is currently the most proangiogenic molecule identified, and it is known to lead to an increase in vessel density in a number of models (1, 6, 7, 29). The increase in vessel density seen here is modest compared with that seen with transgenic overexpression in the skin (25), adenoviral-mediated Ang-1 in rabbit carotid adventitia (30), or COMP-Ang-1 pellets in the cornea (31). The work by Suri et al. used whole-mount, perfusion-fixed, and stained skin tissue, which only allowed analysis of perfused vessels, and the efficacy of staining would be limited by haemodynamic factors and the risk of antibodies/lectins diffusing into the mesenchyme (25). The work by Bhardwaj et al. used a heavily inflamed tissue, which would prevent interpretation of the role of Ang-1 in the absence of other inflammatory cytokines. Cho et al. used the rabbit cornea, which is normally avascular and is not a physiological model of angiogenesis as the tissue does not normally support blood vessel growth due to endogenous inhibition of angiogenesis by soluble flt-1 (32).
4.2. Vessel Morphology
VEGF-treated dermal tissue produced irregular-formed, pericyte-devoid, hypertrophic, and heterogenic vessels (33). Our whole-mount analyses revealed that the vessels formed were generally of quite small calibre (.10 μm), and we demonstrated a highly significant degree of sprout and branch formation. It can be interpreted that the sprouts are re-formed into neovessels (leading to increased vessel density and branch point formation). The narrow vessel diameter may be a factor of the narrow sprout being remodelled, and the vessel reaches optimum diameter as perfusion is achieved (34). The sprouting phenotype observed in this assay is consistent with other findings examining the phenotypic effects of VEGF (2, 6, 21, 35-38) . In contrast, this assay shows that Ang-1 increases vessel diameter (15 μm), with no increase in sprout point or branch point formation. Ang-1 has been described to induce in vitro sprouting activity and associated protease release (26, 39). However, Ang-1-mediated sprouting is difficult to assess in vivo, and a lack of vessel sprouting has been previously described using the mouse tracheal microcirculation (21) and mouse skin (25, 40).
4.3. Endothelial Cell Proliferation In Vivo
The use of the assay to show that both Ang-1 and VEGF induced a high degree of endothelial cell proliferation demonstrated the utility of the assay for proving angiogenesis. Ang-1 was previously not thought to be proliferative in vitro (26, 41), although it has been reported in vivo that Ang-1 treatment led to increased expression of proliferation markers (21, 31).
4.4. Periendothelium
The investigation of pericyte function and form is of increasing interest. This assay clearly demonstrates that Ang-1 is able to recruit pericytes to the growing endothelium. Despite tumour studies that have demonstrated that altering Ang-1 overexpression is capable of altering pericyte recruitment (e.g., 42, 43) there is no agreement regarding whether this is conducive for angiogenesis. Knockout studies have confirmed a role for Ang-1 in endothelial-pericyte support (24), but the effects of Ang-1 on the endothelium are probably not direct. However, evidence for a role in Erb signalling exists as Ang-1 could upregulate Erb, which in turn is known to attract mural cells and induce mural cell proliferation through HB-EGF (44-47). Other candidates for recruitment of periendothelial cells to the vessel were 5-HT, by which Ang-1 can induce production and release from the endothelial cell (45, 48, 49). Serotonergic receptors are found on smooth muscle cells from human and rodent origin (49) and are believed to be essential for the migration and proliferative pathways. It will be interesting to determine whether there are 5-HT receptors in this preparation.
4.5. Pericyte Coverage as a Regulator of Angiogenesis
In this assay, pericyte coverage does not appear to be an essential regulator of angiogenesis. Pericyte coverage does not change when VEGF is overexpressed; that is, there are still pericytes associated with the growing vessel, but the microanatomical architecture is altered. The physiological role of pericytes is still not clear. It appears as though they might regulate vessel morphology and endothelial cell number (50) and release prosurvival molecules such as Ang-1 to the endothelium (51, 52). This may result in the prevention of remodelling, so-called termination of the plasticity window for vessel remodelling (53-55). Consequently, it is been suggested that angiogenesis requires this brake to be relieved, and Ang-2 has been proposed to be the critical mediator of this event (5, 56). Although this is clearly the case when considering VEGF-induced angiogenesis, which is a sprouting phenotype, this assay has been used to demonstrate that Ang-1-induced angiogenesis does not need this to occur. The plasticity argument would suggest that pericytes are recruited to end angiogenesis, whereas we and others provided evidence that pericytes can be attracted to sprouts (57, 58). Either way, vessels with enhanced pericyte coverage are considered capable of perfusing a neovascular bed more effectively (59).
In conclusion, the mesenteric angiogenesis assay is a highly sensitive, flexible, and subtle assay for investigation of blood vessel growth in vivo in a physiological vascular bed. The experiments are not onerous or technically difficult and do not require special equipment. They do require substantial analysis time, but that results in a very useful analysis of growth characteristics and can be linked to physiological data.
References
- 1.Wang JF, Zhang X, Groopman JE. J Biol Chem. 2004;279:27088–27097. doi: 10.1074/jbc.M314015200. [DOI] [PubMed] [Google Scholar]
- 2.Woolard J, Wang WY, Bevan HS. Cancer Res. 2004;64:7822–7835. doi: 10.1158/0008-5472.CAN-04-0934. [DOI] [PubMed] [Google Scholar]
- 3.Rissanen TT, Markkanen JE, Gruchala M. Circ Res. 2003;92:1098–1106. doi: 10.1161/01.RES.0000073584.46059.E3. [DOI] [PubMed] [Google Scholar]
- 4.Vajanto I, Rissanen TT, Rutanen J. J Gene Med. 2002;4:371–380. doi: 10.1002/jgm.287. [DOI] [PubMed] [Google Scholar]
- 5.Visconti RP, Richardson CD, Sato TN. Proc Natl Acad Sci U S A. 2002;99:8219–8224. doi: 10.1073/pnas.122109599. [DOI] [PMC free article] [PubMed] [Google Scholar]
- 6.Baluk P, Lee CG, Link H. Am J Pathol. 2004;165:1071–1085. doi: 10.1016/S0002-9440(10)63369-X. [DOI] [PMC free article] [PubMed] [Google Scholar]
- 7.Detmar M, Brown LF, Schon MP. J Invest Dermatol. 1998;111:1–6. doi: 10.1046/j.1523-1747.1998.00262.x. [DOI] [PubMed] [Google Scholar]
- 8.Sundberg C, Nagy JA, Brown LF. Am J Pathol. 2001;158:1145–1160. doi: 10.1016/S0002-9440(10)64062-X. [DOI] [PMC free article] [PubMed] [Google Scholar]
- 9.Thurston G, Rudge JS, Ioffe E. Nat Med. 2000;6:460–463. doi: 10.1038/74725. [DOI] [PubMed] [Google Scholar]
- 10.Cursiefen C, Chen L, Borges LP. J Clin Invest. 2004;113:1040–1050. doi: 10.1172/JCI20465. [DOI] [PMC free article] [PubMed] [Google Scholar]
- 11.Ziche M, Morbidelli L, Choudhuri R. J Clin Invest. 1997;99:2625–2634. doi: 10.1172/JCI119451. [DOI] [PMC free article] [PubMed] [Google Scholar]
- 12.Glass CA, Harper SJ, Bates DO. J Physiol. 2006;572:243–257. doi: 10.1113/jphysiol.2005.103127. [DOI] [PMC free article] [PubMed] [Google Scholar]
- 13.Bates DO. J Physiol. 1998;513(Pt 1):225–233. doi: 10.1111/j.1469-7793.1998.225by.x. [DOI] [PMC free article] [PubMed] [Google Scholar]
- 14.Dietrich HH. Microvasc Res. 1989;38:125–135. doi: 10.1016/0026-2862(89)90021-6. [DOI] [PubMed] [Google Scholar]
- 15.Takano H, Dora KA, Spitaler MM, Garland CJ. J Physiol. 2004;556:887–903. doi: 10.1113/jphysiol.2003.060343. [DOI] [PMC free article] [PubMed] [Google Scholar]
- 16.Benest AV, Salmon AH, Wang W, et al. Microcirculation. 2006;13:423–437. doi: 10.1080/10739680600775940. [DOI] [PubMed] [Google Scholar]
- 17.Wang WY, Whittles CE, Harper SJ, Bates DO. Microcirculation. 2004;11:361–375. doi: 10.1080/10739680490437568. [DOI] [PubMed] [Google Scholar]
- 18.Schreihofer AM, Hair CD, Stepp DW. Am J Physiol Regul Integr Comp Physiol. 2005;288:R253–R261. doi: 10.1152/ajpregu.00498.2004. [DOI] [PubMed] [Google Scholar]
- 19.Baffert F, Le T, Thurston G, McDonald DM. Am J Physiol Heart Circ Physiol. 2006;290:H107–H118. doi: 10.1152/ajpheart.00542.2005. [DOI] [PubMed] [Google Scholar]
- 20.Thurston G, Suri C, Smith K. Science. 1999;286:2511–2514. doi: 10.1126/science.286.5449.2511. [DOI] [PubMed] [Google Scholar]
- 21.Thurston G, Wang Q, Baffert F. Development. 2005;132:3317–3326. doi: 10.1242/dev.01888. [DOI] [PubMed] [Google Scholar]
- 22.Schleier J. Arch Gesamte Physiol. 1918;173:172–204. [Google Scholar]
- 23.Sato TN, Tozawa Y, Deutsch U. Nature. 1995;376:70–74. doi: 10.1038/376070a0. [DOI] [PubMed] [Google Scholar]
- 24.Suri C, Jones PF, Patan S. Cell. 1996;87:1171–1180. doi: 10.1016/s0092-8674(00)81813-9. [DOI] [PubMed] [Google Scholar]
- 25.Suri C, McClain J, Thurston G. Science. 1998;282:468–471. doi: 10.1126/science.282.5388.468. [DOI] [PubMed] [Google Scholar]
- 26.Chae JK, Kim I, Lim ST. Arterioscler Thromb Vasc Biol. 2000;20:2573–2578. doi: 10.1161/01.atv.20.12.2573. [DOI] [PubMed] [Google Scholar]
- 27.Shyu KG, Manor O, Magner M, Yancopoulos GD, Isner JM. Circulation. 1998;98:2081–2087. doi: 10.1161/01.cir.98.19.2081. [DOI] [PubMed] [Google Scholar]
- 28.Horowitz JR, Rivard A, van der Zee R. Arterioscler Thromb Vasc Biol. 1997;17:2793–2800. doi: 10.1161/01.atv.17.11.2793. [DOI] [PubMed] [Google Scholar]
- 29.Cao R, Eriksson A, Kubo H, Alitalo K, Cao Y, Thyberg J. Circ Res. 2004;94:664–670. doi: 10.1161/01.RES.0000118600.91698.BB. [DOI] [PubMed] [Google Scholar]
- 30.Bhardwaj S, Roy H, Karpanen T. Gene Ther. 2005;12:388–394. doi: 10.1038/sj.gt.3302426. [DOI] [PubMed] [Google Scholar]
- 31.Cho CH, Kim KE, Byun J, et al. Circ Res. 2005 doi: 10.1161/01.RES.0000174093.64855.a6. [DOI] [PubMed] [Google Scholar]
- 32.Ambati BK, Nozaki M, Singh N. Nature. 2006;443:993–997. doi: 10.1038/nature05249. [DOI] [PMC free article] [PubMed] [Google Scholar]
- 33.Pettersson A, Nagy JA, Brown LF. Lab Invest. 2000;80:99–115. doi: 10.1038/labinvest.3780013. [DOI] [PubMed] [Google Scholar]
- 34.Djonov V, Baum O, Burri PH. Cell Tissue Res. 2003;314:107–117. doi: 10.1007/s00441-003-0784-3. [DOI] [PubMed] [Google Scholar]
- 35.Baffert F, Thurston G, Rochon-Duck M, Le T, Brekken R, McDonald DM. Circ Res. 2004;94:984–992. doi: 10.1161/01.RES.0000125295.43813.1F. [DOI] [PubMed] [Google Scholar]
- 36.Gerhardt H, Betsholtz C. Cell Tissue Res. 2003;314:15–23. doi: 10.1007/s00441-003-0745-x. [DOI] [PubMed] [Google Scholar]
- 37.Ruhrberg C, Gerhardt H, Golding M. Genes Dev. 2002;16:2684–2698. doi: 10.1101/gad.242002. [DOI] [PMC free article] [PubMed] [Google Scholar]
- 38.Wang JF, Zhang XF, Groopman JE. J Biol Chem. 2001;276:41950–41957. doi: 10.1074/jbc.M101370200. [DOI] [PubMed] [Google Scholar]
- 39.Kim I, Kim HG, Moon SO. Circ Res. 2000;86:952–959. doi: 10.1161/01.res.86.9.952. [DOI] [PubMed] [Google Scholar]
- 40.Baffert F, Le T, Sennino B. Am J Physiol Heart Circ Physiol. 2006;290:H547–H559. doi: 10.1152/ajpheart.00616.2005. [DOI] [PubMed] [Google Scholar]
- 41.Davis S, Aldrich TH, Jones PF. Cell. 1996;87:1161–1169. doi: 10.1016/s0092-8674(00)81812-7. [DOI] [PubMed] [Google Scholar]
- 42.Stoeltzing O, Ahmad SA, Liu W. Br J Cancer. 2002;87:1182–1187. doi: 10.1038/sj.bjc.6600598. [DOI] [PMC free article] [PubMed] [Google Scholar]
- 43.Stoeltzing O, Ahmad SA, Liu W. Cancer Res. 2003;63:3370–3377. [PubMed] [Google Scholar]
- 44.Iivanainen E, Nelimarkka L, Elenius V. FASEB J. 2003;17:1609–1621. doi: 10.1096/fj.02-0939com. [DOI] [PubMed] [Google Scholar]
- 45.Iwamoto R, Yamazaki S, Asakura M. Proc Natl Acad Sci U S A. 2003;100:3221–3226. doi: 10.1073/pnas.0537588100. [DOI] [PMC free article] [PubMed] [Google Scholar]
- 46.Kobayashi H, DeBusk LM, Babichev YO, Dumont DJ, Lin PC. Blood. 2006;108:1260–1266. doi: 10.1182/blood-2005-09-012807. [DOI] [PMC free article] [PubMed] [Google Scholar]
- 47.Nykanen AI, Pajusola K, Krebs R. Circ Res. 2006;98:1373–1380. doi: 10.1161/01.RES.0000225987.52765.13. [DOI] [PubMed] [Google Scholar]
- 48.Eddahibi S, Guignabert C, Barlier-Mur AM. Circulation. 2006;113:1857–1864. doi: 10.1161/CIRCULATIONAHA.105.591321. [DOI] [PubMed] [Google Scholar]
- 49.Sullivan CC, Du L, Chu D. Proc Natl Acad Sci U S A. 2003;100:12331–12336. doi: 10.1073/pnas.1933740100. [DOI] [PMC free article] [PubMed] [Google Scholar]
- 50.Hellstrom M, Gerhardt H, Kalen M. J Cell Biol. 2001;153:543–553. doi: 10.1083/jcb.153.3.543. [DOI] [PMC free article] [PubMed] [Google Scholar]
- 51.Erber R, Thurnher A, Katsen AD. FASEB J. 2004;18:338–340. doi: 10.1096/fj.03-0271fje. [DOI] [PubMed] [Google Scholar]
- 52.Reinmuth N, Liu W, Jung YD. FASEB J. 2001;15:1239–1241. doi: 10.1096/fj.00-0693fje. [DOI] [PubMed] [Google Scholar]
- 53.Benjamin LE, Golijanin D, Itin A, Pode D, Keshet E. J Clin Invest. 1999;103:159–165. doi: 10.1172/JCI5028. [DOI] [PMC free article] [PubMed] [Google Scholar]
- 54.Benjamin LE, Hemo I, Keshet E. Development. 1998;125:1591–1598. doi: 10.1242/dev.125.9.1591. [DOI] [PubMed] [Google Scholar]
- 55.Holash J, Wiegand SJ, Yancopoulos GD. Oncogene. 1999;18:5356–5362. doi: 10.1038/sj.onc.1203035. [DOI] [PubMed] [Google Scholar]
- 56.Maisonpierre PC, Suri C, Jones PF. Science. 1997;277:55–60. doi: 10.1126/science.277.5322.55. [DOI] [PubMed] [Google Scholar]
- 57.Lindblom P, Gerhardt H, Liebner S. Genes Dev. 2003;17:1835–1840. doi: 10.1101/gad.266803. [DOI] [PMC free article] [PubMed] [Google Scholar]
- 58.Gerhardt H, Golding M, Fruttiger M. J Cell Biol. 2003;161:1163–1177. doi: 10.1083/jcb.200302047. [DOI] [PMC free article] [PubMed] [Google Scholar]
- 59.Furuhashi M, Sjoblom T, Abramsson A. Cancer Res. 2004;64:2725–2733. doi: 10.1158/0008-5472.can-03-1489. [DOI] [PubMed] [Google Scholar]


