Abstract
A method for focusing high intensity ultrasound through a rib cage that aims to minimize heating of the ribs whilst maintaining high intensities at the focus (or foci) is proposed and tested theoretically and experimentally. Two approaches, one based on geometric acoustics and the other accounting for diffraction effects associated with propagation through the rib cage, are investigated theoretically for idealized source conditions. It is shown that for an idealized radiator the diffraction approach provides a 23% gain in peak intensity and results in significantly less power losses on the ribs (1% versus 7.5% of the irradiated power) compared with the geometric one. A 2D 1-MHz phased array with 254 randomly distributed elements, tissue mimicking phantoms, and samples of porcine rib cages are used in experiments; the geometric approach is used to configure how the array is driven. Intensity distributions are measured in the plane of the ribs and in the focal plane using an infra-red camera. Theoretical and experimental results show that it is possible to provide adequate focusing through the ribs without overheating them for a single focus and several foci, including steering at ± 10–15 mm off and ± 20 mm along the array axis. Focus splitting due to the periodic spatial structure of ribs is demonstrated both in simulations and experiments; the parameters of splitting are quantified. The ability to produce thermal lesions with a split focal pattern in ex vivo porcine tissue placed beyond the rib phantom is also demonstrated. The results suggest that the method is potentially useful for clinical applications of HIFU for which the rib cage lies between the transducer(s) and the targeted tissue.
Keywords: HIFU, Rib cage, Random phased array, Bone, Focus, Modeling, Diffraction, Ultrasound ablation, Infra-red camera, Thermocouple
Introduction
One of the limitations for broadening the applications of high intensity focused ultrasound (HIFU) for non-invasive destruction of deeply located tissues is related to the presence of strongly reflecting or strongly absorbing acoustic obstacles in the ultrasound propagation path. An obvious example of such an obstacle is a rib cage that complicates non-invasive HIFU surgical operations on liver or heart.
Due to the extremely high absorption of ultrasound in the ribs and reflection from them, the overheating of rib bones and overlying tissues, including the skin, is the major side effect of the treatment (Li et al. 2006). Additionally, the screening effect of the ribs leads to lower intensity levels in the focal region, which may not be sufficient for ablation of liver tissues.
Several research groups have investigated the problem of HIFU focusing in the presence of the rib cage. Theoretical feasibility studies regarding the use of a phased array for treating liver tumors shadowed by ribs were reported (Botros et al. 1998); however the methodology developed was not tested experimentally. The clinical application of HIFU using a single-element transducer to treat different solid tumors was described (Wu et al. 2004), and in some cases treatment involved the surgical removal of a section of the ribs located above the liver to provide an acoustic window during the HIFU procedure. A device based on a linearly segmented single focused transducer was developed for treating liver tumors that lie behind the ribs but close to the bottom of the ribcage (Civale et al. 2006). All the active elements were driven in phase but the device was oriented so that one or more segments of the array lying over the ribcage could be switched off to protect the ribs. The effect of ribs on therapeutic ultrasound treatment was investigated both theoretically and experimentally for two kinds of rib configuration, i.e. with the transducer centered either on an intercostal space or on a rib (Li et al. 2007). The first of these approaches appeared to be more effective for the conditions considered in the paper. Other investigators investigated theoretically an approach based on switching off those elements whose normal vectors crossed the ribs. This led to reduced absorption of acoustic energy by the ribs and therefore to decreased heating of them (Liu et al. 2007). Recently, the time reversal method for pulsed beams was proposed to evaluate the aberrating effects of a rib cage (Aubry et al. 2008). It was demonstrated that application of the method in combination with random phased arrays minimizes the heating of the ribs by automatically sonicating between them. In order to provide even better protection of ribs, a method based on the decomposition of the time reversal operator (DORT method) was suggested (Cochard et al. 2009). However, time reversal methods rely on the condition of physical existence of a point target at the focus or modeling the virtual propagation from the point source using CT or MRI data of the propagation path, which is much more challenging to realize in clinical conditions. In discussing their work (Aubry et al. 2008), the authors suggested the future investigation of an alternative, “non-invasive” approach to address this problem by switching off the elements of a phased array that are located in front of the ribs.
In general, the approaches that have been proposed up to date for HIFU treatment through ribs can be divided into two groups. These approaches are named differently in the literature and they may be realized slightly differently, but basically they rely on two different ideas. In the first group, if a part of the source surface is in the geometric shade of the ribs, an effort is made to switch off this part of the transducer or array elements (Civale et al. 2006; Liu et al. 2007 (“dynamic element activation”), Aubry et al. 2008 (“non-invasive approach”)). In this paper we refer to this approach as a “geometric” one to emphasize its nature.
In this paper we have referred to the second group of methods as the “diffraction” approach - which includes the “time reversal” method for pulses (Aubry et al. 2008; Cochard et al. 2009) or phase conjugation method for continuous waves (Liu et al. 2007). In this group, either pulsed or harmonic wave propagation from a point source located physically or virtually at the intended treatment site toward the source is considered. The effects of diffraction, inhomogeneities, reflections, and other wave phenomena determine acoustic field distribution at the transducer surface which continuously varies both in time (pulses) or phase (cw) and amplitude. The distribution is then modified to fit the discrete geometry of the transducer array. It has been shown that the time reversal method gives little improvement in focal distributions, but less heating of ribs compared with the “non-invasive” geometric approach (Aubry et al. 2008).
It is not obvious if time reversal and phase conjugation (referred to as “diffraction” in this paper) methods would provide the same optimization results compared to the geometric method since time reversal concentrates acoustic energy in both time and in space, whereas phase conjugation does so only in space. Time reversal therefore may potentially give better results. However, it operates with pulses, while cw waves are more suitable for thermal tissue ablation. These two methods therefore complement each other and their roles require further investigation. Both time reversal and phase conjugation methods rely on the physical existence of a point target at the focus (Cochard et al. 2009) or modeling of virtual propagation from a point source using, for example, CT or MRI data of the propagation path, which is much more challenging to realize in clinical conditions. The advantage of the “geometric” approach, besides its simplicity, is that it is completely “non-invasive”, i.e. does not require a real point source, hydrophone, or scatterer induced at the focus, and appears to be a good candidate for initial studies in a clinical setting.
In this paper, the “geometric” and “diffraction” methods for selecting an appropriate boundary condition at the source are first examined theoretically for focusing high intensity continuous ultrasound wave through ribs. The methods are tested in simulations for an “idealized” radiator with an arbitrary amplitude-phase distribution over the surface. In the “geometric” approach the velocity amplitude at the source surface shadowed by ribs is set to zero. In the second approach, diffraction effects and the phase conjugation method are included to improve focusing and to provide better protection of the ribs. To simulate the experimental conditions, propagation through the rib cage using a 254-element random phase array is modeled and the geometric approach is modified for the specific parameters of the array. The array elements located opposite the ribs are switched off and the total acoustic power is maintained by increasing the output from the other elements. The approach also includes reversing the wave front radiated by the point source(s) and optimizing the amplitude-phase distributions on the elements of the array using the pseudo-inverse technique (Ebbini and Cain 1991). Spatial splitting of focal distributions of the ultrasound field caused by the presence of ribs and their periodic spatial structure are discussed and compared to the modeling and experimental observations of other authors.
The method for driving the array is then implemented in the experiments. Details of the random array are given elsewhere (Hand et al. 2009, Hand and Gavrilov 2000, Gavrilov and Hand 2000a). An array of similar design was also used in transcranial (Pernot et al. 2003) and recent transcostal (Tanter et al. 2007; Aubry et al. 2008) HIFU studies. Here, experiments were performed in water with rib phantoms and ex vivo porcine tissue. Spatial patterns of intensity were recorded in water in the plane of the ribs and in the focal plane using an infra-red camera. A method was also proposed to estimate the absolute values of intensity from the IR temperature measurements. The ability of the array to steer a single focus as well as patterns of multiple foci was examined. Thermal lesions were produced in the porcine tissue placed beyond the rib phantom. The results of theoretical and experimental investigations presented demonstrate the feasibility of the proposed method to minimize the ultrasound energy incident on the ribs whilst maintaining high focal intensities sufficient to produce ablation in underlying tissue.
Materials and methods
Acoustic field modeling for an idealized ultrasound radiator in the presence of ribs
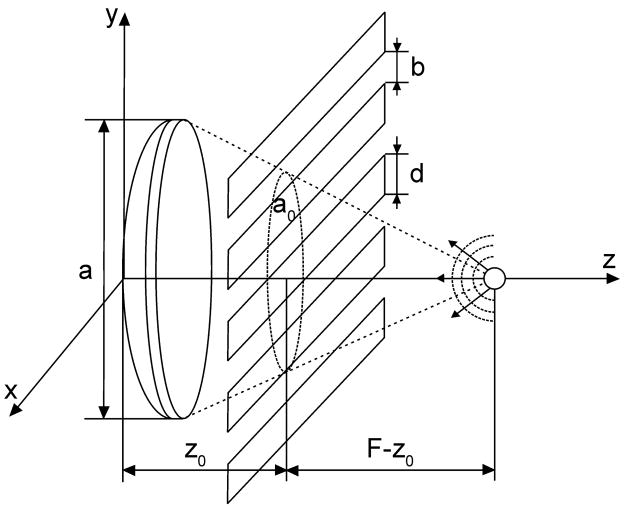
The geometry of focusing and the position of the ribs used in these modeling studies are shown in Fig. 1. The radiator was a spherical shell with radius of curvature F, aperture a and operating frequency f. The rib plane was located at a distance z0 from the centre of the radiator and infinitely thin, 100% absorbing parallel strips of width d and with intercostal spaces b were used to simulate the rib cage. The focus was located at the centre of curvature of the radiator. To better understand the effect of the ribs, an idealized radiator, i.e. a transducer for which the magnitude and phase of excitation were both continuously variable over its surface, was considered. The case of an array comprising a fixed number of discrete, finite-sized elements is considered later.
Figure 1.
Geometry of modeling the propagation through ribs as infinitely thin strips (idealized ribs). Vibration amplitude and phase can have arbitrary shape over the surface of the radiator (idealized radiator).
Two methods were proposed and tested to determine the “optimal” amplitude-phase distribution at the surface of the radiator that resulted in the radiated field being minimized on the ribs but focused at the desired location. In both methods a spherical wave radiated from a point source placed at the focus was considered. The wave propagated between the ribs and formed an amplitude-phase distribution of the velocity at the surface of the radiator (Fig. 1). After this distribution was calculated, the phase was inverted and the field was reradiated back to the focus.
In the first method the amplitude-phase distribution at the radiator surface was obtained using geometrical acoustics. Spherically diverging rays from the point harmonic source were considered and the distribution of velocity amplitude in space collinear with the radial coordinate was V = V0F exp (ikr)/r, where k = 2πf/c is the wave number, f is the sound frequency, c is the sound velocity in the media, r is the distance from the point source; r = F on the radiator surface. If a ray connecting the point source with the point of the radiator surface intersected the intercostal space, the velocity amplitude at the radiator surface was set to V =V0eikF; if a ray intersected a rib, the amplitude of the velocity was set equal to zero.
In the second method, diffraction effects were included to set boundary conditions at the radiator. The velocity field of a spherically diverging wave from the point source was calculated in the intercostal spaces in the plane of ribs. This velocity distribution between the ribs was then used as a boundary condition to obtain the distribution of the normal component of the velocity at the surface of the radiator using the Rayleigh integral:
| (1) |
Here Vn (x, y, z) is the component of the velocity normal to the surface of the radiator, , S is the surface where the distribution of normal velocity component V′n (x′, y′, z′) is given (between the ribs), and dS is the spatial element of this surface. Once the velocity distribution Vn (x, y, z) at the radiator surface was obtained, then the phases were inverted and the acoustic field was radiated backward to the focus.
In both the geometric and diffraction methods the pressure distributions in the focal region were calculated in two steps. First, the spatial distribution of the velocity was calculated in the plane of the ribs using the boundary condition at the source and the Rayleigh integral in the form of the Eq. (1). Then the velocity on the ribs was set to zero and pressure amplitude distribution in the focal region, p(x, y, z), was calculated from the velocity distribution between the ribs using another form of the Rayleigh integral:
| (2) |
where ρ is the density of the propagation medium. The intensity distributions in the plane of ribs and in the focal plane were calculated from the distributions of the pressure amplitude in the quasi-plane wave approximation as
| (3) |
where |p| is the pressure amplitude.
Calculations of the power losses on the ribs, peak intensities at the focus, and the power in the focal region within the −6dB contour were compared for the two boundary conditions assuming the same total power transmitted by the radiator.
Acoustic field modeling for 2D phased array in the presence of ribs
In reality, it is not possible to provide an arbitrary pressure or velocity distribution at the surface of a single-element radiator, but multiple element arrays can be used to approximate such a distribution. Therefore, the next problem was to calculate the field of a realistic 2D phased array and compare it with the fields radiated by the idealized source to reveal additional distortions of the field distributions on the ribs and in the focal region due to the discrete structure of the array. Here, as in the previous modeling section, idealized 100% absorbing infinitely thin ribs were considered.
A theoretical method for calculating the acoustic field of an array has been developed previously (Ebbini and Cain 1989, Goss et al. 1996, Gavrilov and Hand 2000, Gavrilov et al. 2000, Filonenko et al. 2004). Here it is generalized for the case when ribs are present. Calculations were performed in the following sequence. First, free field focusing in water was considered. The coordinates of a single focus or several foci were chosen; the distribution of phases of each element of the array was calculated using the pseudo-inverse method to provide a particular focusing configuration and the amplitudes of the elements were equalized (Ebbini and Cain 1991, Gavrilov et al. 2000, Filonenko et al. 2004). Then, the geometric approach was applied to choose which elements of the array to switch off. In the case of a single focus, a set of rays connecting the focus with the centre of each element was considered. If, in the rib plane, the ray intersected the rib, the element was switched off, otherwise it operated with the same phase as without ribs. The amplitude of the operating elements was increased to compensate for inactive elements and to maintain the same power from the array. In the case of several foci, the same procedure was performed for each of the foci. If at least one ray that connected an element with each of the foci intersected the rib, that element was switched off. It is therefore possible for part of an active element to lie in the geometric shadow of one or more ribs, provided that the centre of the element is not in the geometric shadow.
Once the phases and amplitudes of the array elements were set, the pressure distribution was calculated in the plane of ribs by summing the contributions from each operating element modeled as a circular plane piston (Goss et al. 1996, Gavrilov and Hand 2000); then intensity distributions in the focal region were obtained from the pressure distribution between the ribs using the Rayleigh integral. In some of the experiments described later, the ribs were not physically present in the beam path but the array elements were partially switched off. To simulate this case, the intensity distributions in the focal plane were calculated directly by summing the contributions from each element of the array.
Phased array with random distribution of elements
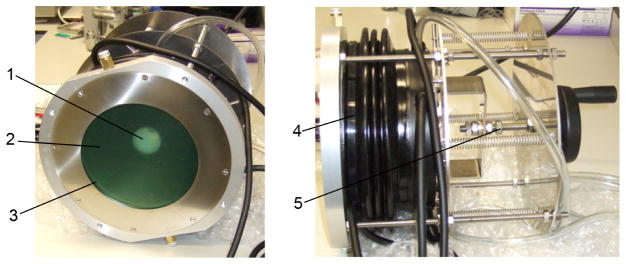
The array consisted of 254 circular elements, each of 7 mm in diameter and 1 MHz operational frequency. The elements were distributed on a spherical surface in a quasi-random manner. The minimum centre-to-centre spacing between the elements was 7.9 mm and the largest spacing was 9.4 mm. A radius of curvature of the spherical shell and its diameter were 130 mm and 170 mm, respectively. A central hole of 40 mm diameter was provided for insertion of an imaging transducer. The active area of the array was about 100 cm2. Front and side views of the array and its holding mechanism that provided adjustment of the position of the array relative to its housing are shown in Fig. 2. The array was developed according to the design and parameters described in previous publications (Hand and Gavrilov 2000, 2002, Gavrilov and Hand 2000) and fabricated from piezocomposite material (Imasonic, Voray sur l’Ognon, France). The housing was also manufactured by Imasonic and was supplied with a 0.15 mm thick membrane made of polycarbonate to separate the array from the medium to be sonicated. The material and thickness of the membrane were chosen as a compromise between acoustical characteristics (to reduce reflections from the membrane) and the mechanical properties (to withstand the weight of a relatively large volume of water). The internal volume of the flexible housing was filled with a temperature controlled degassed water that was circulated using a pump. Further details of the array, its specifications, and results of free field laboratory testing in water are given in Hand et al. (2009).
Figure 2.
HIFU phased array device: front and side views of the array and its holding mechanism that provided adjustment of the position of the array. 1- aperture to mount ultrasound imaging transducer; 2- spherical surface with 254 elements randomly distributed in space; 3- HIFU aperture; 4- flexible housing to contain water bolus, 5 – mechanism to adjust position of the array (2) relative to the housing (4).
Generation and control of RF signals applied to the array elements were provided by a commercially available system (Model 500-013, Advanced Surgical Systems, Inc., Tucson, AZ). The 256 channel system had a power capability of up to 60 W/channel, constrained within a total power of 1800 W and frequency was adjustable from 0.8 to 1.25 MHz. LC impedance matching networks in all channels were designed and fabricated. The operating frequency (1 MHz), phase (0 to 360 degrees in increments of 2.25 degrees) and relative power (8 bit control) of each element were downloaded to the controller from a computer with the use of proprietary software (Large Array Interface v1.2.0.0, Advanced Surgical Systems Inc, Tucson, AZ). Phase and power data for each of the 254 channels were generated using the theoretical data obtained in the modeling to produce and steer a single focus or create patterns of multiple simultaneous foci.
Measurements of acoustic power
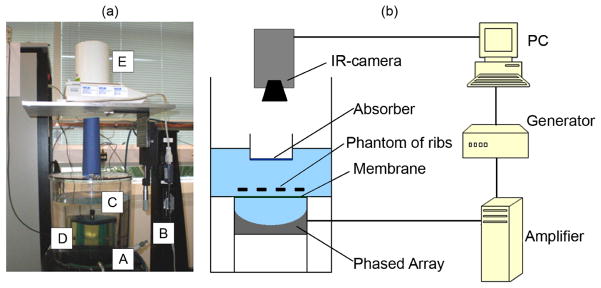
The radiation force balance method with a target containing castor oil (Shaw 2008) was used to measure acoustic power (Fig. 3a). The array and its holding system (A), pointed vertically, were fixed to a frame (B) which also supported a water tank (C) mounted above the array. The oil-filled target (D) was placed in the tank and was suspended from a balance (E) and positioned to intercept the whole of the ultrasound field generated by the array. The maximum electric power applied to the array in these experiments was 490 W, which corresponded to an acoustic power of 250 W.
Figure 3.
Experimental setup: (a) arrangement for ultrasound power measurement; (b) measurement of intensity distributions with the use of IR camera.
Measurements of intensity distributions using infra-red camera
Since a method based on a scanned hydrophone for pressure field mapping would be prohibitively slow taking into account the potentially large number of focusing conditions, a technique based on infra-red (IR) camera measurements was used for rapid assessment of field distributions (Hand et al. 2009). In the current paper, the method is extended to provide estimates of the absolute values of intensity from the measured spatial distributions of temperature.
The method is based on measurements of temperature rises induced in an absorber with known acoustic and thermal parameters by short ultrasonic bursts of 0.1 – 0.3 s duration and relatively low acoustic power of the array (11 W). The low power regime provided conditions of linear acoustic propagation and less than 50°C temperature rise to avoid damage of the calibrated absorber. Short duration sonication was applied to reduce diffusion effects so that the temperature rise is proportional to the intensity.
IR measurements were carried out using a modified ThermoScope® pulsed thermography system (Thermal Wave Imaging Inc., Ferndale, MI) that included a pulsed light source, a Phoenix MWIR 9705 IR camera (FLIR Systems, Boston, MA) and a PC running EchoTherm® v6.4 software (Hand et al. 2009). A diagram of the experimental set-up is shown in Fig. 3b. The ultrasound beam was directed vertically upwards through water onto a thin layer of ultrasonic absorber (Aptflex F28, Precision Acoustics, Dorchester, UK) with a single-pass attenuation coefficient of 6 dB at 1 MHz. The reflection on the water/absorber interface was −25 dB. The other side of the absorber was air-backed (fully reflective to ultrasound) and viewed from above by the IR camera. The distance between the IR camera lens and the absorber was 40 cm, the thermal resolution of the IR image was 5.6 mK.
The infra-red method is primarily a relative method, since results are dependent on acoustic frequency and interference due to reflections from the air interface. Nevertheless, it is desirable to estimate intensity values if possible and a method based on comparison with expected temperature rise calculated from the modelled acoustic field has been implemented. In this method, the heat transfer equation
| (4) |
was solved for the temperature rise T in the absorber layer of l = 1.8 mm thickness whilst
| (5) |
was solved for the temperature rise in the water layer adjacent to the absorber. In equation (4), q(x,y,z) is heat deposition in the absorber layer due to absorption of ultrasound, χ1 = 1.92 × 10⁻⁷ m2 s−1 is the thermal diffusivity, ρ = 1010 kg m−3 is the density of the absorber, Cv = 1800 J kg−1 K−1 is the heat capacity of the absorber. In Eq. (5) χ2 = 1.44·10−7 m2 s−1. Equations 4 and 5 were solved using a finite difference method (Filonenko et al. 2004); the boundary condition at the absorber/air interface was chosen as ∂T∂z= 0 assuming no heat conduction to the air. The layer of water in calculations was assumed to be thick enough so that no temperature rise, T = 0, occurs at the outer boundary of the layer. Heat deposition q(x, y, z) in the absorber, Eq. (4), was calculated using the results of modeling the array field in water, whilst that in water (Eq. (5)) was assumed to be negligible. Reflections from the water/absorber interface were ignored but total reflection from the absorber/air interface was included in modeling the intensity field in the absorber. The acoustic field in the layer thus consisted of the primary wave and reflected wave, with absolute values of intensities that decreased in the direction of propagation due to absorption in the layer, I(x y, z) = Iwater (x, y, z)(exp(−2αz′−exp(−4αl + 2αz′))Heat deposition q(x,y,z) inside the layer is a combination of the absorption of the primary and the reflected wave:
| (6) |
Here α = 346 m−1 is the absorption coefficient in the layer, z′ = z–F+l is the propagation distance inside the layer, z′ = 0 at the water/absorber and z′ = 1.8 mm at the absorber/air interfaces. Calculations of temperature rise were performed with and without accounting for diffusion effects during the period of heating Δt = 0.2 s used in most of the experiments. Nonlinear propagation effects were not included in the calibration procedure as low output levels were used. If diffusion is negligible, then the energy deposition and temperature rise in the absorber are linearly related and the distribution of temperature rise at the surface of the layer is:
| (7) |
If diffusion is included in the calculations, the intensity distributions are not exactly proportional to the temperature change, but simple corrections to the measured temperature distributions can be made. The results of temperature rise modeling in the focal plane accounting for diffusion were related to those that are proportional to the intensity, Eq. (7). A corresponding correction factor between the intensity and temperature was obtained and introduced in the processing of temperature images to determine the intensity distributions Iwater (x, y, F) in the focal plane.
After calibration of intensity measurements, the IR experiments were performed for different operating conditions of the array leading to the production of single or multiple foci beyond the ribs. Two series of measurements were carried out, with and without the rib phantom physically in place in front of the array. In both cases the array was operated with some elements switched off, optimized for the specific configuration of focusing, as if the phantom of ribs was present. The images were taken in the plane of ribs, at the distance z0 from the array, and in the focal plane of the array.
Comparing intensity distributions in the focal plane with and without the phantom, information regarding the losses due to the ribs, even with optimized operation of the elements, was obtained. The decrease of the peak intensity values and the loss of power within −6 dB level in the focal plane were measured for both cases and compared with the theoretical predictions. Similar measurements were carried out also with the porcine rib cages.
Phantoms of ribs and samples of porcine tissues (rib cage and muscle)
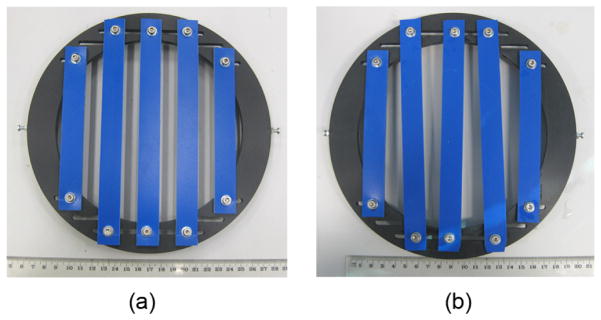
As an experimental model, a rib cage phantom and samples of porcine rib cages were used to simulate HIFU propagation through ribs. The rib phantom was made from absorbing material Aptflex F48 (Precision Acoustics, Dorchester, UK) and consisted of 5 strips each 3 mm thick and 18 mm wide (Fig. 4a,b). The absorbing material had 25 dB total transmission losses at 1 MHz and reflection of about −20 dB (10% reflected amplitude). The spacing between strips in most experiments was 14 mm (Fig. 4a); these dimensions correspond to typical dimensions of ribs and intercostal spaces in the porcine rib cages that were also used in the experiments. Taking into account that real ribs in pigs are not parallel to each other, some experiments were carried out with phantoms having slightly irregular spacing between the strips (Fig. 4b). In this case, the dimensions of the gaps adjacent to the central strip were changed from 11 to 19 mm. In the real porcine samples, the width of the ribs was ~16–20 mm and the distance between them was ~13–16 mm. It is worth noting that, in humans, the spaces between the ribs normally exceed the width of the ribs, which is more favorable for clinical HIFU.
Figure 4.
Photo of the phantom: with parallel (a) and non-parallel strips (b).
The rib phantom (Fig. 4) was positioned in water, at 45 mm from the centre of the array. In experiments with the porcine rib cage it was placed (instead of the phantom) on the plastic ring of inner diameter 15cm; the ring was located 57 mm from the centre of the array. The position of the rib phantom relative to the array was adjusted with the use of IR-technique (see below) or sometimes by observing the height of jet of water at the level of the focal plane due to the action of the radiation force of the HIFU beam. The phase distribution on the array elements was calculated using the specific geometric parameters of each particular phantom or rib cage. A single focus or multiple foci were produced in the focal plane of the array in water behind the phantom or the ribs and intensity distributions in the focal plane were measured using the IR-camera. The ability to steer the focus (or foci) in the focal plane parallel and transversely to the ribs was also investigated.
To demonstrate the feasibility of producing thermally ablated lesions in tissue in the presence of ribs, porcine tissue positioned in the focal region was irradiated through the rib phantom. The plastic ring (inner diameter 10 cm) was placed in water at 1 cm proximally to the focus and the threads were stretched between several points of the ring to position the porcine tissues each 1 cm thick. Lesions in the tissue samples were subsequently observed macroscopically, without special histological analysis.
All porcine soft tissues (muscle) and rib samples used in these experiments were obtained from a butcher’s shop. The soft tissues and rib cages were degassed under vacuum for approximately one hour prior to sonication. The oxygen level in the degassed water in the experimental tank and in the array housing was 0.85 ppm. The ablations were performed in two regimes. In one set of experiments the exposure was constant (20 s) and different acoustic powers were applied (90–140 W). In the second set, the power was constant (120 W) with different exposures (5–15 s).
Thermocouple measurements
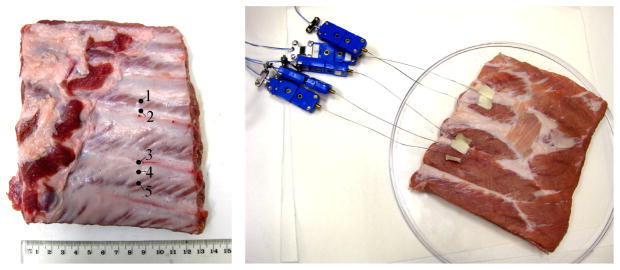
Since water is strongly absorbing to infra-red radiation, it was not possible to observe heating of ribs when the ribs are below the water surface. To monitor temperatures on the ribs and intercostal tissues, measurements were made using five copper-constantan thermocouples with sensitive elements incorporated in a flexible stainless steel sheath 0.5 mm diameter (type TMQSS-IM050-U-150, Omega Engineering, Manchester, UK) (Fig. 5). The thermocouples were inserted inside the tissue at 6 cm from the edge and attached to the surface of the tissue by cyanoacrylate adhesive and sticky tape. Usually one thermocouple was located in an intercostal space, and four others were placed on the ribs. Although this permitted only sparse temperature sensing, the positions of the thermocouples were selected to be close to the hot spots observed on an infra red image, but fine control of alignment was not possible.
Figure 5.
Photo of rib cage with thermocouples located on the ribs (2–5) and in the intercostal spaces (1).
Results and Discussion
Acoustic field modeling for an idealized ultrasound radiator in the presence of ribs
Simulations were performed for the idealized radiator with parameters similar to the phased array used in the experimental studies of this paper, i.e. the aperture a = 170 mm, focal length F = 130 mm and operational frequency f = 1 MHz. Acoustic field distributions were calculated in the plane of the ribs and in the focal plane on an xy rectangular coordinate grid with spatial steps hx = hy = 0.1 mm = λ/15, where λ is the ultrasound wavelength. The spatial windows were −100 mm to +100 mm in both x and y coordinates in the rib plane and −20 mm −20 mm - in the focal plane. Integration over the radiator surface was performed in spherical coordinates; the surface was divided in elevation angle θ into 500 rings with equal step hθ= arcsin(a/2F)/500 and each ring was divided over the azimuth angle ϕ into angular sectors with the step hϕ=2π/(2jθ+1), where jθ is the number of the ring. In this way each element in the integration had the same the area.
To reveal the effect of ribs on ultrasound focusing and to compare the two proposed optimization approaches, simulations were performed for three amplitude-phase distributions of the velocity at the surface of the radiator - namely (1) uniform distribution of the velocity (no optimization), (2) striped distribution obtained with the geometric (ray) approach and (3) nonuniform distribution obtained using the diffraction approach. Simulations were performed with the two optimized boundary conditions with and without the presence of ribs. For simulations in which the ribs were present, the amplitude of the beam at the distal surface of the ribs was set to zero. In preliminary modeling, the ribs were positioned at different distances z0=F/4, F/2, and 3F/4 from the radiator. The results showed that the safest regime with the least loss of power on the ribs occurred for the shortest distance between the plane of ribs and the radiator. This position of the rib plane was chosen for further detailed studies of the field of the idealized radiator. In all simulations the acoustic power of the radiator was W0= 11 W.
The results of modeling are summarized in Table 1. In the case of free field focusing (no ribs) and a uniform distribution of the velocity at the radiator surface the peak intensity in the focal plane in water was 644 W·cm−2 and the beam power within −6 dB level of the main focal peak was W−6dB = 7.2 W or 66% of the initial power. When the ribs were placed in the beam path from the uniform radiator (no optimization) there was a 58% loss of the beam power compared to the free field propagation. This is in line with the relative area of the beam covered by ribs. However, a much larger decrease (a factor of 5.7) was observed in the focal plane for the peak intensity. The underlying reasons for this, partially related to the focus splitting behind the periodic spatial structure of ribs, are discussed in the next section of the paper. The power within −6 dB level of the focal peak also decreased in 5.7 times.
Table 1.
The effect of ribs on ultrasound focusing in the case of an idealized radiator and for acoustic power W0 = 11 W
| power losses on the ribs, W/W0, % | peak intensity, IF, W cm−2 | peak intensity relative to the free field, , % | beam power within −6 dB level of the main focal peak, W−6dB/W0, % | |
|---|---|---|---|---|
| uniform distribution * | 0 | 644 | 100 | 66 |
| uniform distribution † | 58 | 115 | 18 | 11 |
| geometric approach † | 7.5 | 220 | 33 | 22 |
| diffraction approach † | 1 | 270 | 40 | 27 |
free field focusing in water without ribs
focusing through ribs
The distributions of the velocity at the radiator surface and corresponding intensity distributions at the front surface of ribs (z = 45 mm) and in the focal plane (z = 130 mm) obtained using the two approaches are shown in Fig. 6. The ribs were present in the simulations. The left hand column shows results obtained using the diffraction approach, the central column refers to the geometric approach, and the right hand column compares the results of both approaches over the spatial coordinate y perpendicular to the direction of ribs.
Figure 6.
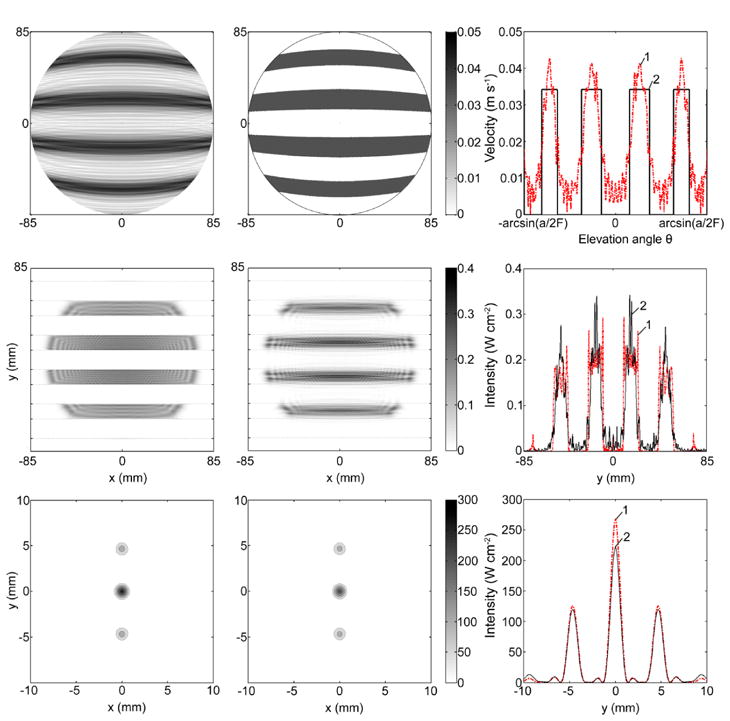
Modeling results for an idealized radiator and infinitely thin fully absorbing ribs. The velocity distribution at the radiator surface (upper row), the intensity distribution in the plane of ribs (central row) and in the focal plane (lower row) obtained using the diffraction (left column) and geometric approaches (central column). The right hand column shows 1D distributions of the corresponding values over the vertical coordinate y perpendicular to the direction of ribs for diffraction (dashed curve 1) and geometric (solid curve 2) approaches.
The distribution of the velocity over the radiator surface (Fig. 6, top row) is presented in spherical coordinates (θ, ϕ) with the elevation angle θ changing from 0 to arcsin(a/2F) and azimuth angle 0<ϕ<2π. For the geometric approach, the distribution consists of step functions while for the diffraction approach, the distribution becomes more irregular. In the shadow regions of the surface, the zero level is achieved only at a few points and higher peaks are present in the distribution as compared to the geometric approach.
Intensity distributions at the front surface of ribs are shown in Fig. 6 (middle row). It is seen that for the diffraction approach the field is clearly concentrated in the intercostal spaces and is relatively uniform, while for the geometrical approach the field on ribs is not equal to zero and has peaks in the centre of the intercostal space.
Intensity distributions in the focal plane are presented in Fig. 6 (bottom row). Peak intensity values and acoustic power within −6 dB level of the main focal lobe are compared in the Table 1. It is seen that the peak intensity and focal power are higher for the diffraction approach than for the geometric one. Both approaches yield about twofold enhancement of the peak intensity and delivery of power to the focus than for sonication through ribs using the uniformly vibrating radiator of the same power.
As shown in the graphs and by quantitative data summarized in Table 1, the diffraction approach provides a more uniform distribution of the intensity between the ribs, significantly less heating of the ribs (1% versus 7.5% power loss), and 23% higher peak intensity at the focus as compared with the geometric approach. The diffraction approach thus offers an advantage in terms of energy incident on the ribs and therefore potential safety. It should be noted that the gain in terms of safety and the higher focal values may be not as high for arrays as they are for the idealized radiator because of the discrete structure and sparseness of arrays. In addition, modulation of the amplitude at the elements along with the restrictions to the maximum output pressures may result in less total power and reduced focal values. Further investigation of these issues needs to be addressed in separate detailed studies. For consistency, in experiments using the array and in the corresponding modeling, the geometric approach was applied to obtain benchmark data. In most of the studies of other transducers (Civale et al. 2006; Liu et al. 2007; Quesson et al. 2009) the geometric method has been used as an initial approach, because it is completely non-invasive and thus attractive for clinical settings.
Focus splitting behind the periodic spatial structure of the ribs
It has been observed in previous studies that the presence of acoustic obstacles similar to ribs in the ultrasound propagation path may cause a splitting of the focus (Li et al. 2007, Liu et al. 2007). This phenomenon is of particular importance in the case of a real-size rib cage and large aperture multiple element phased arrays. The splitting effect when focusing through ribs was present in both modeling and measurements (Tanter et al. 2007, Li et al. 2007, Liu et al. 2007, Aubry et al. 2008), but the physical nature and general properties of this phenomenon were not discussed in detail.
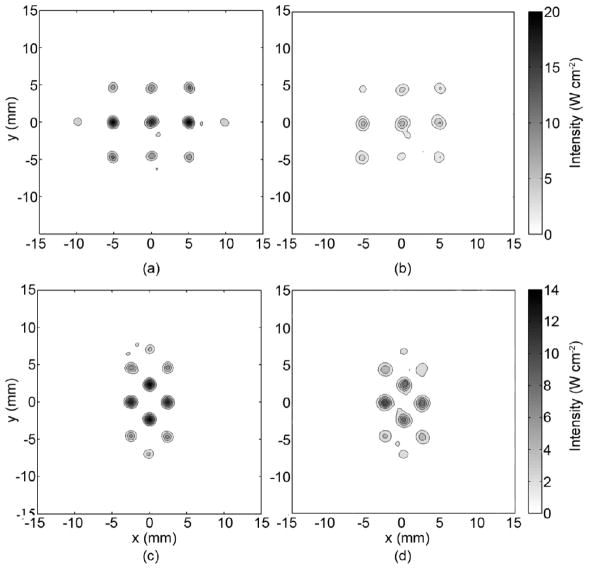
The rib cage serves as a periodic spatial pattern and leads to splitting the focus into three foci (Fig. 6, bottom row). The amplitude level in two side foci is 0.54 and 0.47 of the peak intensity in the main lobe for geometrical and diffraction approaches, respectively. The distance between the main and secondary maxima is 4.7 mm in both cases.
The parameters of splitting the focus can be obtained using the basic results of wave diffraction on a periodic spatial structure [Gorelik 1959, Goodman 2004]. In the case of propagation of a spherically converging wave through a striped grating, the intensity distribution in the focal plane, calculated in the paraxial approximation, is a square of the Fourier transform (spatial spectrum) of the wave amplitude distribution behind the grating. In the direction along the y axis, the intensity distribution is
| (8) |
where λ is the wavelength, d is the size of a rib, b is the intercostal space, F−z0 is the distance from the ribs to the focus, and is the diameter of the beam in the plane of ribs (Fig. 1). Figure 7 illustrates the geometry of splitting. The curves are plotted according to the dimensions of the beam and ribs considered above. The split foci are positioned under the envelope (curve 1), which is the squared sinc function (Eq. (8)) with the width measured between the first nulls Δy = 2λ(F−z0)b. The distance between the adjacent foci is
Figure 7.
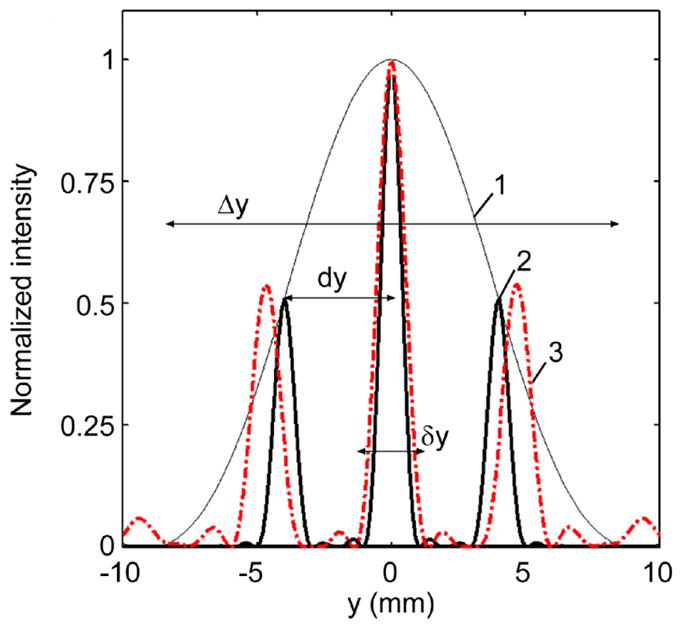
Splitting of a single focus in the focal plane after propagation through the periodic structure of ribs. The analytic solution obtained in paraxial approximation for a spherically converging wave (solid curve 2 within envelope 1) is compared to the results of simulations for the idealized source with a striped amplitude distribution obtained using a geometric approach (Fig. 6) (dashed curve 3).
| (9) |
and the diameter of foci defined between the first nulls is δy = 4λ(F − z0)/πa0. For the rib dimensions considered here b≈(b+d)/2, then Δy≈4dy and the main lobe of the envelope contains three foci, the distance between the adjacent foci is 4 mm, their diameter is 2.2 mm, and the peak intensity in the side foci is 50% of the central one, in good agreement with the simulated distributions for the geometrical approach for the idealized radiator (dashed curve 3) also shown in Fig. 6. When the dimensions of the ribs and intercostal spaces are approximately equal, three foci will always be present when sonicating through the ribs. If the intercostal space is 4 times smaller than the rib, then seven maxima would be observed, whereas if the size of a rib is much smaller than the intercostal space, only one maximum would be formed. The diameter of foci δy is the same as without the ribs; the distance dy between foci depends on the position of the plane of the ribs and their dimensions (Eq. (9)): the closer the ribs are to the transducer or the smaller the centre-to-centre distance is between the ribs, the larger is this separation distance.
Conversion of temperature rise distributions measured using IR-camera to intensity distributions
The results of IR-camera measurements of temperature changes were used as an effective method to obtain spatial distributions and estimates of absolute values of ultrasound intensity in HIFU experiments. Figure 8 shows simulated spatial distributions of temperature rise in the absorber placed in the focal plane of the array. The relative positions of the absorber and adjacent layers of water and air are also indicated in the figure. The distributions are presented in the axial plane that is perpendicular to the direction of the ribs. The upper distribution corresponds to calculations without accounting for diffusion, and the lower figure shows the distribution when diffusion was taken into account. The absorber/air interface (z = F = 130 mm) corresponds to the focal plane of the array. The acoustic power in the simulations was 11 W, the duration of heating was 0.2 s, and the array elements (of which 114 were switched on) were operated as if the ribs were located (but not physically present) at z0 = 45 mm from the radiator.
Figure 8.
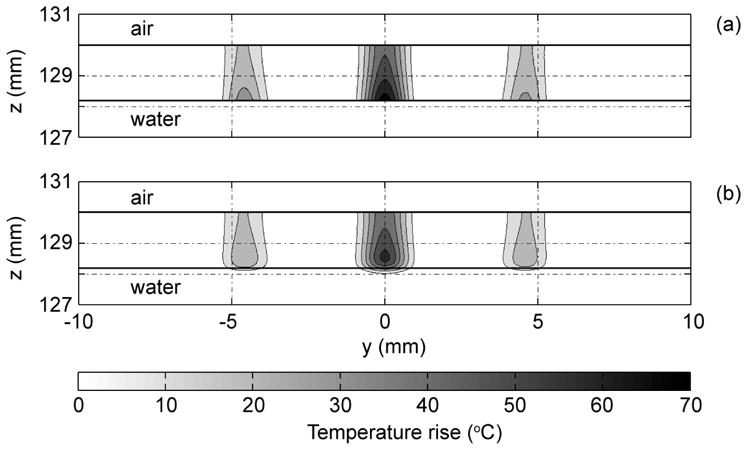
Spatial distributions of temperature rise modeled in the absorber layer, water, and air in the axial plane perpendicular to the direction of ribs. Simulations were performed (a) without and (b) with taking into account diffusion. The contours are given with increments of 10 °C.
In both cases, the distribution of temperature rise inside the absorber is not uniform because of the strong absorption in the layer. The temperature is higher closer to the surface that is in contact with water and lower in the plane of IR measurements, z = F. If diffusion is neglected, the maximum temperature increase occurs at the water/absorber interface, where intensity is the highest (Fig. 8a). If diffusion is included in calculations, the heating moves outward from its maximum, some temperature rise in water is observed, and the maximum of temperature is shifted inside the layer (Fig. 8b). However, no significant change in transverse distribution of temperature due to diffusion is seen.
The simulated temperature rise along the transverse y axis at the absorber/air interface is shown in more detail in Fig. 9 and compared with measurements (dots). The results of modeling were obtained without (curve 1) and with (curve 2) including the diffusion effect in calculations. It is seen that for 0.2 s of heating the peak temperature in the main focal lobe modeled without diffusion (i.e. proportional to intensity) is 13 % higher than the peak temperature modeled with the real diffusion taking place under experimental conditions. The broadening of the main focal lobe due to diffusion is very small for such a short period of time: from 1.40 to 1.47 mm, i.e. only 5%. Here, the width of the lobe is defined at the 1/e level of its maximum. In converting from temperature to intensity this broadening of the beam was neglected and intensity was considered to be proportional to the temperature. However, the correction factor that accounts for 13% lowering of the peak intensity due to diffusion was applied in processing the data. The results of modeling taking the effect of diffusion into account agree well with the measured data within the main focal lobe. Some differences between measured and predicted temperature data can be seen at the side foci (Fig. 9).
Figure 9.
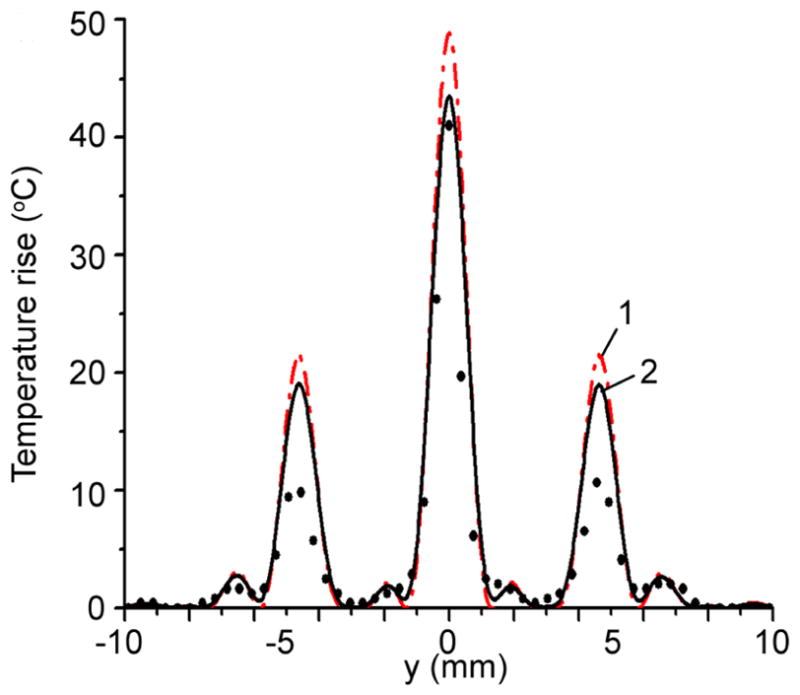
Temperature rise at the absorber/air interface calculated (1) without and (2) with account for diffusion; and measured using IR camera (dots).
The correction factor to convert temperature rise to intensity was defined as the ratio of peak temperatures obtained in simulations without and with accounting for diffusion. If the diffusion is negligible, then free field intensity is related to the temperature rise as in the Eq. (7) (curve 1 Fig. 9):
| (10) |
If the 13% difference of peak temperatures referred to above, Fig. 9, is taken into account, then the Eq. (7) is corrected as:
| (11) |
where the correction coefficient K = 1.13.
This method of calibration was used to recalculate the temperature rise distribution in IR camera images to the intensity distribution when the results of measurements were compared to the intensity distributions obtained in modeling.
Acoustic field modeling and measurements for 2D phased array
Spatial distributions of the field of the phased array were calculated for different positions of the rib plane. Similar to the results obtained for the idealized radiator, it was found that the lowest power losses on the ribs occur when the plane of ribs was closer to the radiator. For example, for the rib plane located at z0=F/4, F/2 and 3F/4 from the array, the power losses on ribs were 20%, 32%, and 42% of the total radiated power, respectively. Because of the specific features of the experimental arrangement, the minimum distance from the phantom of ribs to the array was z0=45 mm, so this position of the rib plane was chosen in all experimental data described below. Moreover, all the results are given for the case when the rib (or a central strip of the phantom) was placed on the array axis. It was found that, at least for this transducer with its central hole, this configuration was more effective than placing an intercostal space on the array axis. In brief, the results for both methods of irradiation were practically the same when creating a single focus and steering it along and off the central axis. However, when several (three or four) foci were generated, the quality of focusing was much better for the first case. The second method of irradiation, however, might be advantageous for other sets of geometric parameters, for example as described by Li et al. (2007).
To compare the quality of focusing when using the array with the case of the ideal radiator (Fig. 6) a single focus was created in the centre of curvature of the array. Array elements were considered to be on or off as follows: if the ray connecting the centre of an element intersected the rib then that element was switched off, otherwise it was on. For this case the number of working elements was 114. Figure 10 shows the distribution of working elements on the array surface; filled circles denote the elements that are switched on, open circles are the disabled elements. The distribution is calculated in spherical coordinates similar to the case of the ideal radiator (Fig. 6). For total acoustic power of the array of W0=11 W, the amplitude of the velocity for each working element was V=0.06 m s−1.
Figure 10.
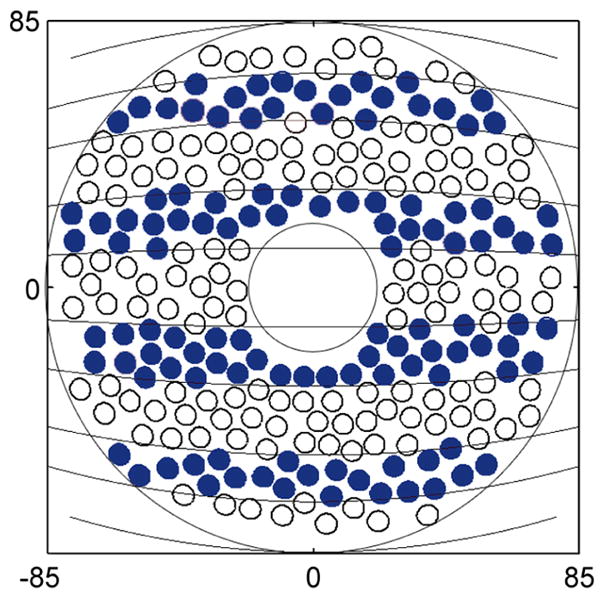
The distribution of working elements at the array surface in spherical coordinates. Filled circles denote the elements which are switched on, open circles are the disabled elements.
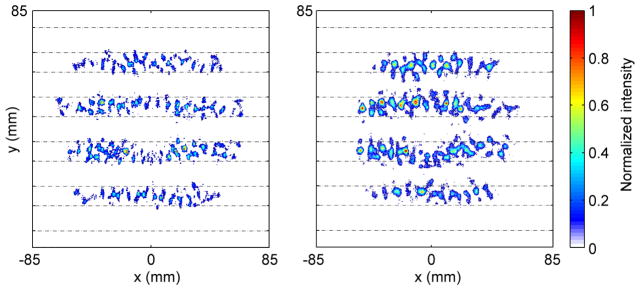
Firstly no ribs were located in the beam path. Figure 11 shows simulated (a) and measured (b) distributions of intensity in the plane of ribs x–y where the phantom was assumed to be located (z0 = 45 mm) for the time of heating t =0.42 s. Since shorter times could not be used because of the low intensity levels in the rib plane and a high level of noise, diffusion effects resulted in broadening of the small size hot spots. Only a qualitative comparison was made between the measured temperature and modeled intensity distributions, each normalized to their maximum values. The dashed lines on the graphs which are parallel to the x-axis show the edges of strips in the ribs phantom. It is seen that the acoustic field distribution is striped and that most hot spots are located between the ribs in both simulations and measurements. Figures 11a and 11b demonstrate reasonable agreement between the theoretical and experimental results, although hot spots in the experimental images (Fig. 11b) are a little bigger than in the calculated distributions due to thermal diffusion (Fig. 11a). A few more hot spots over the ribs are observed in measurements. The appearance of these additional peaks is possibly because diffusion effects were essential to decrease the maximum value of the peaks to which the data are normalized in the experiment. The relatively high noise level in the IR measurements may also result in the appearance of additional spots on the ribs that were far from the focus and where the intensity level was low.
Figure 11.
Calculated (a) and measured (b) intensity distributions for the case when no ribs were located in the beam path. The number of working elements was 114. Distributions are presented in the plane z0 = 45 mm where the rib phantom was supposed to be placed. A single focus was generated at the centre of curvature of the array (0, 0, 130 mm) for acoustic power of 11 W and theat =0.42 s. Each distribution is normalized to its maximum value.
In simulations for the array, the power loss on ribs was 25% of the total power radiated by the array, although for the idealized radiator that value was 7.5% for the geometric approach and only 1% for the diffraction approach (see Table 1). The peak intensity in the plane of the ribs for the array was 1.15 W cm−2, which was two times higher than for ideal radiator. The peak intensity on the ribs (Fig. 11a) in several hot spots was 0.6 W cm−2.
In Fig. 12, the experimental distributions of the temperature rise obtained with the IR-camera are presented without the phantom (a) and with the phantom (b). Figure 12b illustrates the way in which, during experiments, the phantom was aligned with the field irradiated by the array with 114 activated elements. The image of the temperature distribution taken by the IR camera from the thin film absorber (Fig. 12a) was stored and then the absorber film was replaced by the rib phantom and an IR image of the top surface of the phantom was obtained enabling the image of the phantom to be combined with that of the field of the array (Fig. 12a). The overlapping of two images is shown in Fig. 12b. The position of the phantom was then adjusted so as to minimize the hot spots on the ribs.
Figure 12.
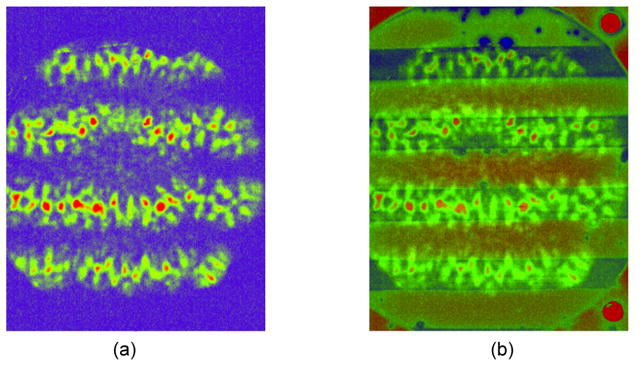
Temperature rise images obtained with the IR-camera without the phantom (a) and with the image of the phantom (b) superposed to illustrate alignment.
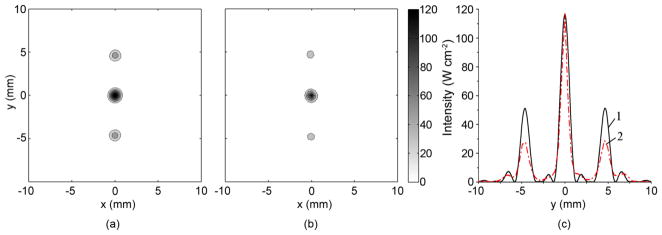
Figure 13 shows (a) simulated and (b) measured intensity distributions in x–y coordinates in the focal plane (z = 130 mm) for the array with some elements switched off; acoustic power of 11 W and time of heating of 0.2 s; here no ribs were present in the beam path. The intensity distributions are presented as contour lines with an increment of 20 W cm−2. Figure 13c shows the 1D intensity distribution along the y-axis at x=0. The level of the secondary foci in experiment was lower than in simulations. The discrepancy is probably caused by relatively high noise level in the IR measurements and simplifying assumptions in the modeling.
Figure 13.
Intensity distributions in the focal plane (z=130 mm) for the partially activated array for a single focus located at (0, 0, 130 mm) without a rib phantom placed in the beam path. (a) predicted intensity distribution; (b) IR measured intensity, (c) 1D distribution of the corresponding quantities over the vertical coordinate y perpendicular to the direction of ribs for theory (curve 1) and experiment (curve 2). The contours in (a,b) are given with increments of 20 W cm−2. Measurements and simulations were carried out for the acoustic power of 11 W and time of heating of 0.2 s.
This particular geometry of focusing was used during the calibration procedure described above, therefore the distributions have the same values of peak intensity. In calculations, the acoustic power within −6 dB level of the main focal peak was 16.7% from the total irradiated power. In the measurements that value was not calculated as only few pixels were located within −6 dB level of the main peak. Similar to the case of an idealized radiator, the triad splitting of the focus caused by the striped pattern of the distribution of activated elements is seen. The distance between the main and side lobes determined by the geometry of stripes is the same as for the idealized radiator: 4.6 mm.
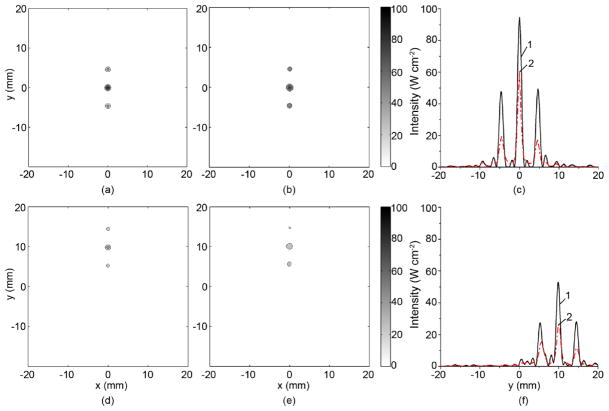
The next series of experiments was carried out under the same conditions as in Fig. 13, but in the presence of the rib phantom. The results are presented in Fig. 14(a–c). Figures 14(a, b) show 2D distributions in the focal plane for theory and experiment, respectively. Fig. 14c is the 1D intensity distribution along the y-axis at x = 0. The physical presence of the ribs, compared to the case without ribs (Fig. 13), leads to a decrease in the peak intensity by 1.2 times in theory and by 1.9 times in experiment. The reasons for this discrepancy may be the finite thickness of the phantom strips and inaccurate phantom alignment compared with that assumed in theory. The accuracy of alignment can be seen qualitatively in Figure 12b: we estimate it to be within +/− 1 mm perpendicular to the ribs and within +/− 2 degrees rotationally. The problem of the finite thickness of real ribs requires further generalization of the model that is outside the scope of this paper. The acoustic power within −6 dB level of the main focal peak with phantom was 13% from the total irradiated power in theory, which is 1.8 times less than for the geometric approach for the idealized radiator where it was 25%.
Figure 14.
Intensity distributions in the focal plane (z=130 mm) in the presence of the phantom for a single focus at (0, 0, 130 mm) – (a, b, c) and (0, 10, 130 mm) – (d,e,f): (a, d) - simulated; (b, e) - measured by IR-method. The contours are given with increments of 10 W cm−2. (c,f) – 1D distributions of the corresponding quantities over the vertical coordinate y perpendicular to the direction of ribs for theory (1) and experiment (2). Measurements were carried out for the acoustic power of 11 W and time of heating of 0.2 s.
Figure 14(d–f) illustrates the possibility of steering a single focus behind the phantom at a distance of at least 10 mm off the array axis without the appearance of grating lobes caused by the multiple element structure of the array. Following the criterion introduced in Gavrilov and Hand (2000) for steering a single focus, the maximum acceptable level for the grating lobes was chosen as 0.1 of the maximum of the focal intensity.
The steering was performed transversely to the strips of the phantom (along the y-axis). As is evident from the figure, because of the steering, the amplitude of the main and side foci becomes lower and the level of the side foci changes. The reason for this is likely to be the same as in the case of steering a single focus without any acoustical obstacles when the amplitude of the steered focus decreases with increased distance of steering.
It is worth noting that it was also possible to steer the focus parallel to the strips (which is an easier case than a previous one) at a distance of 10 mm without significant grating lobes caused by the steering, although a triad splitting of the focus caused by the presence of the ribs, naturally, remains (the data are not presented graphically).
Theoretical simulations and results of experiments showed also that it was possible to steer a single focus along the array axis z at the distance equal to at least ± 20 mm from the center of curvature of the array (z = 130 mm). It was found that the distance between the main and side foci caused by the splitting of the focus increased from 3.7 to 5.6 mm when moving the focus from 110 to 150 mm (the data are not presented on the graphs), as predicted qualitatively by Eq. (9). Electronic scanning of the focus behind the phantom thus makes it possible to irradiate a volume equal to at least 15 cm3 without producing significant grating lobes. Because the main practical application of the method envisaged is ablation of relatively large volumes of tissues, the splitting of the main focus leading to formation of additional foci of smaller amplitude is unlikely to be a problem in practice.
To increase the volume of tissue ablation some authors suggested generating several foci simultaneously (Ebbini, Cain 1989; Daum, Hynynen 1998, 1999). Figure 15(a–d) demonstrates the ability to generate three and four foci behind the phantom. The experimental data were obtained for the powers of 11 W (for 3 foci), 5.8 W (for 4 foci), and heating time of 0.2 s. The main foci correspond to the darkest spots in the figure: three spots with coordinates x and y (−5, 0; 0, 0; 5, 0 mm) in horizontal central line in (a, b) and rectangular central spots with coordinates (−2.5, 0; 2.5, 0; 0, −2.5; 0, 2.5 mm) in (c,d). Triad splitting of each focus in the vertical direction is clearly observed here as in the case of a single focus. It was shown also that it was possible to steer these sets of foci at distances up to at least 10 mm off the axis (these data are not presented graphically). Here, we followed the criterion of 0.3 Imax (Gavrilov and Hand 2000) to estimate an acceptable level for the grating lobes while steering multiple foci.
Figure 15.
Ability to generate three (a, b) and four foci (c, d) behind the phantom. (a, c) - calculated intensity distributions; (b, d) - IR measured intensity in the focal plane (z=130 mm). The contours are given with increments of 2 W cm−2. The data were obtained for the powers of 11 W (for 3 foci) and 5.8 W (for 4 foci) and for the time of heating 0.2 s.
Because real ribs usually are not parallel to each other, some experiments were carried out with an irregular orientation of the strips in the phantom (see Fig. 4b) for the case of acoustic power of 5.8 W and exposure 0.2 s. In the resulting intensity distributions the peak values were for the cases of regular and irregular position of strips, 32 and 23 W cm−2, respectively, and the forms of the intensity distribution were very similar to those presented above, suggesting that non-parallel orientation of the phantom strips did not influence dramatically on the field distribution, provided that the position, sizes and orientation of the ribs is known.
Ablation of ex vivo tissue through the rib phantom
The ability to ablate ex vivo porcine tissue behind the phantom using the method described above was also tested. The ablations presented in Fig. 16 correspond to two set of experiments. In the first set with constant exposure (20 s) the acoustic power was 140, 120 and 90 W (lesions 1–3, respectively). In the second set of experiments with constant power (120 W) the exposures were 15, 10 and 5 s (lesions 4–6, respectively). For the shortest exposure (5 s) used in the experiments, macroscopic tissue discolouration (lesion 6) was observable at an acoustic power of 120 W, but may not be obvious in the photograph. The splitting of the focus is observed in all these cases (see Fig. 16).
Figure 16.
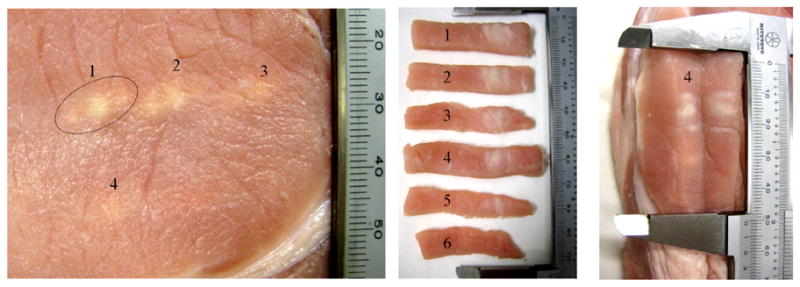
Demonstration of the ability of tissue ablation behind the rib cage phantom. Lesions 1, 2 and 3 correspond to the acoustic power of array 140, 120 and 90 W and exposure 20 s. Lesions 4, 5 and 6 correspond to exposure 15, 10 and 5 s and the acoustic power of array 120 W.
Sonication through a sample of ex vivo rib cage
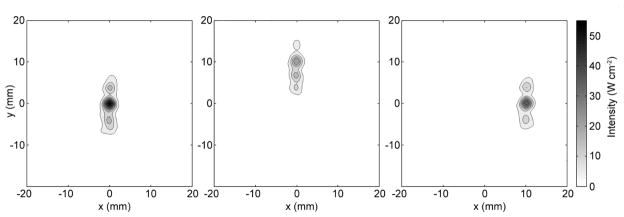
Intensity distributions obtained experimentally when irradiations were performed through the rib cage in water are presented in Fig. 17 for various locations of the focus. The coordinates of the focus were (0, 0, 130 mm; 0, 10, 130 mm; 10, 0, 130 mm), i.e. steering of the focus parallel and transversely to the ribs was used. The acoustic power was 28 W and exposure 0.26 s, the number of working elements was 138. Triad splitting of the focus was observed, but no significant grating lobes were presented in the field of interest. These results indicate the ability to steer electronically the focus behind the rib cage at the distance equal to at least ± 10 mm off the array axis.
Figure 17.
Intensity distributions obtained experimentally for different locations of the focus (0, 0, 130; 10, 0, 130; 0, 10, 130 mm) behind the ex vivo rib cage. The contours are given from 5 W cm−2 with increments of 5 W cm−2.
To obtain additional information on the safety of possible future applications of the proposed method, experiments in which temperatures were monitored by thermocouples were carried out (Fig 5). The coordinates of the focus were (0, 0, 130 mm) and the array was configured for rib-sparing (138 activated elements) as previously described. The acoustic power used in these experiments was 60 W and the exposure duration was 10 s. The temperature rises were measured on the ribs and in the intercostal spaces. The ribs were moved mechanically parallel to themselves to obtain a maximum value at the thermocouple showing the greatest temperature rise. A significant time interval (several minutes) was introduced between each subsequent irradiation of the ribs. The largest temperature rise recorded locally near to a rib was approximately 5°C. For an acoustic power of 30 W, duration of heating 20 s, and parallel movement of the ribs, the maximum value of the temperature rise was 2.5°C. These results suggest that overheating of ribs and tissues proximal to the ribs during future applications of the method could be avoided.
Conclusion
A method for focusing high intensity ultrasound in the presence of ribs was proposed and tested theoretically and experimentally. The method aims to minimize the action of ultrasound on the ribs while maintaining a sufficiently high intensity at the focus (or foci). Two approaches for determining the optimal acoustic field distribution at the radiator surface based on geometric acoustics and including diffraction effects were investigated first for an idealized radiator. It is shown that the diffraction approach provides a 23% gain in peak intensity and results in significantly less power losses on the ribs (1% versus 7.5% of the irradiated power) compared with the geometric one. In experiments using a 2D random phased array and corresponding simulations described here, the geometric approach, which is simple and “non-invasive”, was used as the first step in optimizing the array operation. Array elements located opposite the ribs were switched off and the output from the other elements was increased to maintain the total acoustic power of the array.
Tissue mimicking phantoms and samples of porcine ribs were used as an experimental model. Intensity distributions and absolute values of the intensity in the plane of ribs and in the focal plane were measured using the IR- camera. A method of converting temperature rise distributions measured using the IR-camera to intensity distributions in absolute values was developed and used in both experiments and simulations. Experimentally obtained intensity distributions behind the phantom and the rib cages were compared with theoretical predictions and good correlation between them was obtained.
The effect of the splitting of a single focus (or several foci) caused by the periodic structure of the ribs was predicted theoretically and confirmed experimentally. It was shown, that if the dimensions of ribs and intercostal spaces are approximately equal, a triad splitting of the focus always occurs when sonicating through the ribs. The splitting effect leads to a significant decrease of the focusing gain of the transducer; as predicted in the modeling, the total power in each of side foci is about 50% of that in the main focus. In measurements, the levels of grating lobes were lower (25% – 50%). The parameters of splitting, i.e. the number of side foci, the diameter of the foci, and the spacing between them can be estimated analytically based on the rib cage dimensions, transducer parameters, and the position of the ribs relative to the transducer. Larger number of side foci is observed if the intercostal space is smaller than the rib size; the diameter of each foci is equal to the diameter of the main focal lobe without ribs; the separation distance between the foci is larger when the ribs are located closer to the transducer or if the centre-to-centre distance between the ribs is smaller. Focus splitting and the corresponding decrease of the power delivered to the main focus along with spreading of energy deposition needs to be addressed when planning treatments through the ribs; in some cases, for example when the dimensions of the targeted volume are small compared with the distance between secondary foci, this phenomenon may be a limiting factor.
The results of experiments showed that it was possible to provide an appropriate quality of focusing in the media behind the ribs, for the case of generation of a single focus and several (3–4) foci and their steering at ± 10–15 mm off the array axis and at least ± 20 mm along the axis. The level of secondary maxima in the acoustic fields with the steering of a single focus did not exceed 10% of the maximum values excluding, naturally, the triad focus (foci) splitting. The ablations in tissues were observed in samples of ex vivo porcine tissue, located beyond the rib phantom, for acoustic power of 90–140 W and durations > 5 s.
Temperature rise in tissues near the bones and in the intercostal spaces was measured using thermocouples. Temperature rise measurements on a rib surface confirmed the absence of dangerous overheating of the tissues. Thus, theoretical and experimental investigations demonstrate the feasibility of the proposed approach of minimizing the field on ribs while maintaining high focal intensities sufficient to produce tissue ablations in tissues behind the ribs.
The ability to ablate tissues through the phantom and maintain an appropriate quality of the field distribution beyond the ribs ex vivo provides strong evidence that the technique has the potential for addressing a major problem in clinical HIFU - that of ablating tissue underlying the ribs without overheating the ribs and overlying tissue. Practical application of the method will require integration of a means of imaging the ribs (CT, MRI, or ultrasound), operating the array in alternate therapy and imaging modes, or using the recently proposed DORT method (Cochard et al. 2009) to optimize the number and location of activated array elements and the phases of driving signals applied to them.
Acknowledgments
The authors are grateful to Neelaksh Sadhoo for assistance with the infra-red measurements and to Drs Oleg Sapozhnikov, Lawrence Crum, Michael Bailey, and Bajram Zeqiri for useful discussions of this work and editorial comments. The work was supported in parts by Cancer Research UK C18509/A78, NIHR Biomedical Research Centre funding, the National Measurement Systems Directorate of the UK Department of Business, Innovation and Skills, INTAS 05-1000008-7841, Russian Foundation for Basic Research 09-02-00066 and 09-02-01530, and NIH R01EB007643.
Footnotes
Publisher's Disclaimer: This is a PDF file of an unedited manuscript that has been accepted for publication. As a service to our customers we are providing this early version of the manuscript. The manuscript will undergo copyediting, typesetting, and review of the resulting proof before it is published in its final citable form. Please note that during the production process errors may be discovered which could affect the content, and all legal disclaimers that apply to the journal pertain.
References
- Aubry J-F, Pernot M, Marquet F, Tanter M, Fink M. Transcostal high-intensity-focused ultrasound: ex vivo adaptive focusing feasibility study. Phys Med Biol. 2008;53:2937–2951. doi: 10.1088/0031-9155/53/11/012. [DOI] [PMC free article] [PubMed] [Google Scholar]
- Botros YY, Ebbini ES, Volakis JL. Two-step hybrid virtual array-ray (VAR) technique for focusing through the rib cage. IEEE Trans Ultrason Ferroelectr Freq Control. 1998;45(4):989–999. doi: 10.1109/58.710577. [DOI] [PubMed] [Google Scholar]
- Civale J, Clarke R, Rivens I, ter Haar G. The use of a segmented transducer for rib sparing in HIFU treatments. Ultrasound Med Biol. 2006;32(11):1753–61. doi: 10.1016/j.ultrasmedbio.2006.06.005. [DOI] [PubMed] [Google Scholar]
- Cochard E, Prada C, Aubry JF, Fink M. Ultrasonic focusing through the ribs using the DORT method. Med Phys. 2009;36(8):3495–3503. doi: 10.1118/1.3159755. [DOI] [PubMed] [Google Scholar]
- Daum DR, Hynynen K. Thermal dose optimization via temporal switching in ultrasound surgery. IEEE Trans Ultrason Ferroelectr Freq Ctrl. 1998;45(1):208–215. doi: 10.1109/58.646926. [DOI] [PubMed] [Google Scholar]
- Daum DR, Hynynen K. A 256-element ultrasonic phased array system for the treatment of large volumes of deep seated tissue. IEEE Trans Ultrason Ferroelectr Freq Ctrl. 1999;46(5):1254–1268. doi: 10.1109/58.796130. [DOI] [PubMed] [Google Scholar]
- Ebbini ES, Cain CA. Multiple-focus ultrasound phased array pattern synthesis: Optimal driving signal distributions for hyperthermia. IEEE Trans Ultrason Ferroelectr Freq Contr. 1989;36(5):540–548. doi: 10.1109/58.31798. [DOI] [PubMed] [Google Scholar]
- Ebbini ES, Cain CA. A spherical-section ultrasound phased-array applicator for deep localized hyperthermia. IEEE Trans Biomed Eng. 1991;38(7):634–643. doi: 10.1109/10.83562. [DOI] [PubMed] [Google Scholar]
- Filonenko EA, Gavrilov LR, Khokhlova VA, Hand JW. Heating of biological tissues by two-dimensional phased arrays with random and regular element distributions. Acoustical Physics. 2004;50(2):222–231. [Google Scholar]
- Gavrilov LR, Hand JW. A theoretical assessment of the relative performance of spherical phased arrays for ultrasound surgery. IEEE Trans Ultrason Ferroelectr Freq Ctrl. 2000;47(1):125–139. doi: 10.1109/58.818755. [DOI] [PubMed] [Google Scholar]
- Gavrilov LR, Hand JW, Yushina IG. Two-dimensional phased arrays for application in surgery: scanning by several focuses. Acoustical Physics. 2000;46(5):551–558. [Google Scholar]
- Goodman JW. Introduction to Fourier Optics. 3. Roberts & Company Publishers; 2004. p. 103. [Google Scholar]
- Gorelik GS. Introductions to Acoustics, Radiophysics and Optics. Moscow: Fizmatlit; 1959. Oscillations and Waves. (in Russian) [Google Scholar]
- Goss SA, Frizell LA, Kouzmanoff JT, Barich JM, Yang JM. Sparse random ultrasound phased array for focal surgery. IEEE Trans Ultrason Ferroelectr Freq Ctrl. 1996;43(6):1111–1121. [Google Scholar]
- Hand JW, Gavrilov LR. Ultrasound transducer array. GB2347043A. GB patent. 2000 August December 23;
- Hand JW, Gavrilov LR. Arrays of quasi-randomly distributed ultrasound transducers. 6488630. US patent. 2002 December 03;
- Hand JW, Shaw A, Sadhoo N, Dickinson RJ, Gavrilov LR. Initial testing of a prototype phased array device for delivery of High Intensity Focused Ultrasound (HIFU) Phys Med Biol. 2009;54:5675–5693. doi: 10.1088/0031-9155/54/19/002. [DOI] [PubMed] [Google Scholar]
- Li F, Gong X, Hu K, Li C, Wang Z. Effect of ribs in HIFU beam path on formation of coagulative necrosis in goat liver. Therapeutic Ultrasound: 5th International Symposium on Therapeutic Ultrasound; 2006. [Google Scholar]
- Li J-L, Liu X-Zh, Zhang D, Gong X-F. Influence of ribs on nonlinear sound field of therapeutic ultrasound. Ultrasound Med Biol. 2007;33(9):1413–20. doi: 10.1016/j.ultrasmedbio.2007.05.001. [DOI] [PubMed] [Google Scholar]
- Liu H-Li, Chang H, Chen W-S, Shih T-C, Hsiao J-K, Lin W-L. Feasibility of transrib focused ultrasound thermal ablation for liver tumors using a spherically curved 2D array: A numerical study. Med Phys. 2007;34(9):3436–3448. doi: 10.1118/1.2759888. [DOI] [PubMed] [Google Scholar]
- Ocheltree K, Frizzell L. Sound field calculations for rectangular sources. IEEE Trans Ultrason Ferroelectr Freq Contr. 1989;36(2):242–248. doi: 10.1109/58.19157. [DOI] [PubMed] [Google Scholar]
- Pernot M, Aubry JF, Tanter M, Thomas JL, Fink M. High power transcranial beam steering for ultrasonic brain therapy. Phys Med Biol. 2003;48:2577–2589. doi: 10.1109/TMI.2010.2076829. [DOI] [PMC free article] [PubMed] [Google Scholar]
- Quesson B, Merle M, Roujol S, Kohler M, Denis de Senneville B, Moonen C. Inter-costal liver ablation under real-time MR-thermometry with partial activation of a HIFU phased array transducer. Program of the 9th International Symposium on Therapeutic Ultrasound; 23–26 September 2009; Aix-En-Provence, France. p. 9. [Google Scholar]
- Shaw A. A buoyancy method for the measurement of total ultrasound power generated by HIFU transducers. Ultrasound Med Biol. 2008;34(8):1327–1342. doi: 10.1016/j.ultrasmedbio.2008.01.008. [DOI] [PubMed] [Google Scholar]
- Tanter M, Pernot M, Aubry JF, Montaldo G, Marquet F, Fink M. Compensating for bone interfaces and respiratory motion in high intensity focused ultrasound. Int J Hyperthermia. 2007;23(2):141–151. doi: 10.1080/02656730701209996. [DOI] [PubMed] [Google Scholar]
- Wu F, Zhi-Biao W, Wen-Zhi C, Hui Z, Jin B, Jian-Zhong Z, Ke-Quan L, Cheng-Bing J, Fang-Lin X, Hai-Bing S. Extracorporeal high intensity focused ultrasound ablation in the treatment of patients with large hepatocellular carcinoma. Ann Surg Oncol. 2004;11:1061–1069. doi: 10.1245/ASO.2004.02.026. [DOI] [PubMed] [Google Scholar]


