Abstract
Three new ligands of general formula [RNHCH(py)2] (py = pyridine, R = tosyl, Ts-dpm; R = dansyl, Ds-dpm; R = 7-nitro-1,2,3-benzoxadiazole, NBD-dpm) have been synthesized and characterized. Reactions of these ligands with cis-[Pt(DMSO)2Cl2] (DMSO = dimethyl sulfoxide) in methanol affords [Pt(Ts-dpm)Cl2] (1), [Pt(Ds-dpm)Cl2] (2), and [Pt(NBD-dpm)Cl2] (3). The crystal structures of these complexes reveal bidentate coordination of the ligands to the Pt center with nonplanar chelate rings. Because of inequivalent substituents on the methine carbon atom of the ligands, distinct exo and endo isomers exist in the three complexes. X-ray analyses indicate that 1 crystallizes in the endo conformation, 2 in the exo conformation, and 3 as a mixture of the two conformers. The 1H NMR and 195Pt NMR spectra of the complexes display two sets of independent signals corresponding to the chemically inequivalent exo and endo conformers. The exo conformer was determined by 2D NMR spectroscopy to be thermodynamically favored for all three complexes. Density functional theory (DFT), time-dependent DFT (TDDFT), and atoms in molecules (AIM) calculations were carried out for both conformers of 3 to investigate differences in their electronic structures and to explore intramolecular interactions. In the presence of dioxygen, 1 thermally decomposes at 60 °C to form several unidentified products. Compound 2 is thermally stable even in the presence of dioxygen and water, but upon light exposure decomposes to form a new Pt(II) species with a 195Pt NMR shift of −2177 ppm. Compound 3 reacts both thermally and photochemically in the presence of dioxygen and trace amounts of water to form both 4-amino-7-nitro-2,1,3-benzoxadiazole (NBD-NH2) and [Pt(dpk)Cl2] (dpk = di-2-pyridylketone). Oxidation of 1 and 3 with H2O2 in acetic acid affords a mixture of compounds, two of which contain dpm ligands bound in a tridentate manner to platinum.
Introduction
Cisplatin, cis-diamminedichloroplatinum(II),1–4 was approved by the FDA in 1978 for the treatment of testicular and bladder cancer. It has since proved to be an extremely effective anticancer agent and is used commonly worldwide. Despite its high cure rates, cisplatin induces a number of side effects which include nephrotoxicity, nausea, and neurotoxicity.5–8 Diminishing these negative side effects has been a driving force in the search for new, less toxic platinum therapeutics.
Studies of cisplatin and its mechanisms of activity and toxicity have unveiled new fundamental aspects of platinum coordination chemistry.9,10 For example, the structure and characterization of the platinum blues and related complexes11–13 resulted from interest in the therapeutic potential of such compounds. More recently, new platinum chemistry has been developed to access previously unavailable compounds with enhanced toxicity and selectivity for cancer cells. In designing light-activated Pt complexes, chemists have demonstrated interesting photoreactivity of Pt(IV) azido units.14,15 In our lab, we expanded upon previously known outer-sphere carboxylation reactions of Pt(IV)-hydroxo complexes16 to devise convenient methods for covalently tethering cisplatin to estrogen,17 peptides,18 carbon nano-tubes,19,20 and gold nanoparticles21 in order to increase selectivity for, and cellular uptake by, cancer cells.
The development of fluorescent cisplatin analogues22 for use in cellular imaging studies has also provided a new opportunity to explore fundamental platinum chemistry. Several platinum complexes containing fluorescent ligands have been synthesized by us23 and by others.24–30 Apart from being easily visualized with fluorescence microscopy, some of these compounds exhibit interesting fundamental properties. When coumarin analogues were used as ligands for platinum,29 the fluorescence-quenching capabilities of the complexes depended both on the oxidation state of the platinum atom and the nature of the ligand. Platinum complexes containing fluorescent anthracene derivatives as ligands28 adopt a novel bidentate mode achieved through coordination of the nitrogen atom of a pyridine ring and a carbon-carbon double bond. Intrinsically fluorescent complexes containing bile acid derivatives as ligands have also been investigated.31,32
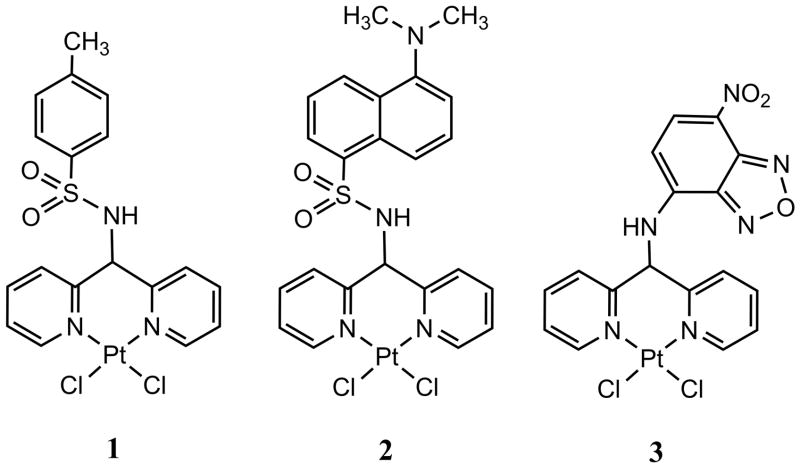
In the present study we have explored three derivatives of di-(2-pyridyl)methane (dpm)33–35 modified either with the non-fluorescent tosyl group (Ts-dpm) or the fluorescent dansyl (Ds-dpm) or 7-nitro-1,2,3-benzoxadiazole group (NBD-dpm). Our choice of dpm derivatives was motivated by two considerations. First, the starting material for preparing these ligands, 2-(di-2-pyridyl)methanamine, is readily functionalized with number of commercially available fluorescent groups.36 As such it is possible to tune the hydrophobicity and photophysical properties by choice of fluorophore. The fluorescent properties of the ligands offer the potential to track the cellular distribution of the platinum complexes. We were also motivated by reports in the literature of platinum complexes with similar dpm-based ligands that exhibit significant cytotoxic properties.37–39 We anticipated that the fluorophore-modified ligands described here would similarly confer cytotoxic properties to Pt. In this article we describe the synthesis and physical characterization of the platinum complexes 1 – 3 (Chart 1). In addition to characterization in the solid state by X-ray crystallography and in solution by 195Pt and 1H NMR spectroscopy, we have investigated the photophysical properties of these complexes and their ligands. The results are analyzed with the aid of TDDFT calculations performed for 3. Complexes 1 – 3 are thermally and photochemically reactive. The implications of this chemistry for the development of light- or heat-activated platinum prodrugs are discussed. Preliminary oxidative reactions of these complexes have been explored.
Chart 1.
Experimental Section
General Considerations
Di-2-pyridylmethanamine was prepared from commercially available di-2-pyridyl ketone by a reported method.40 K2PtCl4, purchased from Strem Chemicals, was used to prepare cis-[Pt(DMSO)2Cl2].41 [Pt(dpk)Cl2]42 and NBD-NH243 were also prepared by literature procedures. Other reagents were used as received from commercial vendors. Methanol (MeOH) and acetonitrile (CH3CN) were used without prior degassing or drying. Tetrahydrofuran (THF) was saturated with argon and purified by passage over two columns of Al2O3 prior to use.
N-(Di-2-pyridylmethyl)tosylamide (Ts-dpm)
To a mixture of di-2-pyridylmethanamine (0.706 g, 3.80 mmol) and Na2CO3 (1.21 g, 11.4 mmol) in 25 mL of CH3CN was added dropwise a solution of to-syl chloride (0.703 g, 3.70 mmol) in 5 mL of CH3CN. The resulting mixture was stirred at room temperature for 12 h and then filtered. The colorless filtrate was concentrated in vacuo to a volume of approximately 10 mL at which point Ts-dpm separated from solution as a white crystalline solid. This solid was collected by vacuum filtration. An additional crop was collected by further concentration of the filtrate to yield 0.551 g (44 %) of Ts-dpm. Mp: 143 – 144 °C. 1H NMR (400 MHz, CDCl3): δ (ppm) 8.41 (2H, d, J = 4.7 Hz), 7.59 (2H, d, J = 8.0 Hz), 7.50 (2H, t, J = 7.6 Hz), 7.28 (3H, m), 7.08 (4H, m), 5.68 (1H, d, J = 5.8 Hz), 2.28 (3H, s). 13C NMR (400 MHz, CDCl3): δ (ppm) 158.1, 148.9, 143.2, 137.1, 137.0, 129.5, 127.4, 122.8, 122.3, 62.1, 21.6. ESI-MS: m/z 340.0 [M+H]+, 338.0 [M-H]−. Anal. Calcd for Ts-dpm, C18H17N3O2S: C, 63.70; H, 5.05; N, 12.38. Found: C, 63.71; H, 5.06; N, 12.55.
N-(Di-2-pyridylmethyl)dansylamide (Ds-dpm)
To a mixture of dansyl chloride (3.60 g, 13.4 mmol) and Na2CO3 (7.10 g, 67.0 mmol) in 20 mL of CH3CN was added dropwise di-2-pyridylmethanamine (2.75 g, 14.8 mmol) in 5 mL of CH3CN. The resulting mixture was stirred at room temperature for 12 h and then filtered. The orange filtrate was concentrated to dryness under vacuum to give a thick oil, which was purified by silica gel column chromatography eluting with 9:1 CH2Cl2: MeOH. After chromatography, the product was initially obtained as a thick yellow-green oil. Upon recrystallization with 1:1 MeOH:Et2O, pure Ds-dpm was obtained as a pale yellow crystalline solid (4.20 g, 75 %). Mp: 101 – 104 °C. 1H NMR (400 MHz, CDCl3): δ (ppm) 8.34 (1H, dt, J = 8.7 Hz, J = 0.8 Hz), 8.30 (1H, dt, J = 8.4 Hz, J = 1.0 Hz), 8.23 (2H, m), 8.12 (1H, dd, J = 7.3 Hz, J = 1.3 Hz), 7.50 (1H, app t), 7.40 (1H, d, J = 6.5 Hz), 7.34 – 7.30 (3H, m), 7.11 (2H, d, J = 7.2 Hz), 7.07 (1H, dd, J = 7.32 Hz, J = 0.8 Hz), 6.93 – 6.90 (2H, m), 5.57 (1H, d, J = 6.5 Hz), 2.78 (6H, s). 13C NMR (400 MHz, CDCl3): δ (ppm) 157.8, 151.7, 148.7, 136.6, 134.9, 130.3, 130.0, 129.64, 129.62, 128.3, 123.1, 122.5, 122.0, 119.5, 115.1, 62.5, 45.6. ESI-MS: m/z 419.1 [M+H]+, 441.0 [M+Na]+, 859.2 [2M+Na]+. Anal. Calcd for Ds-dpm, C23H22N4O2S: C, 66.01; H, 5.30; N, 13.39. Found: C, 65.80; H, 5.16; N, 13.44.
N-(Di-2-pyridylmethyl)-7-nitro-2,1,3-benzoxadiazole-4-amine (NBD-dpm)
To a mixture of di-2-pyridylmethanamine (0.802 g, 4.33 mmol) and K2CO3 (3.00 g, 22.0 mmol) in 15 mL of THF was added dropwise a 10 mL THF solution of 4-chloro-7-nitro-2,1,3-benzoxadiazole (NBD-Cl) (0.900 g, 4.50 mmol). The mixture was stirred at room temperature for 12 h and then filtered. The dark brown filtrate was concentrated to dryness in vacuo and the resulting residue was partitioned between 50 mL of CH2Cl2 and 50 mL of 1 M HCl. The organic layer was separated and the aqueous layer was further extracted with two 25 mL portions of CH2Cl2. The organics were combined, washed with 50 mL of saturated NaCl, and dried with MgSO4. Pure NBD-dpm was obtained after silica gel chromatography (5 % MeOH in CH2Cl2) as a brown solid (0.714 g, 46 %). Mp: 188 – 192 °C (dec). 1H NMR (400 MHz, CDCl3): δ (ppm) 9.15 (1H, bs), 8.65 (2H, d, J = 4.8 Hz), 8.35 (1H, d, J = 8.6 Hz), 7.65 (2H, t, J = 7.7 Hz), 7.40 (2H, d, J = 7.9 Hz), 7.26 (2H, t, J = 6.1 Hz, overlaps with residual CHCl3 peak), 6.13 (1H, d, J = 8.6 Hz), 6.02 (1H, bs). 13C NMR (400 MHz, CDCl3): δ (ppm) 157.1, 149.4, 144.8, 144.1, 142.5, 137.9, 136.5, 124.7, 123.7, 122.0, 100.9, 63.2. ESI-MS: m/z 349.1 [M+H]+, 370.9 [M+Na]+, 718.8 [2M+Na]+. Anal. Calcd for NBD-dpm, C17H12N6O3: C, 58.62; H, 3.47; N, 24.13. Found: C, 58.13; H, 3.44; N, 24.02.
[Pt(Ts-dpm)Cl2] (1)
Ts-dpm (0.270 g, 0.800 mmol) in 10 mL of MeOH was added to a suspension of cis-[Pt(DMSO)2Cl2] (0.330 g, 0.780 mmol) in 10 mL of MeOH. After stirring for 12 h at room temperature, the reaction mixture was filtered to collect 1 as a white solid. The solid was washed sequentially with 10 mL of MeOH and 10 mL of Et2O before being dried in vacuo to obtain 0.417 g (88 %) of 1. 1H NMR (400 MHz, DMF-d7): δ (ppm), endo conformer: 9.54 (1H, d, NH), 9.23 (2H, d), 8.13 (2H, t), 7.90 (2H, d), 7.60 (2H, t, overlapped by exo conformer peaks), 7.78 (2H, d), 7.34 (2H, d, overlapped by exo conformer peaks), 6.15 (1H, d, py2CHNHR), 2.39 (3H, s, CH3). δ (ppm), exo conformer: 10.15 (1H, d, NH), 9.13 (2H, d), 8.19 (2H, t), 7.87 – 7.84 (4H, m), 7.60 (2H, t), 7.36 (2H, d), 6.79 (1H, d, py2CHNHR), 2.34 (3H, s, CH3). 195Pt NMR (400 MHz, DMF-d7): δ (ppm) −2082 (endo), −2198 (exo). ESI-MS: m/z 603.9 [M]−. Anal. Calcd for 1, C18H17Cl2N3O2SPt: C, 35.71; H, 2.83; N, 6.94. Found: C, 35.71; H, 2.87; N, 6.96.
[Pt(Ds-dpm)Cl2] (2)
By following the procedure described for 1 using 1.14 g (2.69 mmol) of cis-[Pt(DMSO)2Cl2] and 1.50 g (3.58 mmol) of Ds-dpm, 2 was obtained as a yellow solid (1.75 g, 95 %). 1H NMR (400 MHz, DMF-d7): δ (ppm), exo + endo: 10.40 (d, NH, exo), 9.65 (d, NH, endo), 9.14 (d, ortho-py, endo), 9.08 (d, ortho-py, exo), 8.62 (d, exo), 8.53 (d, endo), 8.47 (d, exo), 8.36 (d, exo), 8.20 (d, endo), 8.02 – 7.98 (m, exo + endo), 7,75 – 7.48 (m, exo + endo), 7.29 (d, exo), 7.18 (d, endo), 6.82 (d, py2CHNHR, exo), 6.30 (d, py2CHNHR, endo), 2.85 (s, N(CH3)2, endo), 2.83 (s, N(CH3)2), exo). 195Pt NMR (400 MHz, DMF-d7): δ (ppm) −2105 (endo), −2199 (exo). ESI-MS: m/z 682.8 [M-H]−. Anal. Calcd for 2, C23H22Cl2N4O2SPt: C, 40.36; H, 3.24; N, 8.19. Found: C, 40.40; H, 3.36; N, 8.30.
[Pt(NBD-dpm)Cl2] (3)
By following the procedure described for 1 using 0.106 g (0.250 mmol) of cis-[Pt(DMSO)2Cl2] and 0.100 g (0.290 mmol) of NBD-dpm, 3 was obtained as an orange-brown solid (0.109 g, 71 %). 1H NMR (400 MHz, DMF-d7): δ (ppm), endo conformer: 10.40 (1H, d, NH), 9.31 (2H, d), 8.63 (1H, d), 8.40 – 8.35 (4H, m), 7.73 (2H, t), 7.17 (1H, d, py2CHNHR), 7.00 (1H, d). δ (ppm), exo conformer: 10.44 (1H, d, NH), 9.28 (2H, d), 8.77 (1H, d), 8.31 (2H, t), 8.18 (2H, d), 7.70 (2H, t), 7.60 (1H, br, py2CHNHR), 7.13 (1H, d). 195Pt NMR (400 MHz, DMF-d7): δ (ppm) −2057 (endo), −2196 (exo). ESI-MS: m/z 612.8 [M]−. Anal. Calcd for 3, C17H12Cl2N6O3Pt: C, 33.24; H, 1.97; N, 13.68. Found: C, 33.28; H, 2.04; N, 13.44.
Oxidation Chemistry of 1
To a suspension of 1 (0.050 g, 0.083 mmol) in 10 mL of glacial acetic acid was added 30 % H2O2 (66 μL, 0.58 mmol). The resulting suspension was stirred at room temperature for 12 h and then filtered to collect 0.029 g of an off-white solid, which was washed with 10 mL of Et2O. The 1H NMR spectrum of this material freshly dissolved in DMSO-d6 revealed the presence of single compound formulated to be the Cs-symmetric meso-[Pt(κ3-Ts-dpm)Cl2(OH)], a result inconsistent with the lack of symmetry observed in the isolated crystal, 1ox. After several days standing in solution the 1H NMR spectrum revealed the presence of at least two different compounds (Figure S1, Supporting Information).
Oxidation Chemistry of 3
To an orange suspension of 3 (0.020 g, 0.043 mmol) in 5 mL of glacial acetic acid was added 30 % H2O2 (34 μL, 0.30 mmol). After stirring at room temperature for 12 h, the acetic acid was removed under reduced pressure from the resulting red suspension. A 10 mL portion of Et2O was added to the red residue and the dark-red solid that resulted was collected by filtration and washed with 20 mL of Et2O. The yield was 0.022 g. The 1H NMR spectrum of this material indicated the presence of at least two different compounds (Figure S2). No attempts were made to isolate and characterize these compounds.
Thermal and Photochemical Reactions
Photochemical reactions were performed using a 1000 W high-pressure Hg/Xe arc lamp (Oriel). Compounds 2 and 3 were irradiated in standard borosilicate NMR tubes. Due to the low absorptivity of 1 in the visible region, it was irradiated in a quartz NMR tube to allow better UV light penetration. Thermal reactions were conducted by placing NMR tubes covered with aluminum foil in a temperature-controlled oil bath. The temperature was maintained between 60 and 65 °C. Dioxygen- and water-free samples were prepared in a nitrogen-filled glovebox with DMF-d7 that had been dried over 4 Å molecular sieves for 48 h. NMR tubes were sealed with rubber septa and electrical tape.
Physical Measurements
NMR measurements were recorded on a Bruker DPX-400 spectrometer in the MIT Department of Chemistry Instrumentation Facility. 1H and 13C NMR spectra were referenced internally to residual solvent peaks and chemical shifts are expressed relative to tetramethylsilane (SiMe4; δ = 0 ppm). 195Pt NMR spectra were referenced externally using a standard of K2PtCl4 in D2O (δ = −1628 ppm). Optical absorption spectra were recorded with a Cary 1E spectrophotometer. Emission spectra were obtained with a Photon Technology International QM-4/2003 fluorimeter. Quantum yields for fluorescence were measured using either fluorescein in 0.1 M NaOH (Φ = 0.95)44 for NBD-dpm and 3, or quinine sulfate in 0.1 M H2SO4 (Φ = 0.58)45 for Ds-dpm and 2 as references and by exciting samples at their wavelengths of maximum absorbance. Electrospray ionization mass spectrometry (ESI-MS) measurements were acquired on an Agilent Technologies 1100 series LC-MSD trap.
Theoretical Calculations
DFT calculations were performed for the two conformers of 3 using the Gaussian 03 (Rev.D01) software package.46 Atoms in molecules calculations were carried out with Xaim.47 The geometries were optimized using the B3LYP48–50 functional and the 6–31++g(d,p)51,52 basis set for the light atoms (H, C, N, O and Cl) and the LANL2DZ53 basis set for the platinum atom. The effective core potential (ECP) basis set includes corrections for relativistic effects. Geometry optimizations in solution were carried out using an implicit solvation model through the Integral Equation Formalism Polarizable Continuum Model (IEFPCM)54 for DMF,55 ε = 36.71. The molecular cavity was built up by the Universal Force Field (UFF) model. For both conformers, frequency calculations were performed to ensure that the geometries are true energy minima. The simulated UV-vis absorption spectra were calculated with TDDFT methods using the 100 lowest singlet excited states of the closed-shell complexes in DMF solution. The atoms in molecules (AIM) theory56–58 calculations were performed using the wave function generated by Gaussian 03 calculations of the optimized geometry in the gas-phase. XYZ coordinates and vibrational frequencies of the optimized solution-phase geometries of the conformers of 3 are provided in the Supporting Information, Tables S1 and S2.
X-ray Crystallographic Studies
Single crystals were mounted in Paratone oil on a cryoloop and frozen under a 110 K or 100 K KRYO-FLEX nitrogen cold stream. Data were collected on a Bruker APEX CCD X-ray diffractometer with graphite-monochromated Mo-Ka radiation (λ = 0.71073 Å) controlled by the SMART software package.59 Empirical absorption corrections were applied using SADABS.60 The structures were solved using direct methods and refined on F2 with the SHELXTL-97 software package.61,62 Structures were checked for higher symmetry using PLATON.63 All non-hydrogen atoms were located and refined anisotropically. In general, all hydrogen atoms were placed in idealized locations and given isotropic thermal parameters equivalent to either 1.5 (methyl hydrogen atoms) or 1.2 times the thermal parameter of the atom to which they were attached. For NBD-dpm and 2, the amine and sulfonamide hydrogen atoms (H3N) were located on the difference Fourier map and refined with constrained H-N bond distances (0.88 Å) and isotropic thermal parameters (1.2 times the thermal parameter of the attached nitrogen).
X-ray quality crystals of the ligands Ds-dpm and NBD-dpm were grown by evaporation from 1:1 MeOH:Et2O and CH2Cl2 solutions, respectively. X-ray quality crystals of the platinum complexes 1 – 3, 1ox and 3ox were grown by vapor diffusion of diethyl ether into DMF solutions. Compound 2 crystallized with a well-ordered molecule of DMF in the asymmetric unit. Compound 3 crystallized with half a molecule of disordered diethyl ether in the asymmetric unit with the central oxygen atom occupying a crystallographic inversion center. This molecule of diethyl ether was refined anisotropically with the help of similarity restraints on bond distances (SADI) and anisotropic thermal parameters (SIMU and DELU). In addition, 3 crystallized as a disordered mixture of the exo and endo conformers. Restraints to enforce planarity (FLAT) and similarity (SAME, SIMU, DELU) were used in the refinement of the disordered NBD rings. The thermal parameters of C6 and its disordered component C6A were constrained to be identical with the use of the EADP command.64 Both 1ox and 3ox afforded only small, low-quality crystals. Refinement suffered from several unreasonable thermal ellipsoids. The ellipsoid of the oxygen atom of the hydroxo ligand in 1ox failed the Hirschfeld rigid-bond test.65 The Pt—O bond distance was around 2.1 Å, which is 0.1 Å longer than most Pt hydroxo bond lengths. These two results suggest that some occupational disorder between a chloride and oxygen atom. Unfortunately, this disorder could not be satisfactorily modeled, even with restraints. The thermal ellipsoid of C6 in 3ox became non-positive definite upon the initial anisotropic refinement and was therefore subsequently constrained to equal that of its neighbors. Additionally, large solvent-accessible voids that contained heavily disordered electron-density were present in both cases thus affecting the overall weighting factor of the refinement. Because of these problems, only the probable atomic connectivity is discussed for these structures. A summary of crystallographic data and refinement information for the ligands and 1 – 3 is presented in Table 1 and for 1ox and 3ox, in Table S3 of the Supporting Information.
Table 1.
Summary of X-ray crystallographic information and data collection parameters for Ds-dpm, NBD-dpm, and compounds 1 – 3.
| Ds-dpm | NBD-dpm | 1 | 2·DMF | 3·0.5Et2O | |
|---|---|---|---|---|---|
| formula | C23H22N4O2S | C17H12N6O3 | C18H17Cl2N3O2PtS | C26H29Cl2N5O3PtS | C19H17Cl2N6O3.50Pt |
| fw | 418.51 | 348.33 | 605.40 | 757.59 | 651.38 |
| space group | Pbca | C2/c | Cc | P1̄ | P1̄ |
| a, Å | 10.4517(9) | 13.9662(10) | 11.4122(12) | 9.3238(12) | 8.5263(4) |
| b, Å | 15.8232(13) | 10.6609(8) | 13.2503(14) | 10.2881(13) | 11.3987(6) |
| c, Å | 24.852(2) | 21.2035(15) | 13.7957(19) | 16.284(2) | 11.9663(6) |
| α, deg | 74.290(2) | 86.0360(10) | |||
| β, deg | 101.7580(10) | 112.456(2) | 79.220(2) | 85.1820(10) | |
| γ, deg | 65.939(2) | 69.5230(10) | |||
| V, Å3 | 4109.9(6) | 3090.8(4) | 1927.9(4) | 1367.8(3) | 1084.67(9) |
| Z | 8 | 8 | 4 | 2 | 2 |
| ρcalc, g/cm3 | 1.353 | 1.497 | 2.086 | 1.839 | 1.994 |
| T, °C | −263(2) | −263(2) | −273(2) | −273(2) | −263(2) |
| μ (Mo Kα), mm−1 | 0.186 | 0.108 | 7.683 | 5.439 | 6.752 |
| Θ range, deg | 1.64–26.37 | 1.96–28.70 | 2.47–28.28 | 1.30–26.51 | 1.71–26.37 |
| total no. of data | 55468 | 31855 | 18845 | 24234 | 19570 |
| no. of unique data | 4194 | 3998 | 4712 | 5667 | 4436 |
| no. of params | 276 | 238 | 246 | 350 | 435 |
| completeness to Θ (%) | 100.0 | 100.0 | 100.0 | 99.5 | 100.0 |
| Ra (%) | 4.41 | 4.53 | 2.24 | 2.87 | 2.50 |
| wR2b (%) | 9.45 | 10.93 | 4.46 | 6.22 | 5.16 |
| GOFc | 1.033 | 1.024 | 1.006 | 1.055 | 1.092 |
| max, min peaks, e/Å3 | 0.312, −0.378 | 0.438, −0.318 | 1.424, −0.767 | 1.450, −1.758 | 1.086, −0.606 |
R = Σ||Fo| − |Fc||/Σ|Fo|.
wR2 = {w(Fo2 − Fc2)2/Σ[w(Fo2)2]}1/2.
GOF = [Σw(Fo2 − Fc2)2/(n − p)]1/2 where n is the number of data and p is the number of refined parameters.
Results and Discussion
Ligand Synthesis and Characterization
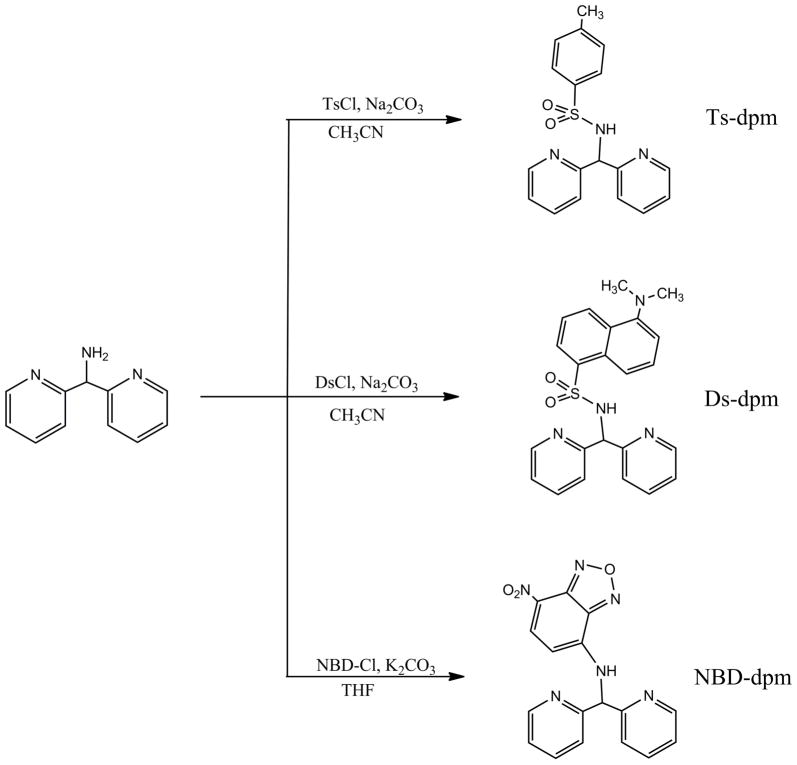
The three ligands were prepared in moderate to good yields from di-2-pyridylmethanamine and the corresponding sulfonyl (Ts-dpm and Ds-dpm) or aryl (NBD-dpm) chloride in the presence of a carbonate salt as a base to neutralize the hydrochloric acid byproduct, as shown in Scheme 1. Di-2-pyridylmethanamine is a convenient starting material for the synthesis of these new fluorescent ligands. The primary amine group is readily functionalized by a number of amine-specific fluorescent labeling reagents,36 while the two pyridyl arms remain available for metal coordination. This property is demonstrated here by our use of dansyl and NBD, both well-known fluorophores. Because platinum complexes containing similar ligands display cytotoxic activities similar to that of cisplatin,37–39 we hypothesized that Pt complexes utilizing our modified dpm ligands would similarly be cytotoxic.
Scheme 1.
The three ligands were characterized by 1H and 13C NMR spectroscopy and by ESI-MS. Both Ds-dpm and NBD-dpm were structurally characterized by X-ray diffraction. The NMR spectra of the ligands are consistent with the structures depicted in Scheme 1.
The 13C NMR spectra displayed characteristic resonances for the methine carbon atoms (py2CHNHR) at 62 – 63 ppm for all three ligands. The proton resonance of this methine carbon atom appeared as a doublet near 5.6 ppm in the 1H NMR spectra of Ts-dpm and Ds-dpm. In NBD-dpm, this resonance was a broad singlet at 6 ppm.
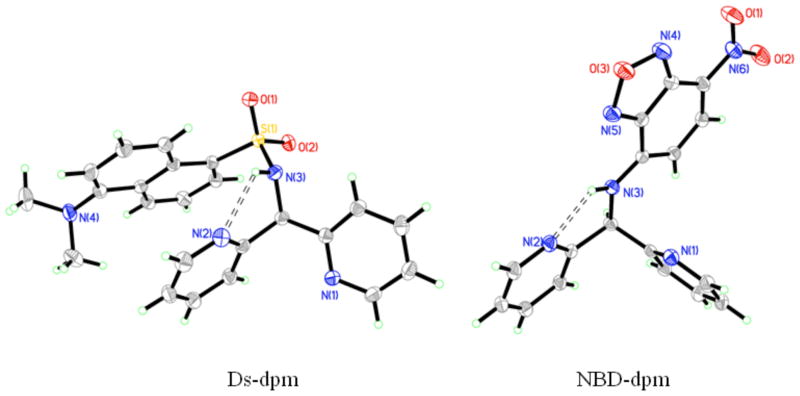
The molecular structures of Ds-dpm and NBD-dpm as determined by X-ray crystallography are shown in Figure 1.
Figure 1.
Molecular structures of Ds-dpm (left) and NBD-dpm (right). Thermal ellipsoids are drawn at the 50 % probability level. Carbon (grey) and hydrogen (green circles) atoms are not labeled.
Both structures reveal an intramolecular hydrogen bond between N2 of the pyridine ring and N3 of the sulfonamide or amine. The N···N distance is 2.73 Å for Ds-dpm and 2.60 Å for NBD-dpm. Ds-dpm exhibits no other noteworthy intra- or intermolecular interactions in the solid state. In contrast, NBD-dpm engages in a long-range intermolecular π-stacking interaction along the crystallographic c-axis (Figure S3). This stacking interaction occurs in a BBABB-type pattern, where pyridine ring (A) is flanked on either side by two consecutively stacked NBD heterocycles (B). The interplanar distance between the NBD heterocycles is 3.37 Å and the spacing between the NBD heterocycle and pyridine ring is 3.23 Å.
Synthesis and Solid State Characterization of Pt Complexes
The platinum complexes 1, 2, and 3 were prepared by treating a suspension of cis-[Pt(DMSO)2Cl2] in methanol with a methanolic solution of the ligand, as shown in Scheme 2.
Scheme 2.
This general synthetic route for the preparation of Pt(II) diimine dichloro compounds has been used previously.66–70 The platinum complexes were isolated as analytically pure solids in yields of greater than 70 %. These compounds were characterized both in the solid state by X-ray diffraction and in solution by NMR spectroscopy.
The molecular structures of 1, 2, and 3 are shown in Figure 2. Selected bond distances and angles are displayed in Table 2. As anticipated, the ligands adopt a bidentate coordination mode through the nitrogen atoms of the pyridine rings. The typical square planar geometry for Pt(II) is observed for 1 – 3 with only minor deviations from the ideal 90° L—Pt—L bond angles. These values range from 87.6° to 92.0 ° in the three complexes. The Pt-L bonds have the expected distances of about 2 Å for Pt—Npy and 2.3 Å for Pt—Cl. In the solid state, these compounds are asymmetric. For 1 and 2, the tosyl and dansyl groups are positioned over a coordinating pyridine ring. In 3, the NBD heterocycle is tilted to one side, thus destroying a potential mirror plane containing Pt1, C6, and N3.
Figure 2.
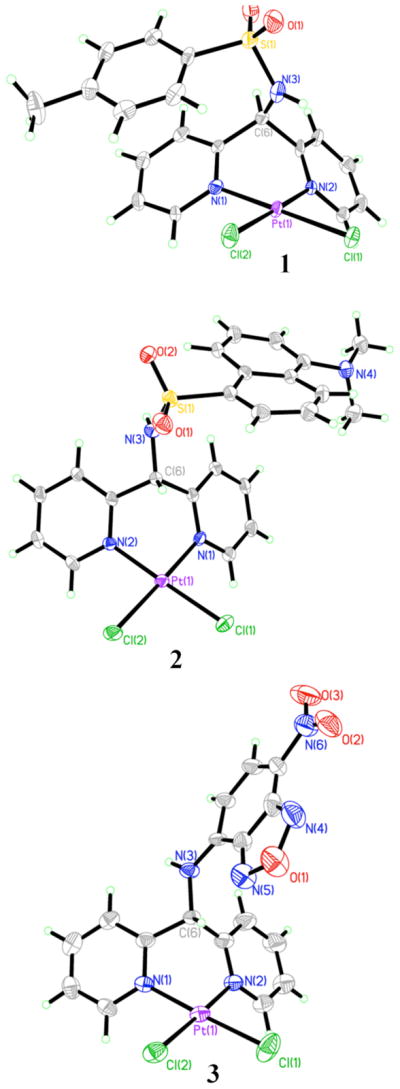
Molecular structures of 1, 2, and 3. Thermal ellipsoids are drawn at the 50 % probability level. Carbon and hydrogen atoms are not labeled. Solvent molecules of crystallization for 2 and 3 are omitted for clarity. Disorder in 3 has been omitted as well.
Table 2.
Selected interatomic distances (Å) and angles (deg) for 1, 2, and 3a
| 1 | 2·DMF | 3·0.5Et2O | |
|---|---|---|---|
| Pt1—Cl1 | 2.2980(13) | 2.2917(9) | 2.2851(10) |
| Pt1—Cl2 | 2.2903(11) | 2.2943(9) | 2.3044(9) |
| Pt1—N1 | 2.032(4) | 2.015(3) | 2.015(3) |
| Pt1—N2 | 2.020(3) | 2.018(3) | 2.009(3) |
| N1—Pt1—N2 | 87.93(14) | 87.71(11) | 87.64(11) |
| N1—Pt1—Cl1 | 178.33(10) | 178.70(8) | 177.48(8) |
| N1—Pt1—Cl2 | 90.90(10) | 90.39(8) | 90.47(8) |
| N2—Pt1—Cl1 | 90.65(11) | 91.09(8) | 89.92(9) |
| N2—Pt1—Cl2 | 178.73(11) | 177.41(8) | 178.11(9) |
| Cl1—Pt1—Cl2 | 90.52(4) | 90.83(3) | 91.98(4) |
Numbers in parentheses are the estimated standard deviations of the last significant figures. Atoms are labeled as indicated in Figure 2.
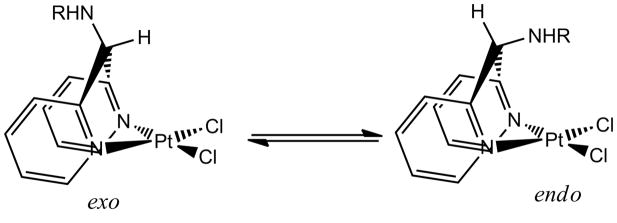
Unlike the related diimine ligands 2,2′-bipyridine and 1,10-phenanthroline, which form five-membered planar chelate rings, dpm and the analogues studied here give rise to six-membered chelate rings that are not planar. As observed in the structures of 1 – 3, the chelate rings adopt a boat-like conformation. Because the bridging methine carbon is bound to two inequivalent substituents in addition to the pyridine rings, two different conformational isomers exist. These conformers, exo and endo, are depicted in Scheme 3.
Scheme 3.
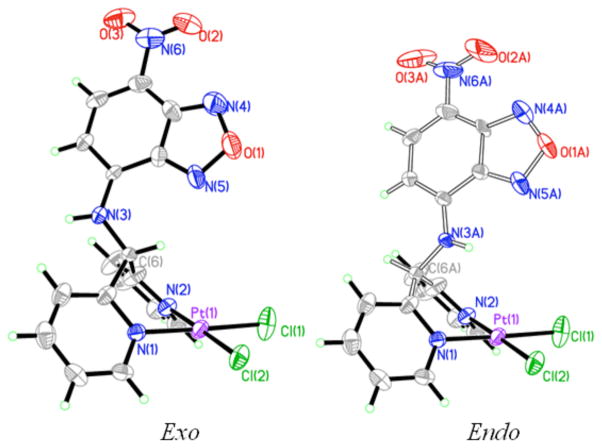
Compound 1 crystallizes exclusively as the endo conformer, 2 as the exo conformer, and 3 as a disordered mixture of the two. The occupancy factors of the disordered components of 3 were allowed to refine freely, and a final value of 66 % was obtained for the exo conformer. The two disordered components of 3 are shown in Figure 3.
Figure 3.
Disordered components of 3. Both exo (left) and endo (right) conformers were observed.
Another noteworthy feature in the structures of 1 – 3 is a close Pt—H interaction observed for the hydrogen atoms of the methine carbon (C6) in the exo conformers and the hydrogen atom of amine or sulfonamide nitrogen (N3) of the endo conformers. For 1 and the endo conformer of 3, the hydrogen atom of N3 is 2.88 and 2.90 Å from the Pt center, respectively. The corresponding N—H—Pt angles are 102.4° and 110.9°. Shorter Pt—H distances are observed in the exo conformers. For 2 and the exo conformer of 3, the hydrogen atom of C6 is at distance of 2.79 Å and 2.67 Å from the Pt atom with C-H—Pt angles of 95.5° and 97.4° respectively. The nature of similar axial M—H interactions in d8 square planar complexes has previously been investigated by us71 and by others.72–74 These studies examined whether such interactions should be considered agostic. Authentic agostic interactions are characterized as covalent 3-center-2-electron interactions.75 In all of the studies, these particular d8 square planar interactions were characterized as purely electrostatic in nature and therefore not agostic. In the cases of 1 – 3, the close Pt—H distances are most likely a consequence of the ligand-binding geometry. However, the NMR data discussed below are consistent with the presence of weak electrostatic interactions.
NMR Spectroscopic Characterization of 1, 2, and 3
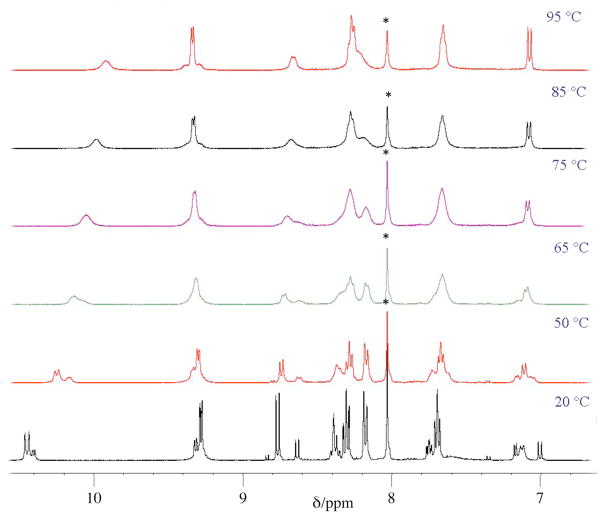
The three platinum complexes are insoluble in non-polar organic solvents and water. The compounds are very soluble in DMSO and DMF. Given the propensity of DMSO to interact with Pt(II) by ligand substitution reactions,76–78 DMF-d7 was chosen as the solvent for conducting NMR spectroscopic studies of 1 – 3. The 1H NMR spectra of 1 – 3 in DMF-d7 at 20 °C displayed two distinct sets of resonances of unequal intensity corresponding to the inequivalent exo and endo conformers. At temperatures above 65 °C, the signals coalesce as interconversion rapidly occurs and the different conformers become indistinguishable on the NMR timescale, as shown in Figure 4 for 3 (see Figures S4 and S5 in Supporting Information for VT-NMR spectra for 1 and 2). This process is reversible through several temperature cycles. However, prolonged exposure of these compounds to elevated temperatures does eventually lead to decomposition (vide infra).
Figure 4.
Variable-temperature 1H NMR spectra of 3 in DMF-d7. As temperature is elevated above 50 °C, the distinct resonances for the exo and endo conformers coalesce. For full peak assignment of 3 at 20 °C, see Figure S12 in the Supporting Information. VT-NMR spectra for 1 and 2 are provided in the Supporting Information, Figures S4 and S5. The singlet at 8 ppm marked by an asterisk is from the solvent.
Proton resonances were assigned using 2D NMR spectroscopic techniques (Figures S6 to S14). Selected 1H and 195Pt NMR chemical shifts are displayed in Table 3. The resonances of the protons ortho to the coordinating nitrogen atoms of the pyridine rings fall between 9.0 – 9.3 ppm for the three complexes in both conformations. These resonances are 0.6 – 1.0 ppm downfield from the corresponding values in the free ligands, consistent with coordination to the Pt center. In the 1H, 13C HSQC spectra, the amine and sulfonamide protons could be identified as the only resonances not correlated to a carbon nucleus. These proton chemical shifts are farthest downfield, with values ranging from 9.5 to 10.4 ppm. The large downfield shifts of these protons are attributed in part to hydrogen-bonding interactions with the highly polar DMF solvent. The methine proton resonances (C6 in Figure 2) were identified based on coupling to the NH resonances (observed by 1H, 1H COSY) and by coupling to carbon atoms near 65 ppm (observed by 1H, 13C HSQC). These resonances occur between 6.3 and 7.2 ppm in complexes 1 – 3.
Table 3.
195Pt and selected 1H NMR chemical shifts for the conformers of 1 – 3.
| Compound | δ 195Pt, ppm | δ 1H, ortho-py, | δ 1H, N-H, ppm | δ 1H, methine H, ppm |
|---|---|---|---|---|
| exo-1 | −2198 | 9.13 | 10.15 | 6.79 |
| endo-1 | −2082 | ppm 9.23 | 9.54 | 6.15 |
| exo-2 | −2199 | 9.08 | 10.40 | 6.82 |
| endo-2 | −2105 | 9.14 | 9.65 | 6.30 |
| exo-3 | −2196 | 9.28 | 10.44 | 7.60, broad |
| endo-3 | −2057 | 9.31 | 10.40 | 7.17 |
1H,1H NOESY experiments identified the exo conformer as the major species in solution for all three compounds. Especially diagnostic is the presence of an NOE cross-peak between the NH proton and the protons at the 3-position of the pyridine rings only in the major set of signals. A similar cross-peak was observed between the methine proton and the protons at the 3-position of the pyridine ring in the minor set of signals, corresponding to the endo conformer. Negative-phase cross-peaks between analogous protons of the exo and endo conformers were also observed, indicating that interconversion between conformers occurs within the 2 sec mixing period of the experiment.
The methine proton resonances of the exo conformers 1 – 3 occur about 1 ppm downfield from those in the endo conformers. This downfield shift is consistent with an electrostatic interaction between the methine proton and the Pt center, as observed in the crystal structures and discussed above. Agostic interactions, on the other hand, would shift these resonances upfield.75
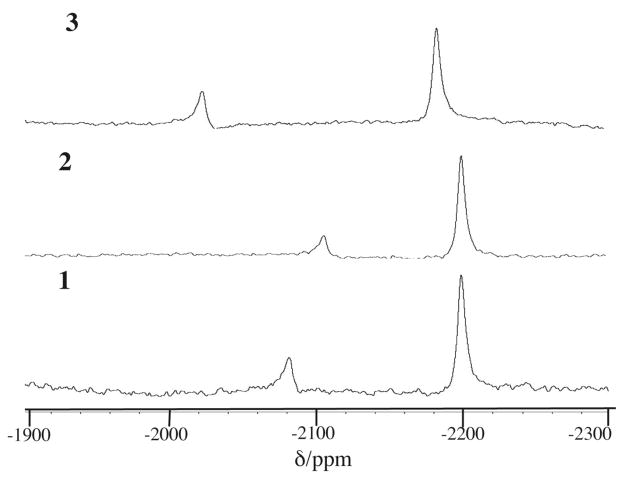
195Pt NMR spectra for 1 – 3 were recorded at 20 °C in DMF-d7. As expected, two distinct resonances are observed for each compound, corresponding to the two conformers (Figure 5).
Figure 5.
195Pt NMR spectra of 1 (bottom), 2 (middle), and 3 (top) in DMF-d7. Signals are observed for both the exo (major) and endo (minor) conformers.
The observed chemical shifts (−2057 to −2199 ppm) for these complexes are in the range expected for Pt(II) with an N2Cl2 coordination environment.79–81 For all three complexes, the exo conformer resonance occurs upfield from that in the endo conformer, indicating greater shielding of the Pt nucleus in the former. In the three complexes, the chemical shifts of the exo conformers all fall within 3 ppm of −2198 ppm. This similarity is remarkable given the large, 15,000 ppm window of for the 195Pt nucleus. The chemical shifts of the endo conformers span a wider range. The shifts are −2082, −2105, and −2057 ppm for 1, 2, and 3 respectively. This wider range in shifts reflects the fact that the endo conformations position the different functional groups of the ligands closer to the Pt center than the exo conformations.
To assess the thermodynamic stability of the exo relative to that of the endo conformer, van’t Hoff plots were constructed from variable-temperature NMR experiments (Figures S15 – S17). The values of ΔH°, ΔS°, and ΔG° (at 298 K) for conversion of the exo to the endo conformer are listed in Table 4.
Table 4.
Thermodynamic parameters for the exo to endo conversion of 1 – 3 in DMF solution.
| Compound | ΔH°, kcal·mol−1 | ΔS°, cal·K−1·mol−1 | ΔG° (298 K), kcal·mol−1 |
|---|---|---|---|
| 1 | +1.38 ± 0.05 | −2.4 ± 0.2 | +2.09 ± 0.07 |
| 2 | +2.10 ± 0.07 | −3.9 ± 0.2 | +3.25 ± 0.09 |
| 3 | +1.31 ± 0.05 | −2.5 ± 0.1 | +2.06 ± 0.06 |
The larger size of the dansyl group may influence the greater thermodynamic preference for the exo conformer in 2, relative to 1 and 3. In general, these energy differences are quite small, consistent with the presence of both conformers in the solid state structures.
Photophysical Properties
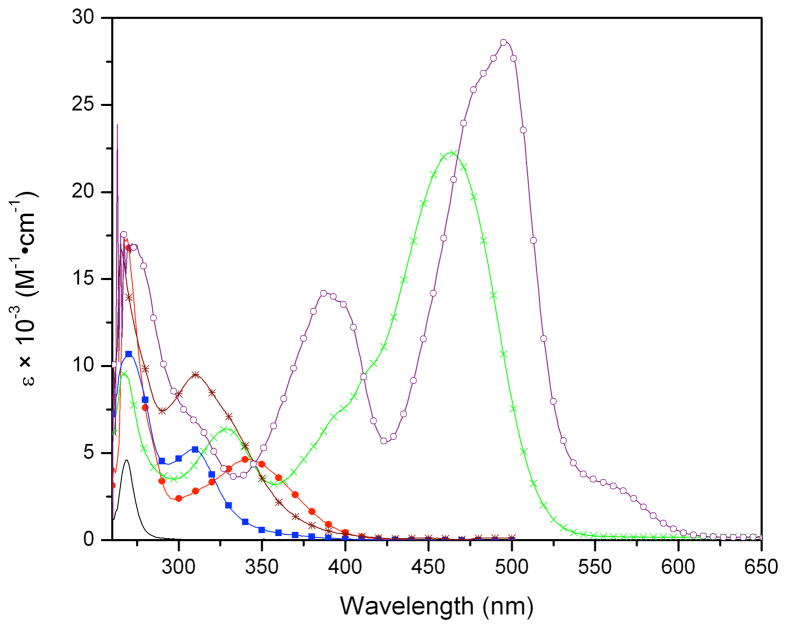
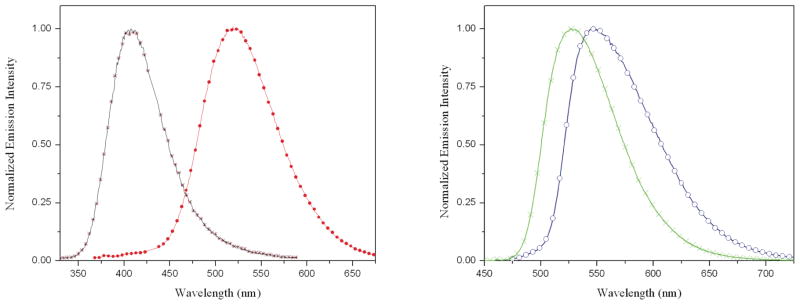
Relevant photophysical properties for the ligands and compounds 1 – 3 in DMF solution are summarized in Table 5, and optical absorption spectra are shown in Figure 6. Emission spectra of the compounds are provided in Figure 7. A pyridine-localized 1π – π* transition appears in all three ligands around 270 nm. For Ts-dpm, this is the only spectral feature observed. The band at 340 nm and the absorptions at 330 nm and 468 nm of Ds-dpm and NBD-dpm, respectively, can be assigned to 1π-π* transitions localized in the naphthalene ring system and fused heterocycle of the two ligands. Ts-dpm is non-emissive. Both Ds-dpm and NBD-dpm emit in the green region of the visible spectrum at 521 and 524 nm with quantum yields of 0.30 and 0.32 respectively. These values are similar to those reported for other compounds conjugated with dansyl82–84 and NBD.85,86 This result indicates that the pyridine rings do not induce significant quenching of the fluorophores.
Table 5.
Electronic absorption and emission data for ligands and platinum complexes in DMF solution.
| Compound | Absorption λmax, nm (ε × 10−3, M−1·cm−1) | Emission λem, nm (Φ) |
|---|---|---|
| Ts-dpm | 268 (5.04) | - |
| Ds-dpm | 269 (18.7), 340 (4.90) | 521 (0.30)a |
| NBD-dpm | 270 (8.80), 330 (6.30), 468 (22.0) | 524 (0.32)b |
| 1 | 270 (10.00), 310 (5.10) | - |
| 2 | 266 (16.30), 312 (8.50) | 440 (0.019)a |
| 3 | 270 (19.0), 388 (13.60), 476 (sh, 25.80), 496 (28.20) | 545 (0.003)b |
Figure 6.
UV-vis absorption spectra for Ts-dpm (—), Ds-dpm ( ), NBD-dpm (
 ), 1 (
 ), 2 (
 ), and 3 (
 ) in DMF at room temperature.
Figure 7.
Room temperature normalized emission spectra of Ds-dpm ( ) and 2 (
 ) (left), and NBD-dpm (
 ) and 3 (
 ) (right) in DMF. Spectra were obtained by exciting compounds at their wavelengths of maximum absorption.
Upon coordination to Pt(II), the absorption features of the ligands are altered. The pyridine-localized 1π-π* transitions occur at nearly the same wavelength, but with a two-fold increase in the extinction coefficients in the Pt complexes. For 1, a new band at 310 nm is observed that is not present in the free ligand. For 2, the band at 340 nm in the free ligand is shifted to higher energy, appearing at 312 nm. The major bands of NBD-dpm are red-shifted significantly to 388 and 496 nm when coordinated to Pt in 3.
Pt coordination also affects the emission properties of the ligands (Figure 7). Like Ts-dpm, 1 is not emissive. The platinum complexes, 2 and 3, exhibit broad, unstructured emission bands similar to the free ligands. The emission band of 2 is centered at 440 nm, which is 80 nm (3500 cm−1) higher in energy than the free ligand. In contrast, the emission band of 3 is centered at 545 nm, 20 nm (740 cm−1) lower in energy than for the free ligand.
The measured quantum yields for fluorescence of 2 and 3 are 0.019 and 0.003, respectively, indicating large quenching of the ligand fluorescence. This effect most likely arises from the close proximity of the Pt center to the fluorophores. Heavy atoms can increase the rates of spin-forbidden radiation-less transitions in aromatic systems, thus lowering the overall quantum yield of fluorescence.87,88 Fluorescence quenching of a dansyl fluorophore by Pt(II) occurs in a series of compounds with different sized linkers between the metal atom and fluorophore.89 As expected, the fluorescence was quenched to a larger extent when the dansyl group was closer to the platinum center. The large quenching effect observed for 2 and 3 is undesirable for potential cellular imaging applications. For future ligand design, longer and more rigid alkyl chains as spatial linkers may be necessary to position the fluorophores farther away from the Pt center to avoid quenching by the heavy-atom effect.
DFT Calculations
Compound 3 was chosen for theoretical calculations because structural data from X-ray crystallography could be obtained for both the exo and endo conformers, both of which occur in the crystal lattice, and also because of the relatively small size of the NBD chromophore, which simplifies calculations. Both conformers were optimized in the gas phase and in DMF solution using the X-ray coordinates as a starting geometry. The solution-optimized structures were in good agreement with the X-ray results (see Table S4 and Figure S18 for a comparison). A common feature between both conformers in these optimized structures is the tilting of the NBD heterocycle consistent with the X-ray structure. Attempts to optimize either conformer in Cs-symmetry led to a structure that was not a true minimum as indicated by the presence of imaginary vibrational frequencies.
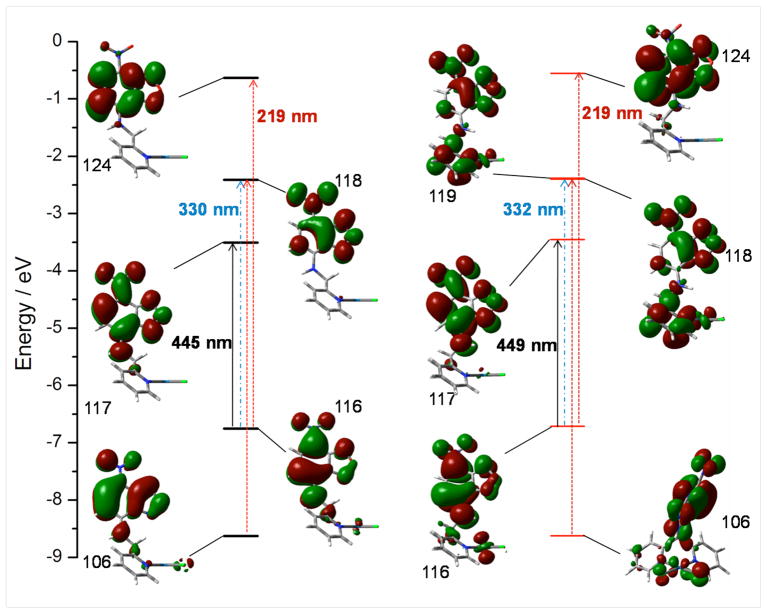
The simulated electronic spectra, as calculated by TDDFT methods, are nearly identical for both conformers. Information regarding all electronically allowed transitions and their corresponding oscillator strengths is provided in Table S5 of the Supporting Information. Compared to the experimental spectrum (Figure 6), the simulated spectra are similar with respect to the number of bands, but all of the absorbance maxima are consistently shifted by approximately 50 nm to higher energy. The dominant band at 445 nm (496 nm, experimental) arises predominantly from the HOMO (MO 116) to LUMO (MO 117) transition in both conformers. The higher energy band at 330 nm (388 nm, experimental) is described by a transition from the HOMO to the LUMO+1 (MO 118) in the exo conformer and from the HOMO to the LUMO+2 (MO 119) in the endo conformer. Lastly, an electronic transition from MO 106 to the LUMO+1 is the primary contributor to the band at 219 nm (270 nm, experimental) for both conformers. The molecular orbitals involved in these transitions for both conformers are shown in Figure 8.
Figure 8.
The molecular orbitals that contribute to the main electronic absorption bands for both the exo (left) and the endo (right) conformers. Arrows indicate calculated electronic transitions. Molecular orbital surfaces are shown with contour values of 0.02 a.u.
As seen in Figure 8, these orbitals predominantly reside on the NBD heterocycle and thus the electronic transitions are best described as ligand–to-ligand π-π*. Upon closer examination of Figure 8, one can also notice interesting differences in electronic structure between the two conformers. Notably, the endo conformer displays a higher degree of electron delocalization throughout the entire molecule whereas the analogous MOs in the exo conformer are entirely localized on the NBD heterocycle. This effect is exemplified by MOs 106, 116, 117, 118, and 119 of the endo conformer, which all have significant Pt d-orbital character and pyridine π-orbital character. We speculate that this delocalization arises from conjugation with the p-orbital of the overhanging nitrogen atom. In the exo conformer only the C-H σ and σ* orbitals would be available for such an interaction. However, both of these orbitals are expected to be well outside of the energy range for interaction with the Pt orbitals.
Theoretical studies of 3 were also extended to investigate the nature of the axial Pt—H interactions observed in the two conformers as described above. These interactions were evaluated by using the theory of atoms in molecules developed by Bader.56–58 In the gas-phase optimized structures of the two conformers, we sought bond critical points (BCPs) between the Pt atom and the hydrogen atom in question. A Pt—H BCP was located for the endo conformer, but not the exo conformer. The bond critical point describing the Pt—H interaction of the endo conformer is defined by an electron density, ρ(r), of 0.0180 a.u. and a value of the Laplacian, ∇2ρ(r), of 0.0522 a.u. The magnitude of these values and the positive sign of the Laplacian meet the criteria for a closed-shell hydrogen bonding interaction.90 Further investigations of the electron topology of the exo conformer revealed the presence of a bond critical point between the methine proton and a nitrogen atom of the NBD heterocycle (N5, Figure 3). No analogous BCP was located in the endo conformer. This BCP also meets the criteria for a hydrogen bond with ρ(r) = 0.0180 a.u. and ∇2ρ(r) = 0.0617 a.u. These results show that both protons in question are involved in electrostatic interactions. Although the methine proton of the exo conformer does not form a hydrogen bond with the Pt atom, the downfield shift of this resonance as observed in the 1H NMR spectrum is consistent with the predicted electrostatic interaction with the nitrogen atom of the NBD heterocycle. A summary of these BCPs including their coordinates is presented in Table S6 of the Supporting Information.
Thermal and Photochemical Reactivity
Compounds 1, 2, and 3 are stable for over 4 weeks in DMF solution when kept in the dark at room temperature. To assess the stability of these compounds under elevated temperatures and exposure to light, controlled thermolytic and photolytic reactions were monitored by 1H and 195Pt NMR spectroscopy.
At 60 °C in the dark, aerated solutions of 1 in DMF slowly decompose. Several new resonances appear in the 1H NMR spectrum and the solution color changes gradually from almost colorless to pale yellow. The thermal reaction is slow; after 85 h at 60 °C, only 25 % of the starting compound is consumed. The decomposition products are numerous and were not conclusively identified. Irradiation of 1 at room temperature led to no observable changes in the 1H NMR spectrum.
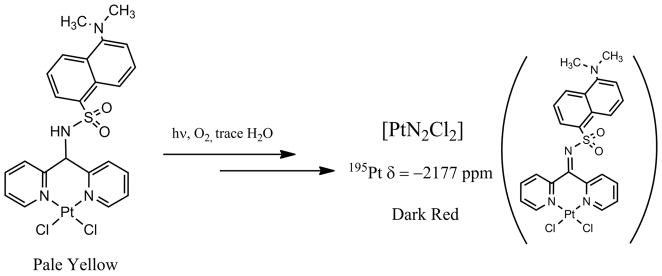
An aerated solution of 2 in DMF is stable at 60 °C for at least 60 h, with no noticeable change in the 1H NMR spectrum or solution color. However, upon irradiation, the pale yellow color of a solution of 2 turns dark red over the course of several days. The conversion is complete after 80 h, as monitored by 1H NMR spectroscopy (Figure S19). The 1H NMR spectrum of the photoproduct displays resonances consistent with the presence of a dansyl group and two equivalent pyridine rings. Neither the sulfonamide nor the methine proton was observed, indicating their absence in this photoproduct. The 195Pt NMR spectrum displayed a peak at −2177 ppm (Figure S20). This value is within the range expected for Pt(II) having an N2Cl2 coordination environment.79,81 Attempts to crystallize the major photoproduct of 2 were unsuccessful. Additional attempts to characterize the compound by ESI-MS were also unsuccessful; no diagnostic peaks were observed in the mass spectrum in either positive or negative ion mode. Our current working hypothesis for the identity of this photoproduct is that a dichloro Pt complex ligated by a sulfonyl-imine analogue of Ds-dpm forms, as illustrated in Scheme 4. This formulation is consistent with the lack of methine and NH protons in the 1H NMR spectrum.
Scheme 4.
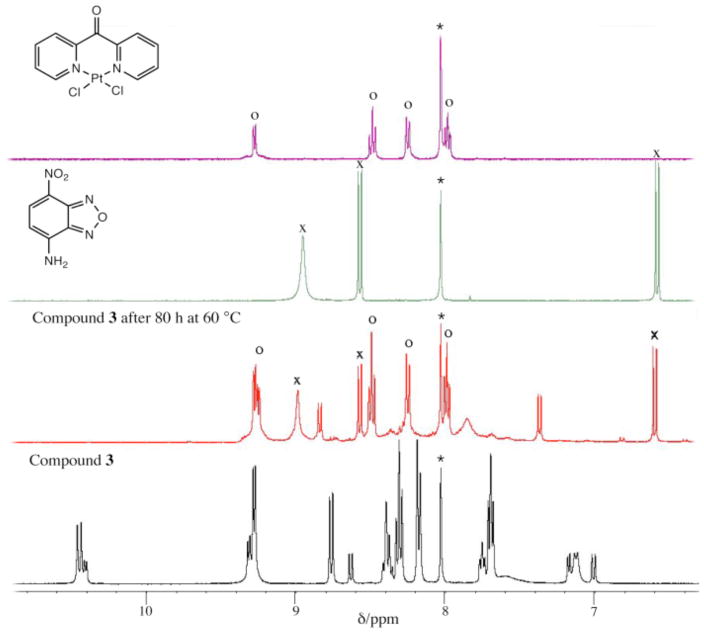
Thermolysis of 3 at 60 °C for 80 h leads to its complete conversion to several new compounds, as monitored by 1H NMR spectroscopy. Two of the newly formed products were conclusively identified as [Pt(dpk)Cl2] and NBD-NH2. Figure 9 shows the 1H NMR spectrum of 3, its thermolysis products, and authentic samples of [Pt(dpk)Cl2] and NBD-NH2 in DMF-d7. The resonances marked with circles correspond to [Pt(dpk)Cl2] and resonances marked with crosses, to NBD-NH2. Further support for these assignments comes from 195Pt NMR spectroscopy and ESI-MS. At 40 h into the thermolysis reaction, a 195Pt NMR spectrum was obtained of the reaction mixture. In addition to the two signals observed for the conformational isomers of 3, a new signal at −1958 ppm appeared (Figure S21). This value matches the 195Pt chemical shift of [Pt(dpk)Cl2] measured independently, thus supporting its assignment in the 1H NMR spectrum. ESI-MS studies of the reaction mixture revealed an m/z peak at 178.9 in the negative ion mode. This value matches the calculated m/z for NBD-NH−, 179.0. The doublets at 8.8 and 7.3 ppm and the broad peak at 7.8 ppm in the 1H NMR spectrum are not assigned, but most likely correspond to another NBD-containing compound.
Figure 9.
From bottom to top: 1H NMR spectra of 3, 3 after thermolysis at 60 °C for 80 h, NBD-NH2, and [Pt(dpk)Cl2] in DMF-d7. Resonances marked with circles are assigned to [Pt(dpk)Cl2] and resonances marked with crosses are assigned to NBD-NH2. The doublets at 8.8 and 7.3 ppm, and the broad singlet at 7.8 ppm are currently unassigned. The sharp singlet at 8 ppm in all spectra marked by an asterisk is from the solvent.
Decomposition of 3 to [Pt(dpk)Cl2] and NBD-NH2 also proceeds photochemically, as depicted in Scheme 5. Irradiation of 3 at room temperature produces the same changes in the 1H NMR spectrum as observed for the thermal reaction. The photochemical reaction, however, is much slower. After 85 h of irradiation at room temperature, only 50 % conversion of 3 occurs.
Scheme 5.
Since [Pt(dpk)Cl2] is nearly as cytotoxic as cisplatin in several cell lines,38 the ability of 3 to generate this compound by light exposure or temperature increase is of interest for the design of platinum prodrugs. If 3 is sufficiently less cytotoxic than [Pt(dpk)Cl2], it might function as an efficient, heat-activatable prodrug. Although light-activated Pt prodrugs have been studied and reported,14,15 to our knowledge there are no reports of heat-activated Pt prodrugs in the literature. Several ruthenium complexes that exhibit enhanced cytotoxicity at elevated temperatures have recently been reported.91
For 1 – 3, the same thermal and photochemical conditions were applied under dioxygen- and water-free conditions by using samples prepared in a nitrogen-filled glove box in septa-sealed NMR tubes. Neither irradiation with light nor heating at 65 °C for up to 72 h produced noticeable changes in the 1H NMR spectra. It is therefore clear that dioxygen and at least trace amounts of water are necessary to promote the photochemical and thermal transformations reported here.
Oxidation Chemistry
Compounds 1 and 3 could be successfully oxidized to their Pt(IV) analogs by a procedure recently described for the oxidation of Pt(II) pyridyl azido complexes.15 Suspensions of the complexes in acetic acid were treated with H2O2 to afford the oxidized products. The anticipated products of these reactions were Pt(IV) hydroxo acetato species, but the observed products were generally more complex. In the case of 1, an initial 1H NMR spectrum of the isolated solid indicated the presence of a single compound. The 1H NMR spectrum was consistent with Cs-symmetry and no sulfonamide proton. Additionally, coupling to the 195Pt nucleus was observed for protons ortho to the coordinating nitrogen atoms of the pyridine rings (JPtH = 27.2 Hz) and, more surprisingly, to the methine (C6, Figure 2) proton (JPtH = 20.4 Hz). Upon standing in solution, however, this compound undergoes chemical transformations to at least two new species over the course of several days as monitored by 1H NMR spectroscopy (Figure S1). Red material isolated from the oxidation reaction of 3 was also investigated by 1H NMR spectroscopy. The 1H NMR resonances reveal the presence of at least two different compounds (Figure S2).
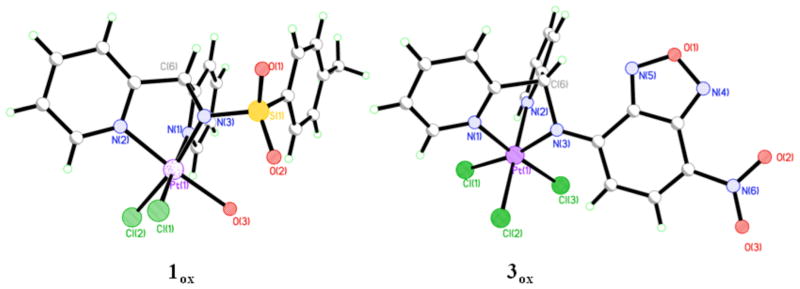
Attempts to crystallize these oxidized products for structural characterization afforded small, weakly diffracting crystals from reactions of both 1 and 3. Because of several issues were encountered with data collection and refinement (see Experimental Section), only the probable connectivity is considered here. The structures of these oxidized compounds, 1ox and 3ox, are shown in Figure 10.
Figure 10.
Ball-and-stick structures of 1ox and 3ox as determined by X-ray crystallography demonstrating likely atomic connectivity. Carbon and hydrogen atoms are not labeled. The hydrogen atom of O(3) in 1ox was not located and is not shown.
The chemical formulas of 1ox and 3ox as postulated from the crystal structures are rac-[Pt(κ3-Ts-dpm)Cl2(OH)] and [Pt(κ3-NBD-dpm)Cl3]. A common feature between the two structures is the change in coordination mode of the dpm ligands from κ2 to κ3 upon oxidation. A third binding atom of the dpm ligands is provided by the deprotonated anionic sulfonamide or amine nitrogen (N3, Figure 10). In this coordination mode, the methine proton is only three bonds from the Pt center, thus accounting for the Pt—H coupling observed in the 1H NMR spectrum described above. It is also noteworthy that 1ox lacks the pseudo Cs-symmetry that is observed in 1 – 3 and in the initial oxidation product of 1 as observed by NMR spectroscopy, thus indicating that the complex isomerizes in solution from the meso isomer (both chlorides trans to pyridine) to the rac isomer. Also of interest are the three chloride ions in the coordination sphere of Pt in 3ox. Given that no additional chloride source was present in the reaction mixture, the additional chloride ion of 3ox must have been provided by another Pt complex. Although the characterization of these oxidation products is incomplete, these results demonstrate that the dpm-based ligands can bind in a tridentate manner.
Conclusions
We report the synthesis and characterization of three new ligands and their corresponding platinum complexes. Two of the ligands are fluorescent. Use of di-2-pyridylmethanamine as a starting material provides access to fluorescent ligands by using any fluorescent amine-labeling reagent. These ligands can bind in either a bidentate or tridentate coordination mode, a property of relevance to their chemistry with Pt(IV) and other transition metals that form octahedral complexes. Coordination of platinum to the ligands induces significant fluorescence quenching. Such quenching is undesirable for cellular imaging applications. DFT calculations on 3 revealed novel differences in the MOs of the exo and endo conformers. The Pt complexes exhibit interesting oxygen-dependent photo- and thermochemical behavior. Although the products of these reactions for 1 and 2 have not been unambiguously characterized, the final products for such reactions of 3 were identified as [Pt(dpk)Cl2] and NBD-NH2. Since [Pt(dpk)Cl2] is cytotoxic,38 3 may prove to be useful as a prodrug.
Supplementary Material
Acknowledgments
This work was supported by the National Cancer Institute under grant CA034992. J.F.L is grateful to the CAPES-BRAZIL post-doctoral fellowship (process 4470-08-7). Spectroscopic instrumentation at the MIT DCIF is maintained with funding from NIH Grant 1S10RR13886-01. The authors thank Dr. Joel Rosenthal for assistance with photochemical experiments.
Footnotes
Supporting Information Available: X-ray crystallographic data in CIF format for compounds Ds-dpm, NBD-dpm, 1, 2, and 3, XYZ coordinates of the DMF solution optimized structures of the two conformers of 3 (Table S1), the vibrational frequencies of the solution optimized structures of 3 (Table S2), X-ray crystallographic data and refinement parameters for 1ox and 3ox (Table S3), structural comparison between the calculated and experimental geometries of 3 (Table S4), summary of calculate electronic transitions and oscillator strengths (Table S5), summary of the bond critical points (Table S6), 1H NMR spectra for the oxidation products of 1 and 3 (Figures S1 and S2), π-stacking interactions in the crystal lattice of NBD-dpm (Figure S3), variable-temperature NMR spectra of 1 and 2 (Figures S4 and S5), 2D NMR spectra for 1 – 3 (Figures S6 – S14), van’t Hoff plots for 1 – 3 (Figures S15 – S17), comparison of the X-ray structures and solution optimized geometries of 3 (Figure S18), 1H NMR spectra of the photoreaction of 2 (Figure S19), and 195Pt NMR spectra of the photoreaction of 2 and thermal reaction of 3 (Figures S20 and S21). This material is available free of charge via the Internet at http://pubs.acs.org.
References
- 1.Jamieson ER, Lippard SJ. Chem Rev. 1999;99:2467–2498. doi: 10.1021/cr980421n. [DOI] [PubMed] [Google Scholar]
- 2.Lippert B. Cisplatin: Chemistry and Biochemistry of a Leading Anticancer Drug. Wiley-VCH; Zurich, Switzerland: 1999. [Google Scholar]
- 3.Jung Y, Lippard SJ. Chem Rev. 2007;107:1387–1407. doi: 10.1021/cr068207j. [DOI] [PubMed] [Google Scholar]
- 4.Kelland L. Nat Rev Cancer. 2007;7:573–584. doi: 10.1038/nrc2167. [DOI] [PubMed] [Google Scholar]
- 5.Daugaard G, Abildgaard U. Cancer Chemotherap Pharmacol. 1989;25:1–9. doi: 10.1007/BF00694330. [DOI] [PubMed] [Google Scholar]
- 6.Pinzani V, Bressolle F, Haug IJ, Galtier M, Blayac JP, Balmès P. Cancer Chemotherap Pharmacol. 1994;35:1–9. doi: 10.1007/BF00686277. [DOI] [PubMed] [Google Scholar]
- 7.Screnci D, McKeage MJ. J Inorg Biochem. 1999;77:105–110. doi: 10.1016/s0162-0134(99)00135-x. [DOI] [PubMed] [Google Scholar]
- 8.Troy L, McFarland K, Littman-Power S, Kelly BJ, Walpole ET, Wyld D, Thomson D. Psycho–Oncol. 2000;9:29–39. doi: 10.1002/(sici)1099-1611(200001/02)9:1<29::aid-pon428>3.0.co;2-z. [DOI] [PubMed] [Google Scholar]
- 9.Lippard SJ. Science. 1982;218:1075–1082. doi: 10.1126/science.6890712. [DOI] [PubMed] [Google Scholar]
- 10.Lippert B. Coord Chem Rev. 1999;182:263–295. [Google Scholar]
- 11.Barton JK, Szalda DJ, Rabinowitz HN, Waszczak JV, Lippard SJ. J Am Chem Soc. 1979;101:1434–1441. [Google Scholar]
- 12.Matsumoto K, Ochiai M. Coord Chem Rev. 2002;231:229–238. [Google Scholar]
- 13.Lippert B. Chimia. 2007;61:732–735. [Google Scholar]
- 14.Mackay FS, Woods JA, Heringová P, Kašpárková J, Pizarro AM, Moggach SA, Parsons S, Brabec V, Sadler PJ. Proc Natl Acad Sci U S A. 2007;104:20743–20748. doi: 10.1073/pnas.0707742105. [DOI] [PMC free article] [PubMed] [Google Scholar]
- 15.Mackay FS, Farrer NJ, Salassa L, Tai HC, Deeth RJ, Moggach SA, Wood PA, Parsons S, Sadler PJ. Dalton Trans. 2009:2315–2325. doi: 10.1039/b820550g. [DOI] [PMC free article] [PubMed] [Google Scholar]
- 16.Giandomenico CM, Abrams MJ, Murrer BA, Vollano JF, Rheinheimer MI, Wyer SB, Bossard GE, Higgins JD., III Inorg Chem. 1995;34:1015–1021. doi: 10.1021/ic00109a004. [DOI] [PubMed] [Google Scholar]
- 17.Barnes KR, Kutikov A, Lippard SJ. Chem Biol. 2004;11:557–564. doi: 10.1016/j.chembiol.2004.03.024. [DOI] [PubMed] [Google Scholar]
- 18.Mukhopadhyay S, Barnés CM, Haskel A, Short SM, Barnes KR, Lippard SJ. Bioconjugate Chem. 2008;19:39–49. doi: 10.1021/bc070031k. [DOI] [PMC free article] [PubMed] [Google Scholar]
- 19.Feazell RP, Nakayama-Ratchford N, Dai H, Lippard SJ. J Am Chem Soc. 2007;129:8438–8439. doi: 10.1021/ja073231f. [DOI] [PMC free article] [PubMed] [Google Scholar]
- 20.Dhar S, Liu Z, Thomale J, Dai H, Lippard SJ. J Am Chem Soc. 2008;130:11467–11476. doi: 10.1021/ja803036e. [DOI] [PMC free article] [PubMed] [Google Scholar]
- 21.Dhar S, Daniel WL, Giljohann DA, Mirkin CA, Lippard SJ. J Am Chem Soc. 2009;131:14652–14653. doi: 10.1021/ja9071282. [DOI] [PMC free article] [PubMed] [Google Scholar]
- 22.Rodríguez-Fernández E, Manzano JL, Alonso A, Almendral MJ, Pérez-Andrés M, Orfao A, Criado JJ. Curr Med Chem. 2009;16:4314–4327. doi: 10.2174/092986709789578169. [DOI] [PubMed] [Google Scholar]
- 23.Hartwig JF, Pil PM, Lippard SJ. J Am Chem Soc. 1992;114:8292–8293. [Google Scholar]
- 24.Molenaar C, Teuben JM, Heetebrij RJ, Tanke HJ, Reedijk J. J Biol Inorg Chem. 2000;5:655–665. doi: 10.1007/s007750000153. [DOI] [PubMed] [Google Scholar]
- 25.Kalayda GV, Jansen BAJ, Wielaard P, Tanke HJ, Reedijk J. J Biol Inorg Chem. 2005;10:305–315. doi: 10.1007/s00775-005-0643-7. [DOI] [PubMed] [Google Scholar]
- 26.Kalayda GV, Zhang G, Abraham T, Tanke HJ, Reedijk J. J Med Chem. 2005;48:5191–5202. doi: 10.1021/jm050216h. [DOI] [PubMed] [Google Scholar]
- 27.Safaei R, Katano K, Larson BJ, Samimi G, Holzer AK, Naerdemann W, Tomioka M, Goodman M, Howell SB. Clin Cancer Res. 2005;11:756–767. [PubMed] [Google Scholar]
- 28.Marqués-Gallego P, Dulk Hd, Brouwer J, Kooijman H, Spek AL, Roubeau O, Teat SJ, Reedijk J. Inorg Chem. 2008;47:11171–11179. doi: 10.1021/ic8014767. [DOI] [PubMed] [Google Scholar]
- 29.New EJ, Duan R, Zhang JZ, Hambley TW. Dalton Trans. 2009:3092–3101. doi: 10.1039/b821603g. [DOI] [PubMed] [Google Scholar]
- 30.New EJ, Roche C, Madawala R, Zhang JZ, Hambley TW. J Inorg Biochem. 2009;103:1120–1125. doi: 10.1016/j.jinorgbio.2009.05.005. [DOI] [PubMed] [Google Scholar]
- 31.Criado JJ, Fernández ER, Manzano JL, Alonso A, Barrena S, Medarde M, Pelaez R, Tabernero MD, Orfao A. Bioconjugate Chem. 2005;16:275–282. doi: 10.1021/bc049788r. [DOI] [PubMed] [Google Scholar]
- 32.Pérez-Andrés M, Benito JJ, Rodríguez-Fernández E, Corradetti B, Primo D, Manzano JL, Orfao A, Criado JJ. Dalton Trans. 2008:6159–6164. doi: 10.1039/b807965j. [DOI] [PubMed] [Google Scholar]
- 33.Steel PJ, Sumby CJ. Dalton Trans. 2003:4505–4515. [Google Scholar]
- 34.Marti N, Spingler B, Breher F, Schibli R. Inorg Chem. 2005;44:6082–6091. doi: 10.1021/ic050442h. [DOI] [PubMed] [Google Scholar]
- 35.Zhang F, Kirby CW, Hairsine DW, Jennings MC, Puddephatt RJ. J Am Chem Soc. 2005;127:14196–14197. doi: 10.1021/ja055436z. [DOI] [PubMed] [Google Scholar]
- 36.Lavis LD, Raines RT. ACS Chem Biol. 2008;3:142–155. doi: 10.1021/cb700248m. [DOI] [PMC free article] [PubMed] [Google Scholar]
- 37.Moeller N, Kangarloo SB, Puscasu I, Mock C, Krebs B, Wolff JEA. Anticancer Res. 2000;20:4435–4440. [PubMed] [Google Scholar]
- 38.Gangopadhyay SB, Roendigs A, Kangarloo SB, Krebs B, Wolff JEA. Anticancer Res. 2001;21:2039–2044. [PubMed] [Google Scholar]
- 39.Mock C, Puscasu I, Rauterkus MJ, Tallen G, Wolff JEA, Krebs B. Inorg Chim Acta. 2001;319:109–116. [Google Scholar]
- 40.Chang J, Plummer S, Berman ESF, Striplin D, Blauch D. Inorg Chem. 2004;43:1735–1742. doi: 10.1021/ic030242a. [DOI] [PubMed] [Google Scholar]
- 41.Kukushkin VY, Pombeiro AJL, Ferreira CMP, Elding LI, Puddephatt RJ. Inorg Synth. 2002;33:189–196. [Google Scholar]
- 42.Puscasu I, Mock C, Rauterkus MJ, Röndigs A, Tallen G, Gangopadhyay SB, Wolff JEA, Krebs B. Z Anorg Allg Chem. 2001;627:1292–1298. [Google Scholar]
- 43.Uchiyama S, Santa T, Fukushima T, Homma H, Imai K. J Chem Soc, Perkin Trans 2. 1998:2165–2173. [Google Scholar]
- 44.Brannon JH, Magde D. J Phys Chem. 1978;82:705–709. [Google Scholar]
- 45.Eastman JW. Photochem Photobiol. 1967;6:55–72. [Google Scholar]
- 46.Frisch MJ, Trucks GW, Schlegel HB, Scuseria GE, Robb MA, Cheeseman JR, Montgomery JA, Jr, Vreven T, Kudin KN, Burant JC, Millam NM, Iyengar SS, Tomasi J, Barone V, Mennucci B, Cossi M, Scalmani G, Rega N, Petersson GA, Nakatsuji H, Hada M, Ehara M, Toyota K, Fukuda R, Hasegawa J, Ishida M, Nakajima T, Honda Y, Kitao O, Nakai H, Klene M, Li X, Knox JE, Hratchian HP, Cross JB, Bakken V, Adamo C, Jaramillo J, Gomperts R, Stratmann RE, Yazyev O, Austin AJ, Cammi R, Pomelli C, Ochterski JW, Ayala PY, Morokuma K, Voth GA, Salvador P, Dannenberg JJ, Zakrzewski VG, Dapprich S, Daniels AD, Strain MC, Farkas O, Malick DK, Rabuck AD, Raghavachari K, Foresman JB, Ortiz JV, Cui Q, Baboul AG, Clifford S, Cioslowski J, Stefanov BB, Liu G, Liashenko A, Piskorz P, Komaromi I, Martin RL, Fox DJ, Keith T, Al-Laham MA, Peng CY, Nanayakkara A, Challacombe M, Gill PMW, Johnson B, Chen W, Wong MW, Gonzalez C, Pople JA. Gaussian 03, Revision D.01. Gaussian, Inc; Wallingford, CT: 2004. [Google Scholar]
- 47.Ortiz JC, Bo C. Xaim -- X Atoms in Molecules Interface, 1.0. Universitat Rovira i Virgili; Tarragon, Spain: 1998. [Google Scholar]
- 48.Becke AD. Phys Rev A. 1988;38:3098–3100. doi: 10.1103/physreva.38.3098. [DOI] [PubMed] [Google Scholar]
- 49.Lee C, Yang W, Parr RG. Phys Rev B. 1988;37:785–789. doi: 10.1103/physrevb.37.785. [DOI] [PubMed] [Google Scholar]
- 50.Becke AD. J Chem Phys. 1993;98:5648–5652. [Google Scholar]
- 51.Hehre WJ, Ditchfield R, Pople JA. J Chem Phys. 1972;56:2257–2261. [Google Scholar]
- 52.Hehre WJ, Radom L, Schleyer PvR, Pople JA. Ab Initio Molecular Orbital Theory. Jonh Wiley & Sons, Inc; 1986. [Google Scholar]
- 53.Hay PJ, Wadt WR. J Chem Phys. 1985;82:299–310. [Google Scholar]
- 54.Cancés E, Mennucci B, Tomasi J. J Chem Phys. 1997;107:3032–3041. [Google Scholar]
- 55.Böes ES, Livotto PR, Stassen H. Chem Phys. 2006;331:142–158. [Google Scholar]
- 56.Bader RFW. Chem Rev. 1991;91:893–928. [Google Scholar]
- 57.Bader RFW. Atoms in Molecules: A Quantum Theory. Clarendon Press; Oxford, UK: 1994. [Google Scholar]
- 58.Popelier P. Atoms in Molecules: An Introduction. Pearson Education Limited; Manchester, UK: 2000. [Google Scholar]
- 59.SMART, Software for the CCD Detector System, version 5.6. Bruker AXS; Madison, WI: 2000. [Google Scholar]
- 60.Sheldrick GM. SADABS: Area-Detector Absorption Correction. University of Göttingen; Göttingen, Germany: 1996. [Google Scholar]
- 61.Sheldrick GM. SHELXTL-97. University of Göttingen; Göttingen, Germany: 2000. [Google Scholar]
- 62.Sheldrick GM. Acta Crystallogr, Sect A: Found Crystallogr. 2008;64:112–122. doi: 10.1107/S0108767307043930. [DOI] [PubMed] [Google Scholar]
- 63.Spek AL. PLATON, A Multipurpose Crystallographic Tool. Utrecht University; Utrecht, The Netherlands: 2008. [Google Scholar]
- 64.Müller P, Herbst-Irmer R, Spek AL, Schneider TR, Sawaya MR. Crystal Structure Refinement: A Crystallographer’s Guide to SHELXL. Oxford University Press Inc; New York, NY: 2006. [Google Scholar]
- 65.Hirshfeld FL. Acta Crystallogr, Sect A: Found Crystallogr. 1976;32:239–244. [Google Scholar]
- 66.Fanizzi FP, Natile G, Lanfranchi M, Tiripicchio A, Laschi F, Zanello P. Inorg Chem. 1996;35:3173–3182. doi: 10.1021/ic960125y. [DOI] [PubMed] [Google Scholar]
- 67.Tu C, Wu X, Liu Q, Wang X, Xu Q, Guo Z. Inorg Chim Acta. 2004;357:95–102. [Google Scholar]
- 68.Maheshwari V, Bhattacharyya D, Fronczek FR, Marzilli PA, Marzilli LG. Inorg Chem. 2006;45:7182–7190. doi: 10.1021/ic060605h. [DOI] [PubMed] [Google Scholar]
- 69.Pascali SAD, Migoni D, Papadia P, Muscella A, Marsigliante S, Ciccarese A, Fanizzi FP. Dalton Trans. 2006:5077–5087. doi: 10.1039/b610945d. [DOI] [PubMed] [Google Scholar]
- 70.Maheshwari V, Carlone M, Fronczek FR, Marzilli LG. Acta Crystallogr, Sect B: Struct Sci. 2007;63:603–611. doi: 10.1107/S0108768107027024. [DOI] [PubMed] [Google Scholar]
- 71.Sundquist WI, Bancroft DP, Lippard SJ. J Am Chem Soc. 1990;112:1590–1596. [Google Scholar]
- 72.Yao W, Eisenstein O, Crabtree RH. Inorg Chim Acta. 1997;254:105–111. [Google Scholar]
- 73.Hambley TW. Inorg Chem. 1998;37:3767–3774. doi: 10.1021/ic971392m. [DOI] [PubMed] [Google Scholar]
- 74.Zhang Y, Lewis JC, Bergman RG, Ellman JA, Oldfield E. Organometallics. 2006;25:3515–3519. [Google Scholar]
- 75.Brookhart M, Green MLH, Parkin G. Proc Natl Acad Sci U S A. 2007;104:6908–6914. doi: 10.1073/pnas.0610747104. [DOI] [PMC free article] [PubMed] [Google Scholar]
- 76.Kerrison SJS, Sadler PJ. J Chem Soc, Chem Commun. 1977:861–863. [Google Scholar]
- 77.Sundquist WI, Ahmed KJ, Hollis LS, Lippard SJ. Inorg Chem. 1987;26:1524–1528. [Google Scholar]
- 78.Yoo J, Kim JH, Sohn YS, Do Y. Inorg Chim Acta. 1997;263:53–60. [Google Scholar]
- 79.Pregosin PS. Coord Chem Rev. 1982;44:247–291. [Google Scholar]
- 80.Gabano E, Marengo E, Bobba M, Robotti E, Cassino C, Botta M, Osella D. Coord Chem Rev. 2006;250:2158–2174. [Google Scholar]
- 81.Still BM, Kumar PGA, Aldrich-Wright JR, Price WS. Chem Soc Rev. 2007;36:665–686. doi: 10.1039/b606190g. [DOI] [PubMed] [Google Scholar]
- 82.Himel CM, Mayer RT. Anal Chem. 1970;42:130–132. doi: 10.1021/ac60283a038. [DOI] [PubMed] [Google Scholar]
- 83.Hudson EN, Weber G. Biochemistry. 1973;12:4154–4161. doi: 10.1021/bi00745a019. [DOI] [PubMed] [Google Scholar]
- 84.Passaniti P, Maestri M, Ceroni P, Bergamini G, Vögtle F, Fakhrnabavi H, Lukin O. Photochem Photobiol Sci. 2007;6:471–479. doi: 10.1039/b613944b. [DOI] [PubMed] [Google Scholar]
- 85.Matsushita Y, Takahashi M, Moriguchi I. Chem Pharm Bull. 1986;34:333–339. doi: 10.1248/cpb.34.333. [DOI] [PubMed] [Google Scholar]
- 86.Haugland RP, Spence MTZ, Johnson ID, Basey A. The Handbook: A Guide to Fluorescent Probes and Labeling Technologies. 10. Molecular Probes; Eugene, OR: 2005. [Google Scholar]
- 87.Lower SK, El-Sayed MA. Chem Rev. 1966;66:199–241. [Google Scholar]
- 88.Koziar JC, Cowan DO. Acc Chem Res. 1978;11:334–341. [Google Scholar]
- 89.Christoforou AM, Marzilli PA, Marzilli LG. Inorg Chem. 2006;45:6771–6781. doi: 10.1021/ic0606375. [DOI] [PubMed] [Google Scholar]
- 90.Koch U, Popelier PLA. J Phys Chem. 1995;99:9747–9754. [Google Scholar]
- 91.Renfrew AK, Scopelliti R, Dyson PJ. Inorg Chem. 2010;49:2239–2246. doi: 10.1021/ic9020433. [DOI] [PubMed] [Google Scholar]
Associated Data
This section collects any data citations, data availability statements, or supplementary materials included in this article.


