

Abstract
Exercise stress tests have been used for the diagnosis of pulmonary hypertension, but with variable protocols and uncertain limits of normal.
The pulmonary hemodynamic response to progressively increased workload and during recovery was investigated by Doppler echocardiography in 25 healthy volunteers aged from 19 to 62 yrs (mean 36). Mean pulmonary artery pressure (mPAP) was estimated from the maximum velocity of tricuspid regurgitation. Cardiac output (Q) was calculated from the aortic velocity-time integral. Slopes and extrapolated pressure intercepts of mPAP-Q plots were calculated after Poon's adjustment for individual variability. A pulmonary vascular distensibility index α was calculated from each mPAP-Q plot.
mPAP increased from 14 ± 3 to 30 ± 7 mmHg (mean ± SD), and decreased to 19 ± 4 after 5 min recovery. The slope of mPAP-Q was 1.37 ± 0.65 mmHg.min.L-1 with an extrapolated pressure intercept of 8.2 ± 3.6 mmHg and an α of 0.017 ± 0.018 mmHg-1. These results agree with those of previous invasive studies. Multipoint mPAP-Q plots were best described by a linear approximation.
We conclude that exercise echocardiography of the pulmonary circulation is feasible and provides realistic resistance and compliance estimations. Measurements during recovery are unreliable because of rapid return to baseline.
Keywords: pulmonary hypertension, echocardiography, exercise stress test, pulmonary vascular resistance, pulmonary arterial compliance
Introduction
Pulmonary arterial hypertension (PAH) is currently defined by a mean pulmonary artery pressure (mPAP) greater than 25 mmHg, a left atrial pressure (LAP) less than or equal to 15 mmHg and a pulmonary vascular resistance (PVR) greater than 3 Wood units (1). Previous definitions included a mPAP above 30 mmHg at exercise (2), but this has been abandoned because of uncertain limits of normal and unknown symptomatic relevance.
Recently, however, Tolle et al reported on exercise-induced PAH as a new clinical entity characterized by sharp increase in mPAP above 30 mmHg as a cause of decreased exercise capacity (3). In that study, hemodynamic measurements were presented as log-log plots of mPAP as a function of oxygen uptake (VO2), with plateau patterns typical of PAH and takeoff patterns representing a normal response. Since VO2 is related to cardiac output (Q), these patterns would appear at variance with numerous previous studies showing multipoint mPAP-Q plots to be best described by linear or slightly curvilinear approximations (4,5). Reeves et al modeled mPAP as a function of Q invasively measured in exercising normal volunteers, and indeed found a slight curvilinearity which they explained by the natural distensibility of the resistive pulmonary arterioles (6).
Even though the procedure remains unvalidated, Doppler echocardiography is a recommended screening test for PAH (1,2) and has been used in combination with exercise for the diagnosis of overt or latent PAH (7). A systolic PAP (sPAP) of 40 mmHg is usually taken as the upper limit of normal (1,2,7) even though this value may be exceeded by exercising athletes (8).
The purpose of the present investigation was to determine the feasibility of enhancing the methods and maximizing the analyses of exercise stress Doppler echocardiography for the study of the pulmonary circulation,
Methods
Twenty-five consecutive healthy volunteers were studied: 12 women and 13 men, aged 36 ± 14 years (mean ± SD), height of 178 ± 12 cm and weight of 70 ± 15 kg. A written informed consent was obtained in all of them. The study was approved by the Ethical Committee of the Erasme University Hospital. All participants led a healthy lifestyle, with 2 to 5 hours exercise per week, but none were competitive athletes. Three additional young adult volunteers were excluded at initial screening on the basis of their morphology and difficulty in obtaining sufficient quality echocardiographic measurements at rest.
A standard echocardiographic examination was performed at rest, during exercise, and after 5, 10, 15 and 20 min of recovery. The workload was increased by 20 W every 2 min until the maximum tolerated because of dyspnea and/or leg pain. Echocardiographic measurements were taken during the last minute of each workload. Heart rate (ECG lead) and blood pressure (BP) (sphygmomanometry) were recorded at baseline and during the last 15 sec of each workload.
Doppler echocardiography was performed with a Vivid 7 ultrasound system (GE Ultrasound, Norway) on a semi-recumbent cycle ergometer (Ergoline, model 900 EL, Germany), as previously described (7). The exercise table was tilted laterally by 20 to 30 degrees to the left. Cardiac output was estimated from left ventricular outflow tract cross sectional area and pulsed Doppler velocity-time integral measurements (9). Systolic PAP was estimated from a trans-tricuspid gradient calculated from the maximum velocity (V) of continuous Doppler tricuspid regurgitation, as 4 × V2 + 5 mmHg assigned to right atrial pressure (10). Mean PAP was calculated as 0.6 × sPAP + 2 (11). Left atrial pressure (LAP) was estimated from the ratio of mitral E flow-velocity wave and tissue Doppler mitral annulus E′ early diastolic velocity, with LAP = 1.9 + 1.24 E/E′ (12). Pulmonary vascular resistance was calculated as (mPAP − LAP)/Q.
The echocardiographic recordings were stored on optical disks and read by two blinded observers. The intra-observer variabilities were determined on random samples of 10 recordings of 5 successive measurements obtained in the same subjects at rest and at maximum exercise. Variability was calculated as standard deviation (SD) divided by the mean. The inter-observer variabilities were calculated as 1.98 times the square root of the product of SD1 by SD1. SD1 and SD2 are the standard deviations over the means of resting and maximum exercise measurements of mPAP and Q performed by the first and the second reader respectively.
The linearity of mPAP-Q curves was analyzed qualitatively and quantitatively before and after applying Poon's technique using pooled subject data (13). Linear regression was used to determine best fit slope and intercept minimizing the sum of least square error. Following Tolle et al. (3), the slopes of two best fit straight line segments were determined for each mPAP-Q curve after log-log transformation with a similar technique (14). Finally, as previously reported, each multipoint mPAP-Q plot was fit to the equation
where R0 is the total PVR at rest, to calculate a distensibility α index, in % change in diameter per mmHg increase in transmural pressure (6).
Results are presented as mean ± SD. The statistical analysis consisted of a repeated measures analysis of variance. When the F ratio of the analysis of variance reached a P < 0.05 critical value, paired or unpaired modified Student's t-tests were applied as indicated to compare specific situations (15).
Results
Good quality signals were available at all levels of exercise in all the subjects. Taking into account the initial exclusion of three subjects, this corresponds to an 88 % recovery rate. The intra-observer variabilities for sPAP and Q estimates were 4.3 % and 4.0 % at rest, and 8.2 % and 7.7 % at maximum exercise, respectively. The inter-observer variabilities of sPAP and Q estimates were 1.9 % and 4.9 % at rest, and 7.9 % and 13.9 % at maximum exercise, respectively. Mean PAP estimated by the independent blinded observers were 13.3 ± 2.2 and 13.5 ± 2.8 mmHg at rest and 31.8 ± 6.9 and 30.8 ± 7.3 mmHg at maximum exercise (P NS). Mean Q estimated by the independent blinded observers were 4.7 ± 1.0 and 4.8 ± 0.97 L/min at rest, and 17.7 ± 3.9 and 18.0 ± 4.2 L/min at maximum exercise (P NS). Source Doppler tracings and derived mPAP and Q calculations for a representative subject are shown in Fig 1.
Figure 1.
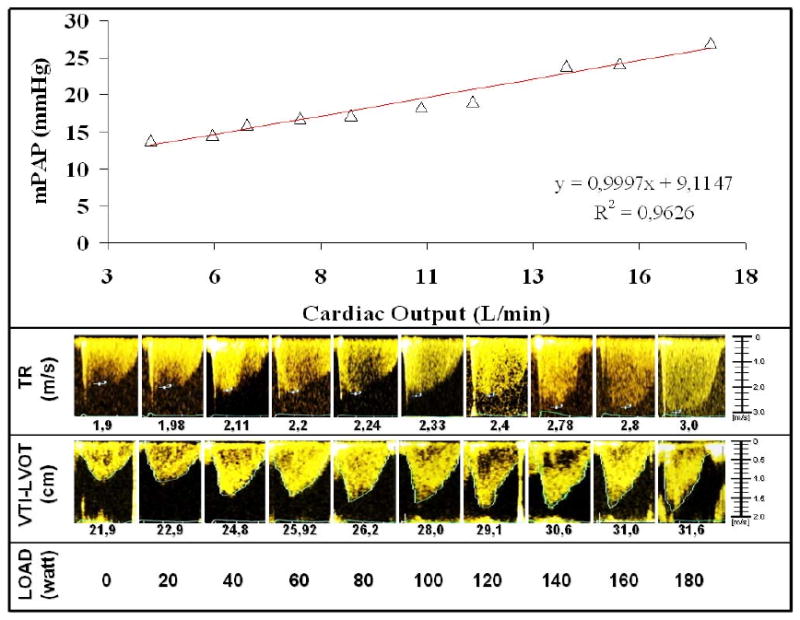
Source Doppler tricuspid regurgitation (TRV) and aortic flow (VTI-LVOT) signals at increased workload and derived mean pulmonary artery pressure (mPAP) and cardiac output calculations for a representative subject. The best fit for the mPAP-cardiac output relationship was linear with a slope of 1 L/min/mmHg and an extrapolated intercept of 9 mmHg.
The maximum achieved workload was 170 ± 51 W. As shown in Table 1, this was accompanied by a four-fold increase in Q, and an increase in sPAP that exceeded 40 mmHg. At maximum exercise, 19 of the subjects had a sPAP > 40 mmHg and 14 of them had a mPAP > 30 mmHg. Both sPAP and Q were markedly decreased after 5 min of recovery, but were still higher than at baseline. After 20 min of recovery, sPAP was back to baseline, but Q remained slightly elevated. Exercise did not affect LAP or PVR.
Table 1.
Hemodynamic measurements at rest, at maximum exercise, and during recovery in 25 normal subjects
| Variables | Baseline | Maximum | 5 min | 10 min | 20 min |
|---|---|---|---|---|---|
| HR, bpm | 66 ± 10 | 159 ± 21* | 92 ± 14* | 88 ± 15* | 79 ± 13* |
| sBP, mmHg | 116 ± 9 | 169 ± 17* | 121 ± 11* | 115 ± 10 | 113 ± 11 |
| sPAP, mmHg | 19 ± 5 | 46 ± 11* | 27 ± 7* | 24 ± 6* | 20 ± 5 |
| LAP, mmHg | 8 ± 2 | 9 ± 1 | 8 ± 2 | 8 ± 1 | 8 ± 1 |
| Q, L/min | 4.7 ± 1.0 | 18.0 ± 4.2* | 7.2 ± 1.8* | 6.4 ± 1.8* | 5.3 ± 1.2* |
| PVR, WU | 1.2 ± 0.6 | 1.2 ± 0.5 | 1.4 ± 0.6 | 1.3 ± 0.6 | 1.2 ± 0.7 |
Abbreviation: HR: heart rate; sBP: systolic blood pressure; sPAP: systolic pulmonary artery pressure; Q: cardiac output; PVR: pulmonary vascular resistance, WU: Wood units, or mmHg/L/min.
P< 0.05 compared to baseline
The mPAP-Q relationships were well fit by the distensibility equation, which imposed a curvilinear, convex downward shape (Fig 2). Each mPAP-Q plot was also well described by a linear approximation. The average slope was 1.37 ± 0.65 mmHg min/L, and intercept 8.2 ± 3.6 mmHg, with a correlation coefficient R2 of 0.92 ± 0.06 (P = 0.0018 ± 0.005). After Poon's adjustment, the slope of a line best fit to pooled data was 1.32 mmHg min/L and the intercept 8.2 mmHg, with a R2 value of 0.95 and a P < 0.0001 (Fig 2). The average distensibility coefficient α for all subjects was 0.017 ± 0.018 mmHg-1.
Figure 2.
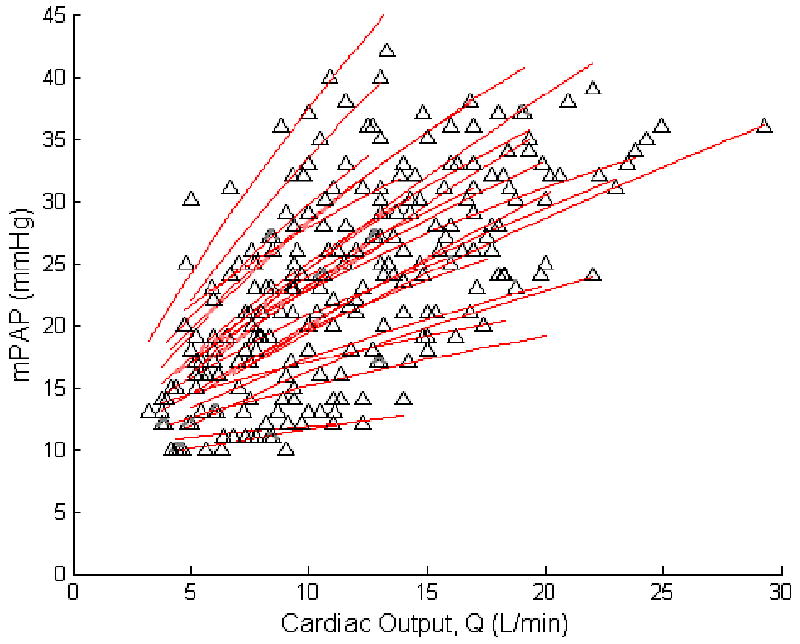
Mean pulmonary artery pressure (mPAP) and cardiac output (Q) measurements at rest and at progressively increased workload in 25 healthy subjects. By best fit to a simple model of pulmonary vascular distensibility, a slight curvilinearity with convexity to the pressure axis can be seen in mPAP-Q relationships.
After log-log transformation of mPAP and Q, an inflection point could be discerned, with a plateau pattern (slope before inflection point, m1, > slope after inflection point, m2) in 11 subjects and an m1 < m2 takeoff pattern in 14 subjects (Fig 3). These patterns seen in the mPAP-Q relationships before log transformation as well. The patterns were not correlated to baseline PVR, slope of mPAP-Q or maximum workload.
Figure 3.
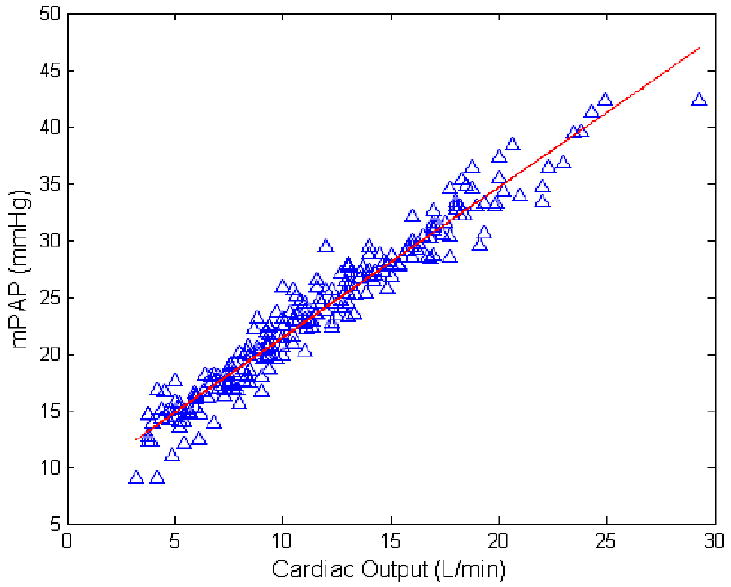
Poon-adjusted mean pulmonary artery pressure (mPAP) as a function of cardiac output (Q) measurements at rest and at progressively increased workload in 25 healthy subjects. The slope was 1.32 mmHg.min/L and the intercept 8.2 mmHg
The relationships between workload and sPAP and Q were highly linear, with slopes of sPAP vs. Q of 1.93 ± 0.19 mmHg.min/L (R2 = 0.92 ± 0.06; P < 0.005), sPAP vs. workload of 0.17 ± 0.07 mmHg/W (R2 = 0.95 ± 0.04; P < 0.001).
Discussion
The present findings demonstrate that exercise stress echocardiography is feasible for studying the pulmonary circulation and provides realistic values compared to those obtained by invasive hemodynamic measurements.
The subjects in the present study exercised in a semi-recumbent position, in contrast to previous reports of upright exercise hemodynamics (3-5). However, this would affect the relation between mPAP and Q only at rest, probably by some degree of de-recruitment of the pulmonary resistive vessels at a lower Q in the upright position (4,5,16). The relationship between mPAP and Q has been shown to be independent of body position during exercise because of increased Q and associated full recruitment of the pulmonary circulation. (4,5,16).
Exercise-induced PAH has been recently described as a clinical entity characterized by decreased exercise capacity and explained by an excessive increase in mPAP at exercise often accompanied by a decrease in right ventricular function (3). In that study, exercise measurements were presented as log-log plots of mPAP vs VO2, with takeoff patterns in 14 of 15 normal subjects and frequent plateau patterns (in 32 of 78 patients) with exercise-induced PAH. The plateau pattern was associated with a greater reduction in exercise capacity and higher PVR. In the present study, VO2 was not measured and patterns of log mPAP vs log Q were analysed instead, but it is assumed that this should not affect the relationship as VO2 and Q are tightly correlated (3,4). We found that takeoff and plateau patterns were about equally frequent in normal subjects and evident shown in log-log transformed data. However, the patterns were unrelated to incremental resistance and workload, which leaves uncertainty as to their functional significance. Patterns could be artifactual in relation to non-linear relationship between VO2 and Q at the highest level of exercise (17) and log-log transform enhancement (18). There could also have been a problem of decreased accuracy of Q measurements by Doppler echocardiography at exercise in the present study. However, no patterns were identified in previously reported in vivo or in vitro multipoint mPAP–Q relationships (5,18), and could not be identified either in a recent study which confirmed the clinical relevance of exercise-induced pulmonary hypertension in scleroderma patients (19).
Pulmonary vascular pressure-flow relationships have been until now best described by a linear approximation, with an extrapolated pressure intercept either equal to or slightly higher than resting LAP (4,5). This is explained by the combined effects of resistance and distension. A previous analysis of invasive hemodynamic measurements at exercise in normal subjects showed a slope of mPAP-Q of 0.94 ± 9.4 mmHg.min/L with an extrapolated pressure intercept of 8.2 ± 7.9 mmHg in 63 young adults, and a slope of 2.54 ± 0.77 mmHg.min/L with a pressure intercept of 2.3 ± 5.4 mmHg in 14 older subjects (4). The average slope of mPAP-Q of 1.37 mmHg min/L in the present study on more middle aged subjects agrees with these previous invasive measurements.
The present results also support the notion that multipoint mPAP-Q relationships are slightly curvilinear (5). In vitro studies have shown that pulmonary arterial distensibility α is constant at a value of 0.02 mmHg-1 from one species to another, including humans (6). In other words, on average and over the linear portion of the pressure-diameter curve, normal resistive pulmonary arteries distend by 2 % of their initial diameter for each mmHg increase in transmural pressure. The same α of 0.02 mmHg-1 has been recalculated from invasive pressure and flow measurements (6). The present noninvasive measurements allowed for the calculation of a distensibility α coefficient calculation that was strikingly similar, which does not prove, but strongly support their validity. Given the complexity of the equation used to calculate α, such a close agreement would indeed be very unlikely to occur by chance.
The distensibility coefficient α has been shown by invasive studies to decrease with aging and with chronic hypoxic exposure (6). Log α was recently reported to be inversely correlated to pulmonary arterial pulse pressure as an independent prognostic factor in severe pulmonary hypertension (20). The clinical relevance of noninvasive determinations of pulmonary arterial distensibility deserves further investigations.
Exercise stress echocardiography in clinical practice is often limited to measurements of peak sPAP and workload. The present results underscore the importance of cardiac output measurements, which is essential for describing incremental resistance, considering that stroke volume and cardiac output vary greatly a given workload.
We calculated mPAP from sPAP on the basis of previously validated equation derived from tight correlations demonstrated with invasive pulmonary hemodynamic measurements at rest and at exercise, with and without different types of pulmonary vascular disease (11,21). It is interesting that derived mPAP calculations still led to realistic pulmonary arterial distensibility estimates.
In the present study, LAP estimated by the E/E′ ratio did not increase with exercise, which seems at variance with previous invasive studies (4,5). Previous validation studies compared E/E′ to wedged PAP (12,22). Wedged PAP measurements in these studies were actually performed with balloon-tipped pulmonary artery catheters, yielding balloon-occluded PAP previously shown to be an excellent surrogate measurement of LAP in zone III perfused lungs in a variety of pathophysiological circumstances (5). However, estimation of wedged PAP or LAP from E/E′ has been reported to suffer from a large confidence interval estimated by a SD of ± 3.8 mmHg on the mean rest (12) and there is an absence of linear relationship between E/E′ and wedged PAP at exercise (22). These are important limitations to the estimation of LAP at exercise in the present study, and may have accounted for the absence of expected decreased in PVR. It is of interest that this limitation did not affect distensibility calculations, in keeping with the notion of mPAP as the major determinant of pulmonary arterial compliance at the site of resistance (5). On the other hand, more recent invasive hemodynamic measurements in physically fit normal subjects indicate that at the average workoad of 170 W and cardiac output of 20 L/min reached in the present study, LAP may remain unchanged as compared to supine resting baseline (16). Absence of change or only slight increase in LAP would be undetected by changes in E/E′. Uncertainty on the estimation of LAP probably also contributed to the observed large confidence intervals on the distensibility α calculations.
Exercise echocardiography takes time (on average 40 min per subject in the present study), is technically demanding and requires considerable training and experience. This is why in some centers measurements are not often performed during exercise but instead immediately after. Our finding that sPAP has a rapid but variable return to resting baseline suggests that this approach would have a poor reliability to characterize exercise-induced pulmonary hypertension.
Doppler echocardiography has been considered less than adequate for the study of the pulmonary circulation (1-3). Concerns include poor quality control and technical demands, excessive proportion of false positives and negatives as a screening tool for pulmonary hypertension (23) and sub-optimal recovery rates of tricuspid regurgitant jets, particularly in normal subjects or in patients with obstructive lung diseases (24). However, a large scale collaborative European study recently demonstrated how exercise echo-Doppler measurements of sPAP can be used to identify normal and abnormal pulmonary vascular reactivity in family members of patients with idiopathic PAH, especially in carriers of the bone morphogenetic protein-2 mutation (25). In that multicenter study, only 15 % of subjects had inadequate tricuspid velocity signals. We have demonstrated that a high level of training and dedication allows for a 88 % of recovery of good quality signals for the study of pulmonary hemodynamics in normal subjects, at rest and during exercise.
Figure 4.
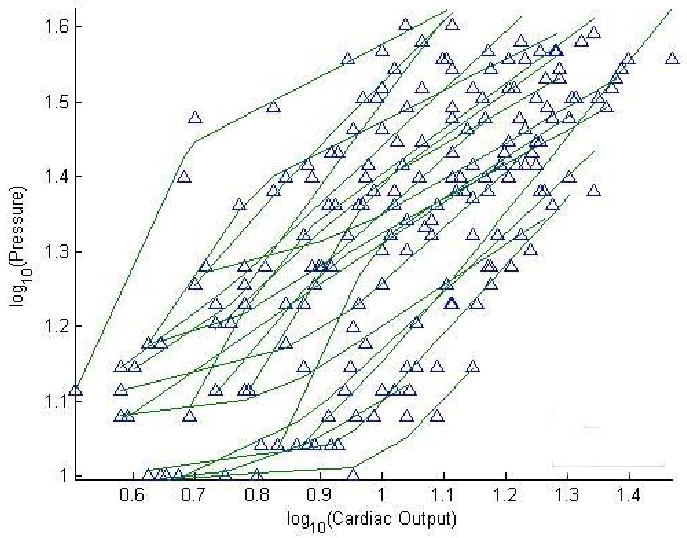
Log mean pulmonary artery pressure as a function of log cardiac output measurements at rest and at progressively increased workload in 25 healthy subjects. Takeoff and plateau patterns can be identified in 14 and 11 subjects, respectively.
Acknowledgments
The authors also wish to thank Marie-Amelie Witters for technical assistance.
Pascale Jespers helped in the preparation of this report.
Funding Sources: NIH (R01HL086939, NCC); Fulbright Foundation (NCC), Funds of Cardiac Surgery Belgium (PU, RN), FRSM (3.4637.09, RN).
References
- 1.McLaughlin VV, Archer SL, Badesch DB, et al. ACCF/AHA 2009 Expert Consensus Document on Pulmonary Hypertension. A Report of the American College of Cardiology Foundation Task Force on Expert Consensus Documents and the American Heart Association. Circulation. 2009;119:2250–94. doi: 10.1161/CIRCULATIONAHA.109.192230. [DOI] [PubMed] [Google Scholar]
- 2.Galie N, Torbicki A, Barst R, et al. The Task Force on Diagnosis and Treatment of Pulmonary Arterial Hypertension of the European Society of Cardiology. Eur Heart J. 2004;25:2243–78. doi: 10.1016/j.ehj.2004.09.014. [DOI] [PubMed] [Google Scholar]
- 3.Tolle JJ, Waxman AB, Van Horn TL, Pappagianopoulos PP, Systrom DM. Exercise-induced pulmonary arterial hypertension. Circulation. 2008;118:2183–9. doi: 10.1161/CIRCULATIONAHA.108.787101. [DOI] [PMC free article] [PubMed] [Google Scholar]
- 4.Reeves JT, Dempsey JA, Grover RF. Pulmonary circulation during exercise. In: Weir EK, Reeves JT, editors. Pulmonary Vascular Physiology and Physiopathology. chap 4. Marcel Dekker; New York: 1989. pp. 107–133. [Google Scholar]
- 5.Naeije R. Pulmonary vascular function. In: Peacock AJ, Rubin LJ, editors. Pulmonary Circulation. Diseases and their Treatment. 2nd. chap 1. Arnold; London: 2004. pp. 3–13. [Google Scholar]
- 6.Reeves JT, Linehan JH, Stenmark KR. Distensibility of the normal human lung circulation during exercise. Am J Physiol Lung Cell Mol Physiol. 2005;288:L419–25. doi: 10.1152/ajplung.00162.2004. [DOI] [PubMed] [Google Scholar]
- 7.Grunig E, Janssen B, Mereles D, et al. Abnormal pulmonary artery pressure response in asymptomatic carriers of primary pulmonary hypertension gene. Circulation. 2000;102:1145–50. doi: 10.1161/01.cir.102.10.1145. [DOI] [PubMed] [Google Scholar]
- 8.Bossone E, Rubenfire M, Bach DS, Ricciardi M, Armstrong WF. Range of tricuspid regurgitation velocity at rest and during exercise: implications for the diagnosis of pulmonary hypertension. J Am Coll Cardiol. 1999;33:1662–6. doi: 10.1016/s0735-1097(99)00055-8. [DOI] [PubMed] [Google Scholar]
- 9.Christie J, Sheldahl LM, Tristani FE, Sagar KB, Ptacin MJ, Wann S. Determination of stroke volume and cardiac output during exercise: comparison of two-dimensional and Doppler echocardiography, Fick oximetry, and thermodilution. Circulation. 1987;76:539–47. doi: 10.1161/01.cir.76.3.539. [DOI] [PubMed] [Google Scholar]
- 10.Yock PG, Popp RL. Noninvasive estimation of right ventricular systolic pressure by Doppler ultrasound in patients with tricuspid regurgitation. Circulation. 1984;70:657–62. doi: 10.1161/01.cir.70.4.657. [DOI] [PubMed] [Google Scholar]
- 11.Chemla D, Castelain V, Humbert M, et al. New formula for predicting mean pulmonary artery pressure using systolic pulmonary artery pressure. Chest. 2004;126:1313–7. doi: 10.1378/chest.126.4.1313. [DOI] [PubMed] [Google Scholar]
- 12.Nagueh S, Middleton K, Kopelen H, et al. Doppler tissue imaging: a noninvasive technique for evaluation of left ventricular relaxation and estimation of filling pressures. J Am Coll Cardiol. 1997;30:1527–33. doi: 10.1016/s0735-1097(97)00344-6. [DOI] [PubMed] [Google Scholar]
- 13.Poon CS. Analysis of linear and mildly nonlinear relationships using pooled subject data. J Appl Physiol. 1988;64:854–8. doi: 10.1152/jappl.1988.64.2.854. [DOI] [PubMed] [Google Scholar]
- 14.Orr GW, Green HJ, Hughson RL, Bennett GW. A computer linear regression model to determine ventilatory anaerobic threshold. J Appl Physiol. 1982;52:1349–52. doi: 10.1152/jappl.1982.52.5.1349. [DOI] [PubMed] [Google Scholar]
- 15.Winer BJ, Brown DR, Michels KM. Statistical principles in experimental design. 3rd. Mc Graw-Hill; New York: 1991. pp. 220–283. [Google Scholar]
- 16.Stickland MK, Welsh RC, Petersen SR, et al. Does fitness level modulate the cardiovascular hemodynamic response to exercise? J Appl Physiol. 2006;100:1895–901. doi: 10.1152/japplphysiol.01485.2005. [DOI] [PubMed] [Google Scholar]
- 17.Wong YY, van der Laarse WJ, Vonk-Noordegraaf A. Reduced systemic oxygen extraction does not prove muscle dysfunction in PAH (letter to the editor) Med Sci Sports Exerc. 2008;40:1554. doi: 10.1249/MSS.0b013e31817e0fac. [DOI] [PubMed] [Google Scholar]
- 18.Naeije R, Melot C. On exercise-induced pulmonary hypertension (letter to the editor) Circulation. doi: 10.1161/CIRCULATIONAHA.108.846287. In press. [DOI] [PubMed] [Google Scholar]
- 19.Kovacs G, Maier R, Aberer E, et al. Borderline pulmonary arterial pressure is associated with decreased exercise capacity in scleroderma. Am J Respir Crit Care Med. 2009;180:881–6. doi: 10.1164/rccm.200904-0563OC. [DOI] [PubMed] [Google Scholar]
- 20.Blyth KG, Syyed R, Chalmers J, et al. Pulmonary arterial pulse pressure and mortality in pulmonary arterial hypertension. Respir Med. 2007;101:2495–501. doi: 10.1016/j.rmed.2007.07.004. [DOI] [PubMed] [Google Scholar]
- 21.Syyed R, Reeves JT, Welsh D, Raeside D, Johnson MK, Peacock AJ. The relationship between the components of pulmonary artery pressure remains constant under all conditions in both health and disease. Chest. 2008;133:633–9. doi: 10.1378/chest.07-1367. [DOI] [PubMed] [Google Scholar]
- 22.Talreja DR, Nishimura RA, Oh JK. Estimation of left ventricular filling pressure with exercise by Doppler echocardiography in patients with normal systolic function: a simultaneous echocardiographic-cardiac catheterization study. J Am Soc Echocardiogr. 2007;20:477–79. doi: 10.1016/j.echo.2006.10.005. [DOI] [PubMed] [Google Scholar]
- 23.Arcasoy SM, Christie JD, Ferrari VA, et al. Echocardiographic assessment of pulmonary hypertension in patients with advanced lung disease. Am J Respir Crit Care Med. 2003;167:735–40. doi: 10.1164/rccm.200210-1130OC. [DOI] [PubMed] [Google Scholar]
- 24.Fisher MR, Forfia PR, Chamera E, et al. Accuracy of Doppler echocardiography in the hemodynamic assessment of pulmonary hypertension. Am J Respir Crit Care Med. 2009;179:615–21. doi: 10.1164/rccm.200811-1691OC. [DOI] [PMC free article] [PubMed] [Google Scholar]
- 25.Grünig E, Weissmann S, Ehlken N, et al. Stress-Doppler-echocardiography in relatives of patients with idiopathic and familial pulmonary arterial hypertension: results of a multicenter European analysis of pulmonary artery pressure response to exercise and hypoxia. Circulation. 2009;119:1747–57. doi: 10.1161/CIRCULATIONAHA.108.800938. [DOI] [PubMed] [Google Scholar]