


Abstract
Alternative splicing, polyadenylation of pre-messenger RNA molecules and differential promoter usage can produce a variety of transcript isoforms whose respective expression levels are regulated in time and space, thus contributing specific biological functions. However, the repertoire of mammalian alternative transcripts and their regulation are still poorly understood. Second-generation sequencing is now opening unprecedented routes to address the analysis of entire transcriptomes. Here, we developed methods that allow the prediction and quantification of alternative isoforms derived solely from exon expression levels in RNA-Seq data. These are based on an explicit statistical model and enable the prediction of alternative isoforms within or between conditions using any known gene annotation, as well as the relative quantification of known transcript structures. Applying these methods to a human RNA-Seq dataset, we validated a significant fraction of the predictions by RT-PCR. Data further showed that these predictions correlated well with information originating from junction reads. A direct comparison with exon arrays indicated improved performances of RNA-Seq over microarrays in the prediction of skipped exons. Altogether, the set of methods presented here comprehensively addresses multiple aspects of alternative isoform analysis. The software is available as an open-source R-package called Solas at http://cmb.molgen.mpg.de/2ndGenerationSequencing/Solas/.
INTRODUCTION
Alternative splicing (AS) is the mechanism by which a common precursor mRNA produces different mRNA variants, by extending, shortening, skipping, or including exon, or retaining intron sequences. The combinatorics of such AS events generates a large variability at the post-transcriptional level accounting for an organism’s proteome complexity (1,2). Besides AS, other biological mechanisms shape the transcriptome, like alternative first or last exon usage or alternative polyadenylation of exons (3,4). Altogether, these events are summarized as alternative exon events (AEEs). Various gene isoforms generated by AEEs have specific roles in particular cell compartments, tissues, stages of development, etc. In addition, many diseases (e.g. cancer) have been related to alterations in the splicing machinery, highlighting the relevance of AS to therapy (5–7).
It has been previously estimated that 75–92% of all human genes give rise to multiple transcripts (8–10). Up to now, systematic analysis of alternative isoforms was based on the analysis of expressed sequence tags (ESTs), or on microarray experiments. ESTs have been initially used for the detection and prediction of alternative splice forms in different organisms and cell types (1,11–13). However, this approach showed inherent limitations associated with cloning strategies, non-uniform transcript coverage and low abundance for individual tissues (11,14). More recently, alternative isoforms have been analysed by microarrays using exon body probes (exon arrays) and/or probes spanning splice junctions (exon junction arrays) (8,12,15–17). Custom arrays, combining exon body and splice junction probes have been used for quantifying isoform expression levels (18). In parallel, the standard platform provided by the Affymetrix human exon array allows the monitoring of 106 exons derived from 18 000 known genes and approximately 262 000 predicted transcripts (19). However, several problems inherent to the use of arrays, such as probe hybridization behaviour, cross hybridization of related probes and deconvoluting signal-to-noise ratios (14) are difficult to overcome. For instance, for the human Affymetrix exon arrays, the validation rate ranges from 33% (20) to 86% (19). Besides, the computational analysis of exon arrays remains a complex task (21,22).
Second-generation sequencing represents an invaluable advance for analysing the transcriptome and the repertoire of AEEs. RNA-Seq experiments provide in-depth information on the transcriptional landscape with unprecedented sensitivity and throughput (23–30). RNA-Seq data allow the direct detection of AS events using the reads mapping at splice junctions, specifying both known as well as novel AS forms (9,10). However, a comprehensive survey of AS by junction reads is intrinsically dependent on the sequencing depth. Typical sequencing depths with one or two lanes might only provide reads specifying approximately half of the exon–exon junctions occurring within a cell.
Here, we provide a set of methods that enable the detection and quantification of AEEs within or between conditions using a given gene annotation. The Cell type-specific Alternative uSage Index (CASI) predicts AEEs within a given condition, e.g. one cell line. The PrOportion EstiMation method (POEM) enables the relative quantification of known transcript structures within a given condition. Finally, the Differential Alternative uSage Index (DASI) predicts AEEs differentiating two conditions, e.g. between two cell lines.
All methods are based on a stochastic model of the read distribution along a transcript and show high robustness based on simulations. We applied the methods on a previously published RNA-Seq dataset from two human cell lines (27). We predicted several thousands of AEEs and estimated isoform abundance for sufficiently expressed genes. Further, we validated our predictions and estimations by RT-PCR experiments on more than 100 cases. The robustness of the methods was additionally assessed by bootstrapping.
We report the first comparison of splicing prediction by RNA-Seq and exon arrays, showing that RNA-Seq is more sensitive and estimates exon expression values with higher accuracy. In summary, we provide a versatile and reliable set of tools that covers multiple aspects of alternative isoform analysis, which is available as an open-source package called Solas at http://cmb.molgen.mpg.de/2ndGenerationSequencing/Solas/.
MATERIALS AND METHODS
Transcript sampling model
All reads from an RNA-Seq experiment are of the same length r (usually around 30–36 bp). Due to the nature of the RNA-Seq protocol, which involves random shearing of the messenger RNA molecules, we consider that the set of sequenced fragments is picked randomly out of a bag of transcript positions. First, the total number of reads  covering a gene is determined by a Poisson process:
  , where s is the total length of the gene, p is the relative proportion and λ is a normalizing factor related to sampling depth. The Poisson framework suits especially for low-coverage datasets, where a normal distribution cannot serve as a good approximation (31). This model has already been proposed for abundance of EST data (32), as well as SAGE libraries (33). For ease of notation, the approach is described for one gene, but all formulas can be extended for a set of genes.
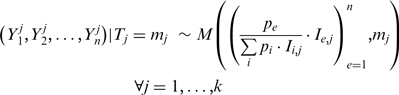
Due to the hypothesis that the reads are positioned randomly along every transcript, the number of observed reads within exons  is drawn according to a multinomial distribution
  . The probability
  that a read falls in exon e is parameterized for every gene according to the properties of the RNA-Seq experiment. An obvious parameter for
  is the effective length
  of an exon. The effective exon length corrects for exonic regions where reads of length
  cannot be uniquely mapped due to highly homologous gene families, pseudogenes and low sequence complexity. Any other information affecting the read coverage—such as GC bias or a bias specific to the protocol used—can be included in the definition of effective exon length. Finally, we define the normalized expression
  of an exon e as the exon read count normalized by the exon relative proportion and the gene size:
| (1) |
We first provide a test framework to detect AEEs occurring within a given cell type (CASI method) or related to the presence of different isoform patterns between two cell types (DASI method). In both cases, a two-step procedure was applied, which (i) detects genes with AEEs based on CASI and DASI p-values and (ii) highlights exons predicted to be alternative according to a z-score statistic. The z-score statistic is computed for each exon e as:
| (2) |
where R is defined according to each exon log normalized expression or expression ratio (see below). We use the median and maximum absolute deviation (MAD) as robust estimates of mean and standard deviation to avoid a bias for genes with few exons. This statistics assumes that the majority of the exons are constitutive.
Alternative exon usage within a condition (CASI)
Under the null hypothesis that one transcript uses all the exons of the gene, the counts within exons follow a multinomial of parameters  and
and  . The presence of AEEs within a condition was assessed by using Pearson’s chi-square test on
  , where the p-value was corrected for multiple testing using the Benjamini–Hochberg procedure (34). Only genes with at least two expressed exons were tested. A gene with a small CASI p-value means either that (i) two or more transcripts from one gene are present or (ii) one isoform is present but only a subpart of one of its exons is expressed. Case (ii) can correspond to events of alternative donor or acceptor sites, where only a part of the exon is expressed. The
  score (CASI) is computed for each exon, according to its log-normalized expression
  = log(
 ). Exons with less than five counts were not considered for CASI computation. The CASI p-value was set to 0.05.
Alternative exon usage between two conditions (DASI)
Two observed read distributions  and
and  were considered for the same gene in two different experiments. The difference in exon usage pattern between the two conditions was analysed for every gene conditionally on its expression in both conditions. The presence of differential AEEs was assessed with the FDR-corrected p-value of Fisher’s exact test (34). Every exon
  of the gene was assigned a
  score (DASI) based on the log-ratio
  of reads between the two experiments.
Exons with less than five read counts in both conditions were not considered. A pseudo count of 1 was added to  and
and  if its original value was 0. The DASI p-value was set to 0.05 and the |DASI| ≥ 2. Genes showing a significant difference between the two biological replicates were removed from the DASI analysis.
Quantification of isoform levels (POEM)
Under the assumption that  different transcript variants with counts
  are expressed, the structure of each transcript is given and described by the matrix of binary values
  , such that
  if form
  uses exon
  . The read counts
  in a single exon are the sum of all transcript reads falling within the exon:
| (3) |
Substituting  and
and  by their expected values, unique mean estimates of the
  can be obtained by solving a linear system, given that the matrix
  is of full rank. We employed an Expectation–Maximization (EM) strategy for maximizing the likelihood and to infer the unobserved transcript proportions. The counts
  of form
  in exon
  are fully described by the following hierarchical model:
| (4) |
 |
(5) |
where  is the relative proportion of form
  and
and  is a normalizing factor accounting for the depth of sequencing and the length of the transcript. Given the marginal counts
  , the aim is to infer the expected counts for each exon per transcript. A condition of identifiability for the parameters (and thus to unambiguously identify the transcript proportions) is the linear independence of the rows of the indicator matrix
  (35). An EM algorithm was used to estimate the proportions of each form
  . The EM update formulas and the method to derive a quality score for each gene are described in Supplementary Material.
The CASI analysis showed that large modifications are occurring on the most 3′- or 5′-exons. We, therefore, specifically focused POEM estimation based on information from internal exons, by artificially removing the first and last exon of every transcript before POEM estimation.
Simulations based on a gene model
In order to assess the accuracy for different methods, we simulated a single exon skipping event for a template gene model. The inclusion rate of the exon as well as the length of the skipped exon and the gene expression level varied. Reads were drawn randomly along exons of the gene according to the distribution introduced previously. Noise was introduced in the model by choosing one exon at random and artificially modifying the proportion of reads mapping to it by 20%.
The simulations for CASI assumed a gene with six exons and a length of 150 bp per exon. We simulated different expression levels on two isoforms (proportion 0.05–0.95) such that the total read number in all exons was 300. We evaluated the proportion of genes detected by CASI where the skipped exon was properly flagged as an AEE (sensitivity) and the proportion of genes detected where only the skipped exon was predicted as an AEE (specificity). For different levels of noise, we performed 500 simulations on 1000 genes.
The simulations for POEM assumed a gene of 1200-bp length. We varied the length of the skipped exon (120, 240 and 360 bp), the exon inclusion rate (20 and 80%) and the gene expression level (100–600 reads) to assess their impact on the estimation error rate. Two thousand simulations were performed for each combination of the parameters. Box plots are drawn according to the following definition: the box describes 50% of the distribution, the line displays the median and whiskers display the 1.5 interquartile range. Remaining outliers are shown as dots.
Simulations based on ENSEMBL transcripts
We performed a study on the database of annotated transcripts (see below) to monitor the error on proportion estimation with POEM as a function of gene expression. The number of expressed isoforms was fixed to two, and the relative proportions were incremented in steps of equal size from 16.7% to 83.3% (10 000 runs for each combination). The sampling of the transcripts was done hierarchically. First, a gene was chosen uniformly among all genes annotated with more than two isoforms in ENSEMBL. Then, two transcripts were uniformly sampled among the annotated isoforms of the gene.
A bootstrap procedure for robustness assessment
Local nonhomogeneity of the read distribution along a transcript could lead to false positive predictions. Possible sources for an uneven read distribution along a transcript are preferred break points of the RNA fragments in the sample preparation step or a higher sequencing efficiency for short cDNA fragments with certain sequence characteristics (25,36). We ruled out that such unevenness affects our predictions by performing a bootstrap procedure for each gene.
For each bootstrap sample (total of 500), each exon of a given gene was randomly picked, with a probability of 0.25, and shortened on one end by 5, 10, 15 and 20%. Only exons with more than 80 unique positions were shortened. The read count and the number of possible unique positions were recomputed for each shortened exon and treated as a new transcript annotation set. The prediction was repeated on every new transcript annotation set.
Transcript and AEEs database construction
Annotation of transcript structures for POEM (i.e. the indicator matrix  ) was deduced from ENSEMBL, version 46. To allow description of any possible isoform (for instance, alternative donor and alternative acceptor sites), exons overlapping with different boundaries across isoforms were further subdivided. Redundant transcripts were filtered out. Two transcripts were recursively clustered when the sequence identity, relative to the mean length of both transcripts, was at least 95%. A representative of each cluster was chosen by taking the union of the corresponding rows in
  . The number of genes with identifiable transcripts was counted by computing the rank of the indicator matrix (qr function in R).
The annotation of exon boundaries for CASI and DASI, including the counting of nonunique positions and treatment of overlapping genes, was done as reported previously (27).
The set of genes with APSs was derived from EST data taken from the GeneNest database (37) and was independently screened for putative polyadenylation signals (AAUAAA and AUUAAA). To generate a high-confidence set, only EST sequences annotated as 3′-ends and aligned in the appropriate orientation were selected. A reliable polyadenylation signal was defined when at least two ESTs carried a putative polyadenylation signal within their 3′-terminus (less than 35 bp) at the same position in the cDNA consensus sequence. Signals not supported by the respective genomic sequence were rejected.
The set of genes with alternative TSSs was derived from EST consensus sequences that were mapped to the human genome. For each ENSEMBL gene, only consensus sequences covering at least two exons and with an exon boundary quality ≥50 (11) were selected. The 5′-termini of mutually exclusive first exons of these consensus sequences were defined as putative TSS.
Read alignment and splice junction annotation
Read sequences of length 27 bp were retrieved from the Gene Expression Omnibus database (GSE11892) and aligned against HG18 with Eland from the Illumina company allowing up to two substitution errors for a match. Only unique read matches were retained. Transcript annotation was based on all transcripts in ENSEMBL version 46. Splice junction annotation was derived by mapping reads as set of synthetical splice junctions that were generated for all possible exon–exon junctions for annotated exons of one gene [similar to (27)]. AEEs identified by splice junctions were defined as follows: each splice junction with a minimum support of three reads was recorded and an exon that was span by more than one such splice junction was flagged as an AEE.
POEM validation
Reads mapping to splice junctions were used to directly quantify AEEs by computing the proportion of reads mapping to the constitutive junction. We averaged the proportions deduced from both splice junction read counts identifying the same AEE. An illustrative example is shown in Figure 4, where the inclusion rate of exon 5 (0.84) was calculated as the average of (i) counts on junctions 4–5 and 4–6 [8 / (8 + 2) = 0.8] and (ii) counts on junctions 5–6 and 4–6 [14 / (14 + 2) = 0.87].
Figure 4.

(A) Plot showing the 90% quantile of the average error for proportion estimation by POEM based on simulations for one gene with one exon-skipping event. The average error (y-axis) is calculated according to the number of total reads in the gene (x-axis) and for various skipped exon lengths: 120 bp (light grey), 240 bp (grey) or 360 bp (black). The average error is shown for a proportion of 20% (dashed lines) and 80% (plain line). (B) This plot shows the 90% quantile of the mean (circles) and maximum (squares) error (y-axis) for POEM on all annotated ENSEMBL (v.46) transcripts. (C) Scatter plot showing the correlation (PCC = 0.65) of inclusion rates (constitutive forms) on 123 AEEs derived from exon–exon junction counts (x-axis) and POEM estimations (y-axis). Cross marks denote AEEs in genes with a quality score ≤ −14. Dashed lines represent the 20% error margin in (C) and (D). (D) Scatter plot showing the correlation (PCC = 0.81) of the inclusion rates on 47 AEEs measured by qPCR (x-axis) and estimated by POEM for a single exon-skipping event (y-axis). Plus marks denote unannotated AEEs in ENSEMBL v.46. (E) POEM estimation for annotated transcripts of MPI in HEK cells. Numbers reported on light blue arrows represent the expected counts on exon–exon junctions according to the estimated proportions with POEM for the three annotated isoforms (ENST000000379693, ENST000000352410 and ENST000000323744). The proportion estimate for each isoform is shown to the right (in percent). qPCR primers were designed to estimate the inclusion rate of exon 2 (‘Materials and Methods’ section). The skipping event of exon 3 was not annotated in ENSEMBL v.46, but was supported by an observed junction read. (F) The bar chart shows the inclusion rate of exon 2 computed by POEM (grey) and measured by qPCR (black) for HEK and B cells.
For qPCR and POEM data comparison, POEM estimates were derived for the skipped and constitutive forms only, irrespective of other transcripts annotated in ENSEMBL.
Sample preparation
The same source of total RNA from HEK and B cells was isolated as described by Sultan et al. (27) and was used for qPCR (DASI and POEM) experiments; the same source of material and one biological replicate was used for exon array hybridization experiments; an independent source of total RNA from HEK and B cell was used for Reverse Transcriptase Polymerase Chain Reaction (RT-PCR) experiments (CASI).
RT
Reverse transcription was carried out using standard conditions. In brief, 1 µg of DNase-treated total RNA sample was reverse-transcribed into first-strand cDNA using random hexamers and SuperscriptII reverse transcriptase (Invitrogen) and subsequently diluted with nuclease-free water (Promega) to 12.5 ng/µl equivalent total RNA.
PCR
Amplification parameters were as follows and were adjusted according to the expected length of the products and to the Tm of the primers: 95°C for 10 min; 35–50 cycles of 95°C for 45 s; 58–60°C for 30 s; and 72°C for 30–120 s, followed by extension at 72°C for 5 min. Reaction products were analysed by agarose gel electrophoresis.
Quantitative PCR
Reactions were performed using the ABI Prism 7900HT Sequence Detection System (PE Applied Biosystems) with 10 µl reaction composed of 1/10 volume of the cDNAs (prepared as described above), 300 nM primers and SYBR Green PCR Master Mix, containing SYBR Green I Dye, AmpliTaq Gold DNA Polymerase, dNTPs with dUTP, passive reference and optimized buffer components (Applied Biosystems). Cycling conditions were 50°C for 2 min, 95°C for 10 min followed by 40 cycles of 94°C for 15 s and 60°C for 1 min. Specificity of PCR amplification was verified by analysis of the melting curve and subsequent electrophoresis on 4% NuSieve:agarose (3:1) gel. Negative controls produced negligible signal detection (38–40 Ct). All reactions were performed in triplicates on 96-well plates. Amplification plots and predicted threshold cycle (Ct) values were obtained with the Sequence Detector Software (SDS version 2.0, PE Applied Biosystems). Further calculations and graphical representations were done using Excel 2004 and R. A common threshold value was chosen for all genes and the baseline was set manually for individual genes. The relative expression calculation method relies on the principle of the comparative Ct method (User Bulletin #2; Applied Biosystems). Ct values were first normalized (ΔCt) to the housekeeping genes (GAPDH) and converted to a relative expression quantity (NE) using the formula NE = 2−ΔCt. A given S1/S2 ratio was calculated by dividing their respective NE values.
Primer design for selected genes
All AEEs for CASI (61) were randomly selected among all events annotated as internal exons with no overlapping annotation for multiple exon skipping. We further selected 16 AEEs out of the highest scoring DASI genes (220), from which we tested the exons exhibiting the maximal absolute DASI. Overall, the major selection criterion for all PCR-based validations was to facilitate the RT-PCR and qPCR primer design and experiments. The amplicons for the selected AEEs had to be approximately 150 bp long and the candidate exon and its flanking exons should not contribute to another splicing event. In other words, we did not cherry-pick the AEEs in order to achieve high validation rates. All primers were designed using the command line version of Genome PRIDE (38), and amplicons were 150 bp long. The forward primers were placed on the alternative exon junctions (S1 and S2 primers), and a single reverse primer was placed in the respective flanking exon (R1 primers) (Supplementary Figure S13). Junction primers were positioned on the junction with a minor 3′-overlap (3 bp) to ensure amplification specificity. S1 and S2 designs were used for RT-PCR and qPCR. For 23 CASI cases, S3 primers were placed in the constitutive, flanking exons and used only for RT-PCR validation. Primer sequences are available in Supplementary Tables S2, S5 and S7.
Exon array analysis
cDNA labelling and microarray hybridization were performed as described in GeneChip® Whole Transcript (WT) Sense Target Labeling Assay Manual following manufacturer’s instructions (P/N 701880 Rev.4, www.affymetrix.com). All four probes were hybridized onto the Human Exon 1.0 ST Array (Affymetrix), and microarrays were scanned with the GeneChip® Scanner 3000 7G (Affymetrix). A model-based analysis for tiling arrays (39) was applied to perform the intrachip normalization, with the adjustment for exon arrays described by Kapur et al. (40). Quantile normalization was then applied between arrays (41) with Affy package in BioConductor (version 2.2) (R statistical environment, v.2.7.0) (42). Detection call p-values were computed for each probe set with a paired Wilcoxon signed rank test that compares probe intensity to control probes of similar GC content. More precisely, each probe is compared with the 75% quantile of the set of control probes with similar GC content. The detection call p-value of a probe set was calculated using the chip-wise pairing of probe intensities to control intensities. An exon or gene probe set was called present when the corresponding FDR corrected p-value was <5% as in Gardina et al. (20). The probe-to-exon and probe-to-gene assignment was done using a chip description file (HsEx10stv2_Hs_ENSE), based on Ensembl v.46, and provided as R package (43). Exon and gene expression were defined as the mean over probe intensities for both replicates.
The isoform predictions were computed with the MIDAS algorithm of the Affymetrix ExAcT software version 1.8.0 (44) on normalized values (see below). MIDAS proceeds in two steps (20,44): (i) attributing a p-value to each exon indicative of an expression change between the two conditions, and (ii) attributing a splicing index (SI) to each exon measuring the amplitude of these expression changes. The p-values were subsequently corrected using the Benjamini–Hochberg procedure (34) and the threshold set to 0.2. This threshold was chosen as only one gene was found with a corrected p-value <0.05. The threshold for the SI (|SI| ≥ 0.5) was set as reported previously (20). The following filters were further applied: (i) the corresponding gene is expressed in both conditions, (ii) gene expression is higher than the 50% quantile in both conditions and (iii) the exon is called present in either one of the two conditions.
RESULTS
A general stochastic count model for transcriptome analysis
Transcriptome analysis by RNA-Seq allows the direct detection of both canonical exons as well as alternative isoforms from sequence reads overlapping splice junctions (25,27,29). However, junction reads address mostly splicing events involving internal exons and are inherently under-represented in a typical dataset. To circumvent these issues, we complemented here the prediction of AEEs by exploiting information provided by the number of reads within exons.
We used a Poisson-based stochastic count model to describe transcript abundance. The observed read counts  originating from a transcript are a realization of a Poisson distribution whose expected value is proportional to the transcript length and proportion. Read counts observed within exons are drawn according to a multinomial distribution
  . The proportion of reads
  expected in exon e can be defined arbitrarily and adapted according to the distribution of read coverage along transcripts (‘Materials and Methods’ section).
In the following, we assumed a uniform distribution of the reads, such that an exon relative coverage  is simply determined by its effective exon length:
The assumption of a uniform distribution of the reads was verified on a human dataset (27) that we used in this study (Supplementary Figure S1), but any general distribution could be used for a different dataset.
Additionally, we verified that RNA-Seq-measured exon expression levels in the analysed dataset are accurate and that no experimental artifacts create atypical, e.g. bimodal, distributions. We addressed these global issues by selecting all genes that harbour exons with a large deviation from the mean expression level across the gene. We expect to see that only a minority of genes have more than one exon with a clearly deviating mean expression signature. Indeed, this was the case as <30% of the genes contain such exons (with a difference of more than 2 SD to the mean gene expression level, see Supplementary Figure S1).
Predicting alternative exon usage based on sequence read counts
In principle, AEEs can be pinpointed by skewed read densities in the corresponding exons of a given gene. If the density of reads over all exons of a given gene is homogeneous, after correcting according to expected proportion  , individual AEEs can be scored based on a so-called Alternative uSage Index (ASI). The ASI corresponds, for each exon and within a given gene, to the standardized deviation from the mean expression value. We generated two indexes that are, respectively, named (i) CASI and (ii) DASI. It is important to note that the CASI/DASI can pinpoint any event corresponding to a variation of exon-level expression like cassette exons, alternative donor and alternative acceptor splice sites, alternative start exon and alternative polyadenylation sites (APSs), but these methods cannot directly infer which type of AEE occurs. In addition to predicting AEEs, we designed a method addressing the relative POEM, based on known transcript structures. The overall strategy is summarized in Figure 1.
Figure 1.

AS analysis workflow. (A) RNA-Seq reads are mapped to the reference genome and intersected with exon positions, AEEs are predicted within a condition (CASI) or two conditions (DASI). POEM estimates splice form proportions within a condition using known transcript structures. (B) Details of the analysis steps for DASI, CASI and POEM, performed on RNA-Seq data for HEK and B cells. The number of tested genes, transcripts or exons is reported for each method.
All proposed methods are influenced by the length of the differential exonic region and the difference in expression level between the respective transcripts. Because the majority of first-exon events encompass complete exons, in our model, first-exon events behave similar to skipped-exon events. Alternative isoforms with APSs as well as alternative 5′ or 3′-sites affect a single exon, which leads to a differential read distribution in just a part P of the alternative exon. For APSs, the length of the differential part P will usually be long, as 3′-exons are on average much longer than internal exons. In case of alternative 5′ or 3′-sites, the size of part P will frequently be smaller than the average exon length thus complicating the detection of the variant.
Prediction of alternative exon usage within one condition
In order to address AEEs inside a given conditions, we developed the CASI method whose principle works as follows: we first identify genes with a significantly different read coverage across exons using Pearson’s chi-square test (CASI p-value, p ≤ 0.05). In the second step, we attribute a score (CASI) to the individual exons according to their amplitude of change in expression (Figure 1; see ‘Materials and Methods’ section).
Simulations
In order to analyse the theoretical accuracy of CASI, we simulated a skipped-exon event with different relative expression levels compared with the constitutive form and computed sensitivity and specificity for 1000 repetitions. We also addressed the impact of noise on these measures (see ‘Materials and Methods’ section). Figure 2A shows the specificity and sensitivity of CASI predictions with noise. The predictions are very robust with >80% specificity, and the sensitivity increases according to the expression level of the alternative isoform.
Figure 2.

(A) Sensitivity and specificity (y-axis) for CASI AEE prediction for different minor isoform proportions (x-axis) based on simulation by introducing 20% noise (‘Materials and Methods’ section). (B) Robustness estimation for predictions on HEK data. The change in predicted number of AEEs is shown relative to the total number of predictions for the whole dataset (y-axis) for 500 bootstrap samples using a CASI of −2. The x-axis shows the reduction in length that was introduced to an exon at random (p = 0.25). (C) RT-PCR validation of a predicted AEE of NONO in HEK cells (CASI); it shows the observed exon–exon junction (blue arrows) and the corresponding number of reads (above the arrows) for all exons of the three annotated isoforms (ENSEMBL v.46). S1 and S2 primers are placed on the splice junctions of the constitutive and the skipped forms, respectively (red dashed line) to uniquely amplify two different splice variants of NONO. R1 and S3 primers were designed inside surrounding exons. Exons not considered in CASI analysis are marked by an asterisk. (D) Agarose gels (1.5%) showing the RT-PCR amplification results of S1-R1, S2-R1 and S3-R1 fragments. The observed sizes of the bands correspond to the expected sizes.
Prediction on human RNA-Seq data
After investigating the theoretical properties of the CASI method, we made predictions on two human cell lines: a B-cell lymphoma and a HEK293T cell line (27).
We calculated the CASI for all genes expressing at least two exons in a given cell line (12 140 genes in HEK and 10 417 genes in B cells). A total of 7991 genes in HEK and of 6837 genes in B cells showed a significant CASI p-value (see ‘Materials and Methods’ section). Data were filtered further by imposing a threshold on the CASI ≤ −2 to yield maximal sensitivity (see below). There remained 4459 genes in HEK and 3490 genes in B cells with a significant CASI, for which we predicted 6869 and 5008 AEEs, respectively. CASI predicted more than one AEE for 666 and 841 genes in HEK and B cells, respectively. A total of 2650 AEEs (in 2428 genes) were shared between HEK and B cells pointing to events common to very diverse cell types (Supplementary Tables S1A and S1B).
Sensitivity and bootstrap analysis
A data-based estimate of sensitivity for CASI predictions was derived for AEEs identified by reads mapping to splice junction sequences (see ‘Materials and Methods’ section). At a CASI of −2, all AEEs identified by splice junctions were predicted by CASI, such that sensitivity was 100% (Supplementary Figure S4).
In addition, we analysed the quality and the robustness of CASI predictions. A new bootstrap procedure was developed to investigate the consistency of predictions on real data. For each bootstrap sample, we removed reads from the data that mapped to random positions inside an exon and recorded the effect on the prediction of AEEs (‘Materials and Methods’ section). In this context, a highly uneven read distribution would significantly impact the number of predictions. However, the predictions are shown to be very robust with <5% relative error for different cut-off on the CASI values (Figure 2B and Supplementary Figure S2).
Experimental verification
In order to optimize the CASI predictions, we tested a subset of predicted AEEs by RT-PCR. Though CASI does not provide indications on the nature of the detected AEEs, we designed the PCR for testing exon-skipping events, as it is the most prevalent form of AS (15). We tested a selection of 61 AEEs (50 in HEK and 11 in B cells), of which >50% had CASI as the sole indicator of an alternative isoform (Supplementary Table S2). Thirty-five CASI predictions were validated as true exon-skipped events, of which 17 were not supported by junction reads. This emphasizes the power of CASI in identifying AEEs as illustrated for the third exon of the NONO gene (Figure 2C). Among the 26 AEEs that could not be validated, we observed one likely false negative case, corresponding to a skipped exon in the gene TCOF1 in HEK supported by only one junction read (Supplementary Table S2). As the remaining 25 CASI cases could, in principle, involve alternative donor or acceptor sites, we examined whether other data sources (e.g. junction reads, ESTs or ENSEMBL) provided clues that could infer these types of AS. Indeed, nine exons were annotated for another type of AEE in at least one source (Supplementary Table S2) among which four AEEs were detected by junction reads, such as the usage of an alternative acceptor site in the DUS1L gene (Supplementary Figure S3). Based on these experimental verifications, the specificity of the CASI was estimated to be close to 60%.
Further, we estimated the predictive power of the procedure by using the receiver operating characteristic analysis, where each exon tested by RT-PCR (negative or positive) was associated with its corresponding CASI value. Based on these PCR results, we obtained a specificity of 89% and a sensitivity of 51% for the CASI method (CASI ≤ −4), in line with the genome-wide estimate of sensitivity deduced by splice junction analysis (Supplementary Figure S4). The number of false positives (1 − specificity) cannot be deduced from the mapping of splice junctions alone, due to the problem of non-unique spliced alignment matches for short reads and the low expression of many alternative transcripts. However, the simulation and bootstrapping results hint to the fact that the number of false positives is not much higher than the 11% observed in the PCR experiments on 61 AEEs. Given the conservative threshold of CASI ≤ −4, we predicted 2499 AEEs in 2070 genes for HEK and to 1775 AEEs in 1532 genes for B cells, respectively. Seven hundred and twelve AEEs in 693 genes overlap between the two cell lines.
It is of particular relevance to compare the respective performances of CASI versus splice junction reads in their abilities to detect genes with AEEs. Out of the 3858 genes predicted to have an AEE by any of these two methods in HEK cells, only 845 were detected simultaneously by the CASI and junction reads (Supplementary Figure S5). Moreover, there are notable qualitative differences in the detected AEEs. Splice junction reads revealed a larger number of internal AS exons (27), whereas most of the events detected by the CASI targeted terminal exons, particularly the most 3′-exons (Figure 3).
Figure 3.

Distribution of the number of AEEs predicted by CASI and DASI. Bars show the number of 5′- (black), internal (grey) and 3′-exons (white) predicted as AEE within cell lines (CASI ≤ −4) and between cell lines (|DASI| ≥ 2). The whiskers for CASI are obtained by shortening the length of the 5′- and 3′-exons artificially by 20% in order to estimate the error due to the annotation in the 5′- and 3′-end of a gene.
EST-based validation
The significant expression variation detected in terminal exons might reflect the presence of multiple APSs, which are generally poorly annotated in the current databases. Globally, differential expression involving the 3′-terminal exon was frequently observed in the human dataset, in particular in genes annotated for APSs based on an independent EST dataset (B cells: 3.3e−244, HEK cells: 1.6e−291, hypergeometric p-value; see ‘Materials and Methods’ section). This is in line with the observations of Sandberg et al. (45), which showed that a large fraction of genes in proliferating cell lines express shortened 3′-UTRs. The gene HIP2 reported in the publication shows the same behaviour (Supplementary Figure S6). Similarly, CASI 5′-terminal exons were more frequently found in genes annotated for alternative TSS of the 5′ AEEs in HEK and B cells, 67% and 74%, respectively (5.6e − 17 and 4.1e−14, hypergeometric p-value, see ‘Materials and Methods’ section).
These results illustrate the complementarities between CASI and junction reads. CASI performed better than junction reads for identifying rare splice junctions, whereas junction reads can detect multiple AS events for complex transcript isoforms where CASI performance is poor. In terms of AEEs involving internal exons, only one-fourth of the CASI predictions were corroborated by junction reads (Supplementary Tables S1A and S1B). Further, we compared the predicted AEEs (CASI ≤ −4) against a set of 73 948 known AEEs in EST data (see ‘Materials and Methods’ section; Supplementary Table S3). Data indicated that 22% (126 out of 563) of the predicted internal AEEs in HEK cells and 24% (98 out of 414) in B cells were novel, and that most of these novel AEEs were cell type specific (Supplementary Table S3). Taken together, our data indicate that ∼30% of the genes are expressing alternative transcripts in each cell type. Combining both cell types, 49% of the genes show alternative isoforms.
Relative proportions of transcript isoforms
Beyond the identification of AEEs, one follow-up issue is to estimate the respective proportions of the various transcript isoforms. Towards this aim, we designed an algorithm called POEM, estimating the abundance of each known isoform, based on a probabilistic model that integrates the number of reads in exons and the information pertaining to annotated transcripts. In its principle, POEM is comparable with prior studies (46,47) interrogating arrays combining exon and splice junction probes. Here, we used the EM algorithm to infer non-observed proportions of the isoforms, with a method similar to the one proposed for EST analysis (13) (see ‘Materials and Methods’ section and Supplementary Data).
Simulations
The theoretical accuracy of POEM was assessed by simulations. In each set up, we monitored the mean or maximum absolute error on a transcript proportion.
First, simulations were performed on a template gene of 1200 bp and considering one exon-skipping event. We varied the length of the skipped exon, the exon inclusion rate and the gene expression level to assess their impact on the estimation error rate (Figure 4A). The average error on proportion estimations decreased with gene expression level. Furthermore, the error of estimation was inversely correlated with the length of the skipped exon (Figure 4A, grey to dark lines). The exon inclusion rate also had an influence on the error, as a 20% inclusion rate (Figure 4A, dashed lines) had constantly higher estimation error than an 80% inclusion rate (Figure 4A, plain line). A minimum of 300 reads in the gene achieves a reasonable accuracy for POEM (Figure 4A).
We then addressed the expected global accuracy of POEM with a second simulation on all annotated transcripts (Ensembl v.46) and monitored the error made on proportions as a function of gene expression (Figure 4B, dashed lines). Two different transcripts from ENSEMBL were simulated to be expressed with different expression levels (‘Materials and Methods’ section). The 90% quantile of errors show that, with a minimum of 300 reads within the gene (Figure 4B, vertical line), the average error is <12.6% (maximum error is <18.6%).
Application to human RNA-Seq data
Based on both simulations, we applied POEM to all genes with at least 300 reads mapping inside the exons of the gene and annotated with at least two isoforms indicative of AS in internal exons (‘Materials and Methods’ section). In this, we estimated the relative isoform proportions for 830 and 640 genes in HEK and B cells, which were annotated with 2412 and 1911 transcript variants, respectively. From this set, POEM estimated proportions for 1920 and 1487 transcripts for HEK and B cells, respectively (Supplementary Table S4). We verified these estimations by (i) analysing the number of reads mapping to exon–exon junctions and (ii) experimental validations using qPCR. For instance, Figure 4E shows that the inclusion rate of exon 5 in the gene MPI could be deduced from the ratio of reads specifying the exon–exon junctions that is 84% in this case (‘Materials and Methods’ section). We compared POEM predictions with the information provided by junction reads for 267 constitutive AEEs (149 pairs in HEK and 118 pairs in B cells), showing at least three exon–exon junction counts. On the whole, POEM agreed well with the estimates deduced from junction reads, with a correlation coefficient of 0.65 and an estimated proportion difference of <20% for 80% of the events (Figure 4C).
Experimental validation
The comparison of POEM estimates with qPCR measurements for a total of 47 AEEs in both cell lines (22 exon-skipping events, two mutually exclusive events; ‘Materials and Methods’ section) showed a high correlation (PCC = 0.81, Figure 4D and Supplementary Table S5). The gene MPI is an illustrative example (Figure 4E), which is also confirmed by junction reads. Precise inference of a large difference in relative expression levels is hampered if one of the isoforms has a very low expression value. This is illustrated in Figure 4D, where 13 events (with qPCR AS proportion close to 0% or 100%) display an expression level difference of 2–3 orders of magnitude between the constitutive and the skipped form (Supplementary Table S5).
It is worth mentioning that 38 out of the 47 tested AEEs were supported by junction reads. When we compared the estimated proportions derived from junction reads with the estimates from qPCR for these 38 AEEs, the correlation was slightly lower (PCC = 0.74). This is due to the paucity of reads identifying junctions, reducing the significance of ratios associated with low read counts for estimating AEEs. Besides, with twice 8 million reads sequenced, the junction reads depth is still far from saturation, so we expect to see at most 50% of the expected junctions. Therefore, exploiting the number of counts in exons offers complementary information in detecting and quantifying AEEs, in particular when the dataset does not reach saturation.
Analysis of differential isoform usage between two conditions
In order to address AEEs differentiating between two conditions, e.g. control and disease sample, we developed the DASI method whose principle works as follows. Briefly, we first identify genes whose relative exon usage differs significantly between two conditions using Fisher’s exact test (DASI p-value, adjusted p ≤ 0.05). Secondly, the individual exons are scored (DASI) according to the amplitude of the detected differential expression (Figure 1; ‘Materials and Methods’ section).
Application to human RNA-Seq data
We applied this procedure to the 9242 genes expressed in both HEK and B cells (‘Materials and Methods’ section), leading to the identification of 613 genes with a significant DASI p-value (≤5%). After applying a filtering step (|DASI| ≥ 2), we predicted that 968 exons (in 365 genes) were differentially used between the two cell types (Supplementary Table S6), from which the majority (78%) were internal exons. A total of 161 genes had more than one differential AEE between HEK and B cells.
Functional analysis
Analysis of the functional properties of these 365 genes showed that DASI-predicted genes were enriched for factors whose molecular functions are involved in translation and RNA metabolic processes, nucleic acid transport, ribonucleoprotein complex biogenesis and assembly and transcriptional regulation. Three transcription factors (MEF2B, MAZ and SMARCB1) were among the top 20 genes showing the most significant DASI p-values. The best candidate, MEF2B, known to be involved in B-cell differentiation (48) showed indeed an alternative TSS in B cells (Supplementary Figure S7), suggesting the usage of alternative promoters associated with its specific function.
Experimental verification
We validated a subset of 16 high-scoring DASI events by qPCR. Comparison of the expression ratios of the skipped versus constitutive exons between the two cell lines showed that the DASI predictions and the qPCR results were concordant, with a validation rate of 69% (considering a fold change of at least 1.5 for the qPCR) (Supplementary Table S7). An illustrative example is the proliferation marker gene MKI67, which is universally expressed in proliferating cells but almost absent in quiescent cells (49). The MKI67 mRNA that contains the large exon 7 is equally abundant in B cells and HEK cells, but the skipped form is more highly expressed in B cells than in HEK cells (Figure 5).
Figure 5.

qPCR validation of a predicted AEE in MKI67 between HEK (blue) and B cell (red) (DASI). (A) Screenshot of the MKI67 gene. The primers were designed to compare the inclusion rate of exon 7 between HEK cells and B cells. (B) RT-PCR results validate the presence of the constitutive and the skipped form in both cell lines. For both S1-R1 (constitutive) and S2-R1 (skipped), a PCR product of length 163 bp is expected if the form is expressed, otherwise no band should be visible. (C) Bar charts representing the normalized expression values for the constitutive form (black) and the skipped form (grey) obtained by qPCR. The results show that the skipped form is more abundant in B cells relative to the constitutive form, as predicted by the DASI method (DASI = 5.2).
Comparison with exon arrays
Previous attempts, to systematically decipher AEEs occurring between different conditions or tissues, have made use of exon arrays alone or in combination with splice junction arrays (6,19,20,50). For comparative purposes, we interrogated the human Affymetrix exon chips 1.0ST using the same source of material as well as one biological replicate (‘Materials and Methods’ section). For sake of simplicity, we focused the present analysis on the probe sets corresponding to all exons annotated in ENSEMBL (‘Materials and Methods’ section), i.e. 149 079 exons in 16 527 genes. A total of 70 627 exons (9322 genes) in HEK cells and of 57 406 exons (7823 genes) in B cells were found expressed by both technologies. In terms of detected exons, there was a good agreement between arrays and RNA-Seq, where 90% of the genes detected by exon chips were also scored by RNA-Seq. As previously reported (27), RNA-Seq is more sensitive than arrays, with 26 300 and 23 866 additional exons detected in HEK and B cells, as being expressed solely by RNA-Seq.
A total of 51 302 exons (in 7210 genes) were detected by both RNA-Seq and exon arrays in the two cell lines simultaneously, used as a framework for comparing the power of the respective technologies in the detection of AS events. We observed a good correlation (PCC = 0.73; Supplementary Figure S8) between the log-ratio of expression values for the exons expressed in both cell lines, with increased correlation for higher expression.
For detecting differential AS with exon arrays, we used the standard MIDAS method (20,44) and analysed only the genes expressed above the 50% quantile of the expression values in both cell lines (‘Materials and Methods’ section). MIDAS proceeds in two steps, which are similar to the DASI. Comparison of the DASI results with MIDAS showed little agreement in the detection of genes with AEEs between HEK and B cells (10 genes with 16 exons are in common, Supplementary Figure S9). All genes with predicted AEEs by DASI and MIDAS were among the most highly expressed ones in both cell lines.
In order to investigate the platform differences, we calculated the quadratic mean distance for every gene, between RNA-Seq and exon arrays, over exon expression log-ratios (HEK versus B cells). The quadratic mean distances associated with genes with AEEs predicted by either DASI only, MIDAS only or by both methods simultaneously did not show major differences (Supplementary Figure S10). The lack of agreement between the methods reflects the fact that the analysis of alternative isoforms is very sensitive to subtle variations in expression values that arise both at the individual exon and whole gene expression level. In this context, a minimal variation of expression between exons is a prerequisite for pinpointing variable exons with a reasonable specificity. This problem appeared to be less prominent with RNA-Seq, showing clearly a smaller variation of expression values across exons of a given gene (Supplementary Figure S11). The RCC1 gene, for example, was detected by DASI and validated by qPCR, but not detected by MIDAS (Supplementary Fig. S12). In this case, the alternative exon was below the detection threshold on arrays. Only two of the eight DASI predictions verified by qPCR were also detected by MIDAS (genes MDC1 and MKI67).
DISCUSSION
Digital transcriptome analysis using next-generation sequencing opens up unprecedented possibilities for the analysis of the dynamics of transcription and transcript processing, in particular alternative isoforms expressed within a single tissue or differentially expressed between tissues (or physiological conditions). We described here a set of methods that can infer AEEs from mRNA sequencing data using short-read sequencing technology. The proposed approach, combining hypothesis testing and EM estimation, was evaluated by RT-PCR-based experimental validations and by comparison with exon array data. As a prerequisite, the principle of the methods assumes the distribution of reads across transcripts is known. Whereas possible biases might affect the read distribution (25,36), we showed that the reads were rather uniformely distributed in internal exons in the analysed dataset. However, 5′- and 3′-terminal exons often showed deviations mostly due to natural variation associated with APS and alternative TSS. We ruled out that biases not accounted in our model could significantly affect our results by applying a bootstrap procedure and showed that >95% of the predictions remained stable. An alternative source for nonuniformity might be antisense transcription in case of an RNA-Seq protocol without strand information. While we have removed exonic regions where two genes overlap, still some antisense transcripts may not be represented in current gene annotation. Read counts of unannotated sense–antisense overlapping regions will, therefore, be increased artificially in the current dataset. Further improvements in protocols for the RNA-Seq library preparation will help to reduce read distribution biases (25) and to resolve strand-specific expression (51).
For single genes, it is expected that the length of the variable region between two isoforms will influence the detection power of methods using read coverage (Simulations). For extreme cases affecting only a few bases of one exon—like NAGNAG sites (15)—those methods are likely unable to detect these changes. By design, CASI and DASI have certain biases in detecting splice variants. While CASI requires in most cases the existence of at least two transcripts for a gene, DASI is able to predict variations on single transcripts with only one transcript in each condition. In contrast to DASI, exons with low expression are not taken into account by CASI to avoid, for instance, the influence of potential annotation errors. Consequently, CASI predictions are based on a smaller set of expressed internal exons compared with DASI predictions.
In their principle, the CASI/DASI strategies could be paralleled with the type of analysis performed with exon chips. We showed that using digital information derived from only ∼8 million reads sequenced in each condition, the prediction of AEEs differentiating HEK from B cells exhibited higher sensitivity and specificity than estimations derived from exon chips. We demonstrated that one of the major problems with arrays is that the large variation of expression levels across exons of a given gene adversely affects the detection of AEEs. This problem adds up to the well-known array issues related to probe design, cross-hybridization and detection of specific signals for genes that are poorly expressed. Here, data showed that only a small fraction of the qPCR-verified AEEs were detected by the exon array.
Previous array-based predictions of AEEs reported a specificity of 82–85% and a sensitivity of 49–53% (8,52). Here, given the actual dataset, CASI alone reached a specificity of 89% and a sensitivity of 51%. However, as we have shown here, the inventory of AEEs is drastically improved after integration of splice junction reads. Given that our work was conducted with only ∼4 millions of mapped reads per cell line and allowed to estimate AEEs with largely improved performances as compared with exon array-based analysis, there is no doubt that an exhaustive inventory of alternative transcript isoforms will be made possible via RNA-Seq. Our data show that it is essential to merge information from junction reads and predictions from CASI/DASI types of analysis. While highly expressed genes are associated with a large number of reads directly identifying the different splice junctions (and will therefore identify a larger set of splice junctions in these genes), moderately abundant transcripts will, in many cases, show a sufficient number of exonic tags to allow the prediction of AEEs by CASI, but might not enable the identification of reads at splice junctions. In general, the complexity of AEEs in a given gene might better be addressed by junction or paired-end reads, because for exons affected by multiple variations, the read distribution will be difficult to interpret.
Our data could be exploited for the prediction of the combinatorics of AEEs associated with the biology of specific cell types. Based on the composite analysis of many cell types, two recent RNA-Seq studies estimated that >92% of the human genes undergo AS (9,10). In line with this observation, we show here that in only two cell types, 49% of the expressed genes exhibit alternative isoforms. However, it remains to be understood if all these AEEs are biologically relevant.
In the quantitative estimation of isoform proportions (POEM), we obtained a good correlation with qPCR and junction reads. Alternative strategies estimated AEE inclusion rates directly from the ratio of junction read counts (9) or read counts from pooled junction and exon body reads (10). These methods work well for genes with high coverage, but the EM-based procedure of POEM is also more accurate for genes with a low coverage. A new in silico study, using model assumptions similar to POEM, showed a lower but reasonable correlation of RNA-Seq-deduced inclusion rates compared with inclusion rates estimated from microarray data (53). In its current form, POEM relies on a given transcript annotation to estimate isoform proportions. We are currently investigating the inference of new transcript structures and their relative proportions from RNA-Seq within the POEM framework.
Current advances in sequencing technologies are leading to more and longer reads per experiment. The resulting increase in sequence coverage will ease AEE detection by direct observation. The general framework, provided herein, can be extended to more complex scenarios integrating additional types of evidence, such as splice junction reads or paired-end reads. The strategy we propose will keep its discriminative power for low-coverage studies, such as those obtained by multiplexing different samples on the same sequencing lane.
SUPPLEMENTARY DATA
Supplementary Data are available at NAR Online. The Gene Expression Omnibus accession number for the exon array data is GSE13474.
FUNDING
Max Planck Society and the European Union [AnEUploidy (LSHG-CT-2006-037627)]. Funding for open access charge: Max-Planck Society.
Conflict of interest statement. None declared.
Supplementary Material
ACKNOWLEDGEMENT
We thank K. Metz and K. Schmidt for technical assistance.
REFERENCES
- 1.Brett D, Pospisil H, Valcárcel J, Reich J, Bork P. Alternative splicing and genome complexity. Nat. Genet. 2002;30:29–30. doi: 10.1038/ng803. [DOI] [PubMed] [Google Scholar]
- 2.Maniatis T, Tasic B. Alternative pre-mRNA splicing and proteome expansion in metazoans. Nature. 2002;418:236–243. doi: 10.1038/418236a. [DOI] [PubMed] [Google Scholar]
- 3.Davuluri RV, Suzuki Y, Sugano S, Plass C, Huang TH. The functional consequences of alternative promoter use in mammalian genomes. Trends Genet. 2008;24:167–177. doi: 10.1016/j.tig.2008.01.008. [DOI] [PubMed] [Google Scholar]
- 4.Zhang H, Lee JY, Tian B. Biased alternative polyadenylation in human tissues. Genome Biol. 2005;6:R100. doi: 10.1186/gb-2005-6-12-r100. [DOI] [PMC free article] [PubMed] [Google Scholar]
- 5.Cork D, Lennard T, Tyson-Capper A. Alternative splicing and the progesterone receptor in breast cancer. Breast Cancer Res. 2008;10:207. doi: 10.1186/bcr2097. [DOI] [PMC free article] [PubMed] [Google Scholar]
- 6.French PJ, Peeters J, Horsman S, Duijm E, Siccama I, van den Bent MJ, Luider TM, Kros JM, van der Spek P, Smitt P.AS. Identification of differentially regulated splice variants and novel exons in glial brain tumors using exon expression arrays. Cancer Res. 2007;67:5635–5642. doi: 10.1158/0008-5472.CAN-06-2869. [DOI] [PubMed] [Google Scholar]
- 7.Klinck R, Bramard A, Inkel L, Dufresne-Martin G, Gervais-Bird J, Madden R, Paquet ER, Koh C, Venables JP, Prinos P, et al. Multiple alternative splicing markers for ovarian cancer. Cancer Res. 2008;68:657–663. doi: 10.1158/0008-5472.CAN-07-2580. [DOI] [PubMed] [Google Scholar]
- 8.Johnson JM, Castle J, Garrett-Engele P, Kan Z, Loerch PM, Armour CD, Santos R, Schadt EE, Stoughton R, Shoemaker DD. Genome-wide survey of human alternative pre-mRNA splicing with exon junction microarrays. Science. 2003;302:2141–2144. doi: 10.1126/science.1090100. [DOI] [PubMed] [Google Scholar]
- 9.Pan Q, Shai O, Lee LJ, Frey BJ, Blencowe BJ. Deep surveying of alternative splicing complexity in the human transcriptome by high-throughput sequencing. Nat. Genet. 2008;40:1413–1415. doi: 10.1038/ng.259. [DOI] [PubMed] [Google Scholar]
- 10.Wang ET, Sandberg R, Luo S, Khrebtukova I, Zhang L, Mayr C, Kingsmore SF, Schroth GP, Burge CB. Alternative isoform regulation in human tissue transcriptomes. Nature. 2008;456:470–476. doi: 10.1038/nature07509. [DOI] [PMC free article] [PubMed] [Google Scholar]
- 11.Gupta S, Zink D, Korn B, Vingron M, Haas SA. Genome wide identification and classification of alternative splicing based on EST data. Bioinformatics. 2004;20:2579–2585. doi: 10.1093/bioinformatics/bth288. [DOI] [PubMed] [Google Scholar]
- 12.Lee C, Wang Q. Bioinformatics analysis of alternative splicing. Brief. Bioinform. 2005;6:23–33. doi: 10.1093/bib/6.1.23. [DOI] [PubMed] [Google Scholar]
- 13.Xing Y, Yu T, Wu YN, Roy M, Kim J, Lee C. An expectation-maximization algorithm for probabilistic reconstructions of full-length isoforms from splice graphs. Nucleic Acids Res. 2006;34:3150–3160. doi: 10.1093/nar/gkl396. [DOI] [PMC free article] [PubMed] [Google Scholar]
- 14.Lee C, Roy M. Analysis of alternative splicing with microarrays: successes and challenges. Genome Biol. 2004;5:231. doi: 10.1186/gb-2004-5-7-231. [DOI] [PMC free article] [PubMed] [Google Scholar]
- 15.Blencowe BJ. Alternative splicing: new insights from global analyses. Cell. 2006;126:37–47. doi: 10.1016/j.cell.2006.06.023. [DOI] [PubMed] [Google Scholar]
- 16.Clark TA, Sugnet CW, Ares M. Genomewide analysis of mRNA processing in yeast using splicing-specific microarrays. Science. 2002;296:907–910. doi: 10.1126/science.1069415. [DOI] [PubMed] [Google Scholar]
- 17.Le K, Mitsouras K, Roy M, Wang Q, Xu Q, Nelson SF, Lee C. Detecting tissue-specific regulation of alternative splicing as a qualitative change in microarray data. Nucleic Acids Res. 2004;32:e180. doi: 10.1093/nar/gnh173. [DOI] [PMC free article] [PubMed] [Google Scholar]
- 18.Pan Q, Shai O, Misquitta C, Zhang W, Saltzman AL, Mohammad N, Babak T, Siu H, Hughes TR, Morris QD, et al. Revealing global regulatory features of mammalian alternative splicing using a quantitative microarray platform. Mol. Cell. 2004;16:929–941. doi: 10.1016/j.molcel.2004.12.004. [DOI] [PubMed] [Google Scholar]
- 19.Clark TA, Schweitzer AC, Chen TX, Staples MK, Lu G, Wang H, Williams A, Blume JE. Discovery of tissue-specific exons using comprehensive human exon microarrays. Genome Biol. 2007;8:R64. doi: 10.1186/gb-2007-8-4-r64. [DOI] [PMC free article] [PubMed] [Google Scholar]
- 20.Gardina PJ, Clark TA, Shimada B, Staples MK, Yang Q, Veitch J, Schweitzer A, Awad T, Sugnet C, Dee S, et al. Alternative splicing and differential gene expression in colon cancer detected by a whole genome exon array. BMC Genomics. 2006;7:325. doi: 10.1186/1471-2164-7-325. [DOI] [PMC free article] [PubMed] [Google Scholar]
- 21.Purdom E, Simpson KM, Robinson MD, Conboy JG, Lapuk AV, Speed TP. FIRMA: a method for detection of alternative splicing from exon array data. Bioinformatics. 2008;24:1707–1714. doi: 10.1093/bioinformatics/btn284. [DOI] [PMC free article] [PubMed] [Google Scholar]
- 22.Xing Y, Stoilov P, Kapur K, Han A, Jiang H, Shen S, Black DL, Wong WH. MADS: a new and improved method for analysis of differential alternative splicing by exon-tiling microarrays. RNA. 2008;14:1470–1479. doi: 10.1261/rna.1070208. [DOI] [PMC free article] [PubMed] [Google Scholar]
- 23.Lister R, O’Malley RC, Tonti-Filippini J, Gregory BD, Berry CC, Millar AH, Ecker JR. Highly integrated single-base resolution maps of the epigenome in Arabidopsis. Cell. 2008;133:523–536. doi: 10.1016/j.cell.2008.03.029. [DOI] [PMC free article] [PubMed] [Google Scholar]
- 24.Marioni J, Mason C, Mane S, Stephens M, Gilad Y. RNA-seq: an assessment of technical reproducibility and comparison with gene expression arrays. Genome Res. 2008;18:1509–1517. doi: 10.1101/gr.079558.108. [DOI] [PMC free article] [PubMed] [Google Scholar]
- 25.Mortazavi A, Williams BA, McCue K, Schaeffer L, Wold B. Mapping and quantifying mammalian transcriptomes by RNA-Seq. Nat. Methods. 2008;5:621–628. doi: 10.1038/nmeth.1226. [DOI] [PubMed] [Google Scholar]
- 26.Nagalakshmi U, Wang Z, Waern K, Shou C, Raha D, Gerstein M, Snyder M. The transcriptional landscape of the yeast genome defined by RNA sequencing. Science. 2008;320:1344–1349. doi: 10.1126/science.1158441. [DOI] [PMC free article] [PubMed] [Google Scholar]
- 27.Sultan M, Schulz MH, Richard H, Magen A, Klingenhoff A, Scherf M, Seifert M, Borodina T, Soldatov A, Parkhomchuk D, et al. A global view of gene activity and alternative splicing by deep sequencing of the human transcriptome. Science. 2008;321:956–960. doi: 10.1126/science.1160342. [DOI] [PubMed] [Google Scholar]
- 28.Wilhelm BT, Marguerat S, Watt S, Schubert F, Wood V, Goodhead I, Penkett CJ, Rogers J, Bähler J. Dynamic repertoire of a eukaryotic transcriptome surveyed at single-nucleotide resolution. Nature. 2008;453:1239–1243. doi: 10.1038/nature07002. [DOI] [PubMed] [Google Scholar]
- 29.Cloonan N, Forrest A.RR, Kolle G, Gardiner B.BA, Faulkner GJ, Brown MK, Taylor DF, Steptoe AL, Wani S, Bethel G, et al. Stem cell transcriptome profiling via massive-scale mRNA sequencing. Nat. Methods. 2008;5:613–619. doi: 10.1038/nmeth.1223. [DOI] [PubMed] [Google Scholar]
- 30.Li H, Lovci MT, Kwon YS, Rosenfeld MG, Fu XD, Yeo GW. Determination of tag density required for digital transcriptome analysis: application to an androgen-sensitive prostate cancer model. Proc. Natl Acad. Sci. USA. 2008;105:20179–20184. doi: 10.1073/pnas.0807121105. [DOI] [PMC free article] [PubMed] [Google Scholar]
- 31.Cameron AC, Trivedi PK. Regression Analysis of Count Data. USA: Cambridge University Press; 1998. [Google Scholar]
- 32.Audic S, Claverie JM. The significance of digital gene expression profiles. Genome Res. 1997;7:986–995. doi: 10.1101/gr.7.10.986. [DOI] [PubMed] [Google Scholar]
- 33.Beissbarth T, Hyde L, Smyth GK, Job C, Boon WM, Tan SS, Scott HS, Speed TP. Statistical modeling of sequencing errors in SAGE libraries. Bioinformatics. 2004;20(Suppl. 1):i31–i39. doi: 10.1093/bioinformatics/bth924. [DOI] [PubMed] [Google Scholar]
- 34.Benjamini Y, Hochberg Y. Controlling the false discovery rate: a practical and powerful approach to multiple testing. J. R. Statist. Soc. B. 1995;57:289–300. [Google Scholar]
- 35.Lacroix V, Sammeth M, Guigo R, Bergeron A. Algorithms in Bioinformatics. Vol. 5251. Berlin/Heidelberg: Springer; 2008. pp. 50–63. [Google Scholar]
- 36.Dohm JC, Lottaz C, Borodina T, Himmelbauer H. Substantial biases in ultra-short read data sets from high-throughput DNA sequencing. Nucleic Acids Res. 2008;36:e105. doi: 10.1093/nar/gkn425. [DOI] [PMC free article] [PubMed] [Google Scholar]
- 37.Haas SA, Beissbarth T, Rivals E, Krause A, Vingron M. GeneNest: automated generation and visualization of gene indices. Trends Genet. 2000;16:521–523. doi: 10.1016/s0168-9525(00)02116-8. [DOI] [PubMed] [Google Scholar]
- 38.Haas SA, Hild M, Wright AP, Hain T, Talibi D, Vingron M. Genome-scale design of PCR primers and long oligomers for DNA microarrays. Nucleic Acids Res. 2003;31:5576–5581. doi: 10.1093/nar/gkg752. [DOI] [PMC free article] [PubMed] [Google Scholar]
- 39.Johnson WE, Li W, Meyer CA, Gottardo R, Carroll JS, Brown M, Liu XS. Model-based analysis of tiling-arrays for ChIP-chip. Proc. Natl Acad. Sci. USA. 2006;103:12457–12462. doi: 10.1073/pnas.0601180103. [DOI] [PMC free article] [PubMed] [Google Scholar]
- 40.Kapur K, Xing Y, Ouyang Z, Wong WH. Exon arrays provide accurate assessments of gene expression. Genome Biol. 2007;8:R82. doi: 10.1186/gb-2007-8-5-r82. [DOI] [PMC free article] [PubMed] [Google Scholar]
- 41.Irizarry RA, Hobbs B, Collin F, Beazer-Barclay YD, Antonellis KJ, Scherf U, Speed TP. Exploration, normalization, and summaries of high density oligonucleotide array probe level data. Biostatistics. 2003;4:249–264. doi: 10.1093/biostatistics/4.2.249. [DOI] [PubMed] [Google Scholar]
- 42.Gentleman RC, Carey VJ, Bates DM, Bolstad B, Dettling M, Dudoit S, Ellis B, Gautier L, Ge Y, Gentry J, et al. Bioconductor: open software development for computational biology and bioinformatics. Genome Biol. 2004;5:R80. doi: 10.1186/gb-2004-5-10-r80. [DOI] [PMC free article] [PubMed] [Google Scholar]
- 43.Dai M, Wang P, Boyd AD, Kostov G, Athey B, Jones EG, Bunney WE, Myers RM, Speed TP, Akil H, et al. Evolving gene/transcript definitions significantly alter the interpretation of GeneChip data. Nucleic Acids Res. 2005;33:e175. doi: 10.1093/nar/gni179. [DOI] [PMC free article] [PubMed] [Google Scholar]
- 44.Affymetrix. 2005. [24 June 2009, date last accessed]. Affymetrix White Papers:Alternative Transcript Analysis Methods for Exon Arrays v1.1. http://www.affymetrix.com/support/technical/whitepapers/exon_alt_transcript_analysis_whitepaper.pdf. [Google Scholar]
- 45.Sandberg R, Neilson JR, Sarma A, Sharp PA, Burge CB. Proliferating cells express mRNAs with shortened 3′ untranslated regions and fewer microRNA target sites. Science. 2008;320:1643–1647. doi: 10.1126/science.1155390. [DOI] [PMC free article] [PubMed] [Google Scholar]
- 46.Anton M, Gorostiaga D, Guruceaga E, Segura V, Carmona-Saez P, Pascual-Montano A, Pio R, Montuenga L, Rubio A. SPACE: an algorithm to predict and quantify alternatively spliced isoforms using microarrays. Genome Biol. 2008;9:R46. doi: 10.1186/gb-2008-9-2-r46. [DOI] [PMC free article] [PubMed] [Google Scholar]
- 47.Wang H, Hubbell E, Hu J.-S, Mei G, Cline M, Lu G, Clark T, Siani-Rose MA, Ares M, Kulp DC, et al. Gene structure-based splice variant deconvolution using a microarray platform. Bioinformatics. 2003;19(Suppl. 1):i315–i322. doi: 10.1093/bioinformatics/btg1044. [DOI] [PubMed] [Google Scholar]
- 48.Swanson BJ, Jack HM, Lyons GE. Characterization of myocyte enhancer factor 2 (MEF2) expression in B and T cells: MEF2C is a B cell-restricted transcription factor in lymphocytes. Mol. Immunol. 1998;35:445–458. doi: 10.1016/s0161-5890(98)00058-3. [DOI] [PubMed] [Google Scholar]
- 49.Urruticoechea A, Smith IE, Dowsett M. Proliferation marker Ki-67 in early breast cancer. J. Clin. Oncol. 2005;23:7212–7220. doi: 10.1200/JCO.2005.07.501. [DOI] [PubMed] [Google Scholar]
- 50.Das D, Clark TA, Schweitzer A, Yamamoto M, Marr H, Arribere J, Minovitsky S, Poliakov A, Dubchak I, Blume JE, et al. A correlation with exon expression approach to identify cis-regulatory elements for tissue-specific alternative splicing. Nucleic Acids Res. 2007;35:4845–4857. doi: 10.1093/nar/gkm485. [DOI] [PMC free article] [PubMed] [Google Scholar]
- 51.Parkhomchuk D, Borodina T, Amstislavskiy V, Banaru M, Hallen L, Krobitsch S, Lehrach H, Soldatov A. Transcriptome analysis by strand-specific sequencing of complementary DNA. Nucleic Acids Res. 2009;37:e123. doi: 10.1093/nar/gkp596. [DOI] [PMC free article] [PubMed] [Google Scholar]
- 52.Sugnet CW, Srinivasan K, Clark TA, O’Brien G, Cline MS, Wang H, Williams A, Kulp D, Blume JE, Haussler D, et al. Unusual intron conservation near tissue-regulated exons found by splicing microarrays. PLoS Comput Biol. 2006;2:e4. doi: 10.1371/journal.pcbi.0020004. [DOI] [PMC free article] [PubMed] [Google Scholar]
- 53.Jiang H, Wong WH. Statistical inferences for isoform expression in RNA-Seq. Bioinformatics. 2009;25:1026–1032. doi: 10.1093/bioinformatics/btp113. [DOI] [PMC free article] [PubMed] [Google Scholar]
Associated Data
This section collects any data citations, data availability statements, or supplementary materials included in this article.