


Abstract
Smad1 is a downstream effector of the BMP signaling pathway that binds regulatory DNA to execute gene expression programs leading to, for example, the maintenance of pluripotency in mice. On the contrary, the TGF-β-activated Smad3 triggers strikingly different programs such as mesodermal differentiation in early development. Because Smad1 and Smad3 contain identical amino acids at the DNA contact interface it is unclear how they elicit distinctive bioactivities. Here, we report the crystal structure of the MH1 domain of Smad1 bound to a palindromic Smad binding element. Surprisingly, the DNA contact interface of Smad1 is drastically rearranged when compared to Smad3. The N-terminal helix 1 of Smad1 is dislodged from its intramolecular binding site and adopts a domain swapped arrangement with a symmetry-related molecule. As a consequence, helix 2 kinks away from the double helix disabling several key phosphate backbone interactions. Thermal melting analysis corroborates a decompacted conformation of Smad1 and DNA binding assays indicate a lower overall affinity of Smad1 to DNA but increased cooperativity when binding to palindromic DNA motifs. These findings suggest that Smad1 and Smad3 evolved differential qualities to assemble on composite DNA elements and to engage in co-factor interactions by remodeling their N-termini.
INTRODUCTION
The transforming growth factor-β (TGF-β) signaling pathway regulates a wide range of processes such as the migration, proliferation and differentiation of cells (1). Binding of extracellular ligands belonging to the TGF-β super family of cytokines like TGF-β, BMP (bone morphogenetic protein), activin and nodal to distinct sets of type I and type II receptors leads to receptor oligomerization and the activation of the kinase activity of the type I receptor (2–3). The type I receptor, in turn, specifically phosphorylates Smad (homolog of Sma and mothers against decapentaplegic proteins) proteins facilitating their nuclear accumulation, followed by binding to cis-regulatory DNA sequences and the subsequent execution of gene expression programs that alter the cellular phenotype (1,4).
Smads are grouped into three different classes termed receptor-regulated Smads (R-Smads: Smad 1, 2, 3, 5 and 8), a single ‘common partner’ Smad (Co-Smad: Smad 4) and inhibitory Smads (I-Smad: Smad 6 and 7) (5). The R-Smads and Smad4 possess two distinct globular domains termed Mad homology 1 and 2 (MH1 and MH2) that are connected by a linker region of variable length and sequence. The phosphorylation of the carboxy-terminal MH2 domain of R-Smads leads to the formation of homotrimers or heterotrimers consisting of two R-Smads and one Smad4 molecule (6–7). Consequently, the heterotrimeric complex translocates to the nucleus and associates with specific chromatin regions in an R-Smad and cell-type-specific manner (8–10).
Importantly, individual ligands activate specific R-Smad proteins which in turn regulate different sets of genes resulting in Smad-specific and sometimes antagonistic biological responses (11). Specifically, TGF-β binding to cell surface receptors leads to the phosphorylation and activation of Smad 2 and 3, while BMP activates Smad 1, 5 and 8 (12–16). Here, we sought to elucidate the biochemical basis for the selective regulation of gene expression by the BMP-regulated Smad1 in contrast to the TGF-β regulated Smad3.
To bind DNA, Smads evolved an amino-terminal MH1 domain (17–18). Surprisingly, the determination of the crystal structure of the MH1 domain of Smad3 bound to a palindromic Smad binding element (SBE, GTCTAGAC) revealed that the amino acids mediating specific DNA base contacts are conserved across the R-Smads (19–20). Despite the invariance of DNA contact amino acids, biochemical studies indicated that the MH1 domain of Smad1 bind to a ‘GC’ rich element which is often found in proximity to a GTCT (SBE) element (21–24). On the contrary, Smad3 has been shown to preferably bind to a GTCT (SBE) element which can occur singly or configured as a palindrome (25–29). It has therefore been proposed that the preference of Smad1 for the GC-rich element is a key determinant for the specificity of the BMP response (23,30–31). However, the biochemical basis for Smad1 specific DNA recognition is unresolved and homology modeling of Smad1 using the Smad3/SBE structure as template could not shed light on this problem (32). Furthermore, sequence variations between Smad1 and Smad3 have been dissected by rationally introduced mutations followed by DNA binding and transactivation assays (33–35). These studies indicated that amino acids remote from the protein elements that mediate specific base contacts enable Smad1 and Smad3 to discriminate between binding sites. It is therefore possible that more intricate and unanticipated structural rearrangement indirectly affecting the DNA contact interface or Smad-specific cooperation with co-factors explains the specific target site selection of Smad1 and Smad3.
To better understand this mechanism, we determined the crystal structure of Smad1 bound to a palindromic SBE and conducted a detailed structural and biochemical comparison of Smad1 and Smad3. We found pronounced structural differences between Smad1 and Smad3 at regions that were known to affect selective DNA recognition in an as yet unknown manner. By using DNA binding assays, thermal melting analysis and light scattering, we establish that these structural differences affect the affinity and cooperativity of DNA binding as well as the stability of the proteins while the stoichiometry of protein/DNA complexes is conserved. Our data allow, for the first time, a detailed dissection of the structural differences between the downstream effectors of the BMP and TGF-β pathways that should eventually lead to an in-depth understanding of the biochemical/structural mechanisms governing the unique biological roles of both pathways.
MATERIALS AND METHODS
Protein production
The MH1 domains of Smad1 and Smad3 were cloned from their respective full-length mouse Smad cDNAs (IMAGE: 6811514 & 30432720) using a combination of BP and LR GATEWAY cloning (Invitrogen) methods as described elsewhere (36). The oligonucleotides used for cloning, containing attB sites and encoding a Tobacco Etch Virus (TEV) protease site, preceding the Smad MH1 constructs are given in Supplementary Table S1. The pENTR-TEV-Smad MH1 plasmids were verified by sequencing and the Smad MH1 constructs were subsequently shuttled into the destination vectors pETG60A and pHisMBP (37–38) by LR GATEWAY cloning. Genes were expressed in Escherichia coli (DE3) cells as NusAHis6-TEV-Smad1-MH1 and His6Mbp-TEV-Smad3-MH1 fusion proteins and purified as detailed elsewhere (36). In short, the fusion proteins were subjected to metal affinity purification followed by TEV protease cleavage. The Smad1 and Smad3 MH1 domains were further purified by ion-exchange chromatography and gel-filtration (36). Purified proteins were concentrated using a membrane-based concentrator with 5000 Da MW cutoff (Vivaspin, Sartorius) and the concentrated protein was flash frozen using liquid nitrogen and stored in aliquots at −80°C. The protein concentration was estimated by measuring the absorbance at 280 nm using a Nanodrop ND-1000 spectrophotometer.
Electrophoretic mobility shift assay
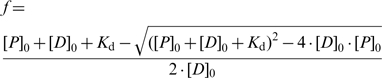
Electrophoretic mobility shift assays (EMSAs) were performed based on a protocol described previously (39). The sequences of the 5′ Cy5-labeled DNA oligos are provided in Supplementary Table S1 (purchased from Sigma Proligo). Freshly thawed Smad MH1 domains were serially diluted and mixed with 1 nM Cy5-labeled oligonucleotide in EMSA buffer (20 mM Tris–HCl pH 8.0, 0.1 mg/ml bovine serum albumin, 50 µM ZnCl2, 100 mM KCl, 10% glycerol, 0.1% NP-40, 2 mM β-mercaptoethanol and 10 mM EDTA) and incubated in a 10 µl reaction volume for 3 h at 4°C in the dark. The reaction mixture was then loaded onto 10% native polyacrylamide gels using 1 × Tris–Glycine (TG; 25 mM Tris pH 8.3, 192 mM Glycine) as the electrophoresis buffer. The gel was run at 200 V for 20 min at 4°C and imaged using typhoon phosphor imaging scanner (Amersham Biosciences). The free DNA and bound DNA were quantified using ImageQuant TL software (GE Healthcare). The dissociation equilibrium constant was determined by non-linear curve fitting in R (http://www.r-project.org/) using Equation 1 (40). In Equation (1), f denotes the fractional concentration of bound DNA, [P]0 and [D]0 the total protein and DNA concentrations and Kd the dissociation equilibrium constant. To determine the active fraction of the protein, 2.5 µM DNA (10 nM Cy5 labeled oligonucleotide mixed with 2490 nM of unlabeled DNA oligonucleotide) was used for the titration. The concentration of protein was corrected for the active fraction when calculating Kd and cooperativity factors.
 |
(1) |
Cooperativity factor for a protein homodimer binding to a palindromic DNA sequence
In our homodimer binding model, the protein (P) binds to the half site of the palindromic DNA sequence (D) as a monomer first (Equation 2). Since there are two half sites available for the monomer protein to bind, the microscopic dissociation equilibrium constant kd1 can be calculated as given in Equation (3), where [D], [P] and [DP] are the concentrations of the free DNA, monomer protein and monomer–DNA complex, respectively.
| (2) |
| (3) |
When the second monomer protein binds to the remaining half site and forms a homodimer (Equation 4), there is only one microscopic state for the monomer to bind, while there are two microscopic states for the homodimer to dissociate. Consequently, the microscopic dissociation equilibrium constant kd2 can be written as given in Equation (5), where [DP2] is the concentration of the homodimer–DNA complex.
| (4) |
| (5) |
We define f0, f1 and f2 as the fractional concentrations of the free DNA, monomer–DNA complex and homodimer–DNA complex, respectively (Equation 6), where [P]0 and [D]0 are the total concentrations of protein and DNA in the reaction, respectively (Equation 7). Thus, the homodimer cooperativity factor ω can be straightforwardly calculated from the experimentally determined fractional concentrations f0, f1 and f2 (Equation 8). The ω > 1 implies positive cooperativity; ω = 1 no cooperativity; ω < 1 negative cooperativity. To reduce errors when calculating ω, we only included measurements where the three fractional concentrations were all >0.1.
| (6) |
| (7) |
| (8) |
Dynamic light scattering
The polydispersity and hydrodynamic properties of Smad MH1 domains in the presence and absence of SBE DNA at a concentration of 15 mg/ml were measured using a Dynapro device (Wyatt) at 298 K in a buffer containing 10 mM Tris pH 8.0, 100 mM NaCl and 2 mM TCEP.
Circular dichroism
Circular dichroism (CD) measurements were carried out using a JASCO-810 spectropolarimeter equipped with a Peltier temperature controller and a water bath. Ten micromolars of Smad MH1 domains in the presence and absence of DNA were used to measure the CD spectrum in a 10 mM phosphate buffer pH 8.0, in 1-mm-path-length quartz cuvettes (Hellma). The spectrum was recorded at 298 K with wavelengths ranging from 190 to 320 nm using a 2-nm bandwidth and three accumulations. Melting curves of the protein–DNA complex were recorded by detecting the CD signal at 222 nm at a temperature range from 25°C to 95°C, with a heating rate of 1°C min−1.
Thermofluor
Smad MH1 proteins were incubated with palindromic SBE for an hour at 2:1 stoichiometric ratio to a final concentration of 10 µM in a buffer containing 10 mM Tris–HCl pH 8.0, 100 mM NaCl and 2 mM TCEP. The protein–DNA complexes were subsequently mixed with 30 × Sypro Orange (Invitrogen/Molecular Probes) dye to a final volume of 10 µl. Unfolding was monitored in a Roche LC480 PCR device by recording the fluorescence emission at 568 nm upon excitation at 450 nm, while increasing the temperature from 25°C to 95°C in a 384-well plate.
Crystallization and data collection of Smad1 MH1 with DNA
The Smad1 MH1/SBE mixture was prepared by mixing 2:1.2 molar ratio of Smad1 MH1 protein to a 17-bp palindromic SBE with TTAA overhang (5′ AATCAGTCTAGACATAC 3′) DNA (36). The final concentration of the protein–DNA complex used for crystallization was 17 mg/ml as measured using the Bradford assay. Smad1 MH1 complex with the 17-bp palindromic SBE DNA with a TT & AA overhang gave diffraction quality crystals in 0.2 M ammonium tartrate dibasic, 20% PEG 3350, 10% glycerol and 3% 2-propanol (additive). Crystals were flash frozen in liquid nitrogen and a 2.7 Å dataset was collected at the beamline 13B1 in the Taiwan National Synchrotron Radiation Research Centre. The data were indexed, integrated and scaled using the HKL2000 software (41).
Structure solution and refinement
The poly-alanine structure of the Smad3 MH1 domain (PDB_id:1OZJ) after removal of waters and zinc ions was used as the search model for molecular replacement using PHASER integrated into the PHENIX suite of programs (42–43). Starting from the MR coordinates, the model was built manually into 2Fo–Fc and Fo−Fc maps using COOT (44). To monitor model bias a simulated annealing composite omit map was calculated at the start of the refinement using CNS (45). Five percent of the reflections were randomly assigned to the Rfree set for cross-validation. Manual model building was iterated by coordinate and isotropic B-factor refinement cycles using PHENIX.REFINE (46) by applying non-crystallographic symmetry (NCS) restraints on chain A and chain B monomers of Smad1 (excluding amino acids Glu31 and Glu110). Translation/Libration/Screw (TLS) refinement was used during final stages of the refinement by assigning four groups containing the two Smad1 MH1 molecules (chain A and B) and each strand of the duplex DNA (chain C and D). The CCP4 program Contact (47) was used for analyzing the protein–DNA and protein–protein contacts of the structure, PyMol was used for generating the figures (48) and topological DNA parameters were analyzed using the program 3DNA (49).
RESULTS AND DISCUSSION
Overall structure
The Smad1 MH1 complex with the palindromic SBE DNA structure (sequences given in Figure 1A and B) was solved by molecular replacement using a polyalanine model derived from the coordinates of the Smad3 MH1 structure (PDB id: 1OZJ) and the structure was refined to a final Rfree value of 25.0% including data to 2.7 Å resolution (Table 1). The asymmetric unit contains two monomers of the Smad1 MH1 domain (chain A and B) bound to the duplex palindromic SBE DNA (chain C and D) (Figure 1C and D).
Figure 1.

(A) Multiple sequence alignment of the MH1 domains of mouse Smads prepared using t_coffee (60) and boxshade (http://www.ch.embnet.org/software/BOX_form.html). Secondary structure elements as seen in the Smad1 structure are indicated above the alignments and asterisks mark pairing β-strands. The TGF-β/Smad specific α1/α2 insertion in Smad3 and Smad2 between helix α1 and helix α2 is marked with a red box. The highly conserved amino acid residues Arg74, Gln76 and Lys81 in the β-hairpin (β2–β3) contacting specific DNA nucleotides are marked by open circles. The arrow indicates a 30 amino acid insertion of Smad2 that was omitted for clarity. (B) The sequence of the 17-mer SBE DNA with TT–AA overhangs used for crystallization. The nucleotides which were not modeled in the structure are not numbered, while the other nucleotides are numbered as deposited in the PDB. The SBE palindrome GTCTAGAC is boxed and shown in blue. (C) A stereo view of the overall structure of Smad1 MH1 with two monomers of Smad1 MH1 shown as cartoon bound to palindromic SBE DNA in stick representation. α-Helices are colored in blue, β-sheets in orange and loop regions in green. All structural figures were prepared using pymol. The composite omit map of the DNA region calculated using CNS is shown in blue contoured at the 1.0σ-level. (D) Top view of the Smad1 MH1 with SBE DNA (rotated by 90° with respect to C). (E) Details of the zinc coordination site including Cys64, Cys109, Cys121 and His126. The electron density (2Fo−Fc) is displayed at the 2σ-level. (F) The alternate rotamers of the His79 residue showing one of the rotamers facing the glycerol and the other facing the DNA with (2Fo−Fc) electron density contoured at 1.0σ. The electron density of glycerol molecule is contoured at 0.7σ. The other amino acids Ser78 and Lys32 stabilizing the glycerol on either side are contoured at 1.0σ.
Table 1.
Crystallographic data
| Data collection | Smad1 MH1/SBE |
|---|---|
| Cell dimensions (Å) | |
| a | 73.94 |
| b | 77.49 |
| c | 83.78 |
| Space group | P212121 |
| Resolution (Å) | 30–2.7 Å (2.8–2.7 Å)a |
 |
5.8 (57) |
| I/σI | 22.5 (2.6) |
| Completeness (%) | 99.2 (100) |
| Multiplicity | 3.9 |
| Refinement | |
| Resolution (Å) | 23.4–2.7 |
| No. of reflections | 13623 |
Rwork/
|
20.6/25.0 |
| No. of atoms | |
| Protein/DNA | 2640 |
| Water | 9 |
| Zinc | 2 |
| Glycerol | 12 |
| Average isotropic (or equivalent) B-factors | |
| Macromolecule | 64.9 |
| Solvent | 35.4 |
| R.m.s deviations from ideal | |
| Bond lengths (Å) | 0.009 |
| Bond angles (°) | 1.355 |
| Ramachandran analysis (%) | |
| Favored | 97.5 |
| Additionally allowed | 2.5 |
| Disallowed | 0 |
aValues for the highest resolution shell in parentheses.
bRmerge = ΣhklΣi |Ii(hkl) − <I(hkl)> |/ΣhklΣi Ii(hkl), where Ii(hkl) and <I(hkl)> are the intensity of measurement i and the mean intensity for the reflection with indices hkl, respectively.
cRwork = Σhkl[∣∣Fobs∣ − k∣Fcalc∣∣]/Σhkl[∣Fobs∣]; Rfree = Σhkl⊂T [∣∣Fobs∣ − k∣Fcalc∣∣]/Σ hkl⊂T[∣Fobs∣]; hkl⊂T – test set.
Topological DNA parameters were analyzed using the program 3DNA (49) and were found to be largely characteristic for a standard B-form DNA with the exception of base-pair step parameters at the center of the palindrome. The twist at the center of the 2-fold axis (GTCT·AGAC) increased to 50°, while it decreased to 30° at the neighboring base-steps significantly deviating from the average of 35–36° found in canonical B-DNA. The roll angle is also moderately affected in this region. One of the adenine (A) nucleotides of the 5′ AA overhang in chain C of the duplex DNA and the 5′ TT nucleotide overhangs on chain D of the duplex DNA were disordered and could not be reliably modeled. Nucleotides at the ends of the DNA duplex exhibited high temperature factors and interrupted electron density in the region of the phosphate backbone but could still be modeled due to well-defined density outlining the base stacks. The 2Fo−Fc, composite omit electron density of the DNA around the functionally relevant protein–DNA contact region was well defined (Figure 1C).
The final model contains amino acid residues 9–132 in chain A and 10–132 amino acid residues in chain B of the mouse Smad1 protein. The amino acids residues 1–8 of chain A and 1–9 amino acids of chain B along with the N-terminal glycine residue derived from the TEV site lacked interpretable electron densities and were therefore excluded from the model. MH1 monomers are arranged around a non-crystallographic 2-fold axis and contact the same 4 bp Smad binding element on opposite faces of the DNA (Figure 1C and D). Each Smad1 MH1 domain adopts a globular fold consisting of four α-helices (α1–α4) and short β-strands (β1–β6) connected by loops.
Positive Fo−Fc density above the 5σ level and a favorable constellation of cysteine (Cys) and histidine (His) residues indicated the presence of a zinc ion (Figure 1E). Similarly, a zinc ion was reported at a structurally homologous site of Smad3 (19). An additional patch of positive Fo−Fc density near His79 was interpreted as a glycerol molecule. Glycerol was present in the crystallization medium and its presence in the structure is supported by a consistent hydrogen bonding pattern with nearby amino acids. The glycerol molecule was positioned in between the β-hairpin and α-helix1 (α1). His79 located in the loop connecting β2 and β3 existed in two alternative conformations with refined occupancy levels of 0.53 and 0.47. One of the rotamers in the alternative conformation of His79 contacts the glycerol molecule and the other rotamer points towards the DNA (Figure 1F). Nine spherically shaped 2Fo−Fc density maxima were interpreted as water oxygen.
Smad1 exhibits an ‘open’ domain-swapped conformation and is thermodynamically destabilized
When the N-terminal portion of Smad1 was modeled, it was found that the 2Fo-Fc electron density roughly aligned with helices 1 and 2 as seen in the Smad3 structure. However, the loop connecting both helices in Smad3 was not supported by the 2Fo−Fc and simulated annealing composite omit maps. Instead, rather than folding back into the body of the MH1 domain, continuous composite omit electron density indicated that the connecting loop protrudes into the body of a symmetry-related molecule facilitating a domain-swap of helix α1 (Figure 2A and B). As a consequence, helix α1 of Smad1 occupies an intermolecular binding site equivalent to an intramolecular binding site seen in Smad3. Careful inspection of the contact interfaces revealed that amino acids emanating from helix α1 mediating hydrophobic inter or intramolecular contacts in Smad1 or Smad3, respectively, are conserved and engage in virtually identical interactions with helices α2 and α3 (Leu18:Val34, Val14:Val38, Leu17:Leu51, Smad1 numbering). Next, we wondered whether the domain-swapped arrangement was serendipitously trapped during the crystallization of Smad1 or whether the compacted ‘closed’ conformation of Smad3 versus the extended ‘open’ conformation of Smad1 manifests structural and functional differences between both proteins. Domain swapping has been reported for diverse classes of proteins including transcription factors and signaling molecules and may occur in solution or constitute non-native states promoted by the crystallization condition (50–51). To study the assembly of Smad molecules in solution, we conducted dynamic light scattering experiments of Smad1 and Smad3 MH1 proteins (Supplementary Table S2). It was found that, in the absence of DNA, all tested Smads exist as monomers even at high concentrations and assemble with a 2:1 stoichiometry if the palindromic SBE DNA is present. This finding suggested that the domain-swap adopted during the crystallization experiment captures an otherwise atypical conformation. Nevertheless, three observations were made in support of different propensities of Smad1 and Smad3 to adopt open or closed conformations, respectively. First, the loop region connecting helices 1 and 2 was subject to insertion/deletion events during the paralogous evolution of Smads following early gene duplication events (Figure 1A). As opposed to sequences spanning the helices that are highly conserved between both proteins, Smad3 contains a three amino acid Gly–Glu–Gln insertion within the loop which we henceforth term the α1/α2-hinge. Amino acids adjacent to this insertion do also vary between Smad1 and Smad3. Secondly, Smad3 specific α1/α2-hinge residues release structural restraints and/or engaged in intramolecular contacts that are likely crucial for the sharp reversal of the direction of the peptide chain (Figure 2B). For example, Gly21 of the insertion may provide the necessary torsional freedom and the Smad3-specific residues Lys20 and Gln23 engage in side chain interactions facilitating the folding into the closed conformation. Since Smad1 is lacking the insertion and residues promoting the chain reversal it may favor adopting the open conformation with an extended helix α1. Thirdly, if the open and closed conformations seen for Smad1 and Smad3 represent true topological differences in solution one would expect varying thermodynamic stability. To test this aspect, the thermal stability of Smad1 and Smad3 were compared using CD and the thermofluor method. First, it was found that the CD spectra of the Smad1 MH1 and Smad3 MH1 domains in complex with the palindromic SBE DNA were nearly identical, consistent with the similar secondary structure content seen in the crystals (Figure 2C). However, when thermal unfolding curves were recorded, Smad1 was found to be significantly less heat resistant than Smad3, irrespective of the presence of DNA (Figure 2C). Heat-induced unfolding was also monitored using the thermofluor method and confirmed the higher heat sensitivity of Smad1 (Figure 2D). These in-solution experiments corroborated the crystallographic finding that Smad1 MH1 favored a thermodynamically less stable ‘open’ N–terminus as compared to the more compact Smad3 MH1. We therefore propose that Smad1 MH1 is more prone to adopt an open conformation and might alternate between ‘open’ and ‘closed’ conformations. On the contrary, Smad3 MH1 is structurally less flexible and contains structural elements locking it in the closed conformation.
Figure 2.

(A) Domain swap between adjacent symmetry-related Smad1 MH1/SBE complexes coloured in green, yellow and blue. The Smad3 MH1/SBE complex (1OZJ) colored in black is super imposed onto the blue Smad1 MH1/SBE. The domain swap region is boxed to highlight the difference in helix α1 between Smad1 MH1 and Smad3 MH1. Symmetry-related Smad1 molecules are indicated with asterisks and colored green and yellow. (B) Magnification of the domain swapped region boxed in A displaying the Smad1 α1/α2 hinge in green with corresponding composite omit map contoured at 1.0σ and helices α1 and helix α2 in blue. The corresponding region of Smad3 is shown in black with TGF-β specific α1/α2-hinge residues Gly21, Glu22 and Gln23 (Smad3 numbering) shown as sticks. (C) Thermal unfolding profiles of Smad1 MH1/SBE in black and Smad3 MH1/SBE in red recorded by measuring the CD signal at 222 nm when heating from 25°C to 95°C indicating a lower melting point of Smad1 MH1/SBE (58°C) and as compared to Smad3 MH1/SBE (67°C). Melting curves recorded in the absence of DNA are shown as dotted lines. Circular dichroism spectra of Smad1 MH1/SBE (black) and Smad3 MH1/SBE (red) complexes are included as an inset. (D) Thermofluor-based melting profiles of Smad1 MH1 and Smad3 MH1 in the presence of SBE DNA is plotted as a function of temperature (°C) versus –d(fluorescence)/dT. Smad1 MH1/SBE (black circle) shows a lower melting point compared to the Smad3 MH1/SBE (red triangle).
Smad1 exhibits re-arranged DNA contact interfaces
Next, the DNA binding interface of Smad1 was inspected and compared to Smad3 to better understand how BMP and TGF-β Smads discriminate between their specific sets of target genes. Specific base contacts are mediated by a β-hairpin formed by β2 (residues 75–77) and β3 (80–82) joined by a dipeptide loop (Ser78 and His79). The β-hairpin protrudes from the core of the otherwise globular MH1 domain and is inserted into the major groove of the DNA. Arginine 74 (Arg74), glutamine 76 (Gln76) and lysine 81 (Lys81) of the β-hairpin make specific contacts with the DNA bases with the A9G10A11C12 motif (Table 2, Figure 3A and B). A comparison of the crystal structures of Smad1 and Smad3 MH1 domains revealed that the base-specific DNA contacts are mediated by conserved amino acids adopting virtually identical conformations (Figures 1A and 3A). However, pronounced topological rearrangements were observed at other DNA contact regions. Specifically, the N-terminal portion of the helix α2 of Smad1 kinks away from DNA leading to a disruption of several DNA contacts maintained by corresponding residues of Smad3 (Figure 3D). Lys33 is conserved in Smad1 and Smad3 but while it forms a phosphate backbone interaction in Smad3 the displacement of helix α2 impedes DNA contacts in Smad1. Furthermore, the Lys36Ser37Smad3 dipeptide at the center of α2 of Smad3 is replaced by Asp35Ala36Smad1 in Smad1. Ser37Smad3 engages in a direct DNA phosphate backbone interaction in Smad3 and also interacts with Lys41Smad3 to position its side chain at the DNA contact interface; a function that is lost by Ala36Smad1. Lys36Smad3, while involved in direct DNA interaction likely supplies a favorable surface charge promoting DNA interaction; Asp35Smad1 would not promote this interaction. Consistently, the Lys36Ser37Smad3–Asp35Ala36Smad1 substitution had been reported to enable the discrimination between TFG-β and BMP target sites in mutagenesis and reporter assay in cell culture (35). Notably, α2 is connected to the α1/α2-hinge and its positioning away from the DNA interface may be a direct consequence of Smad-specific insertion/deletion events and the adoption of an open conformation of Smad1. Conversely, it is conceivable that the loss of DNA contacts facilitates the open conformation and the reduced thermal stability of Smad1. Hence, the open conformation and the loss of DNA contacts appear mutually entailing. To assess whether the loss of DNA backbone contacts affects the DNA binding, the affinity of TGF-β Smad3 and BMP Smad1 MH1 domains were compared upon binding to a single SBE. In agreement with the structural observations, the Smad1 MH1 domain bound with ∼2.5 × weaker affinity when compared to Smad3 (Figure 3C and Supplementary Figure S1). Since the nucleotide specific protein–DNA contacts were similar, the affinity loss of Smad1 can be attributed to the open conformation of Smad1 MH1 leading to structural rearrangements at helix α2 and the α1/α2 hinge.
Table 2.
Nucleotide-specific Smad1 MH1/SBE DNA contacts, phosphate backbone interactions and water-mediated DNA contacts (equivalent contacts by chain B are shown in parentheses)
| Interacting atoms | Distance (Å) |
|---|---|
| DNA base-specific contacts | |
| Arg74A/B NH1-G6D/5C N7 | 3.1 (3.1) |
| Arg74A/B NH2-G6D/5C O6 | 2.9 (3.0) |
| Gln76A/B OE1-A9C/10D N6 | 3.1 (3.1) |
| Gln76A/B O-T8C/9D O5 | 3.2 (3.5) |
| Lys81A/B NZ-A9C/10D N7 | 3.2 (3.1) |
| Lys 81A/B NZ-G10C/11D O6 | 3.3 (3.5) |
| DNA phosphate contacts | |
| Leu71A/B N-G10C/11D O2P | 3.0 (2.8) |
| Gln76A/B N-A9C/10D O2P | 3.0 (2.8) |
| Ser78A/B N-T8C/9D O2P | 3.0 (3.1) |
| His101A/B NE2-A4D/C3C O1P | 4.0 (2.9) |
| Lys40B NZ -W5 O-A10D O1P | 2.8–2.6 |
| Lys39A NZ -W7 O-T8C O1P | 2.9–2.8 |
Figure 3.

(A) A stereo view of protein–DNA interaction of Smad1 MH1 domain highlighting nucleotide-specific interactions of Arg74, Gln76 and Lys81 with the bases A9, G10, A11 and C12 of the SBE DNA. The water molecules, W5 and W7, mediating further interactions of are also shown. (B) Schematic drawing of the SBE DNA marking amino acids engaging in specific DNA contacts (black) as well as phosphate backbone and water-mediated contacts (blue). (C) Ten percent native gel showing 1nM SB DNA element (5′AGTATGTCTCAGATGA3′) incubated with increasing concentrations of Smad1 and Smad3 MH1 proteins. Protein concentrations used were 0, 0.61, 1.22, 2.44, 4.88, 9.77, 19.53, 39.06, 78.13, 156.25, 312.5, 625, 1250, 2500 and 5000 nM (from left to right). Vectors of fractions bound and corresponding protein concentrations were fit to Equation 1 (Supplementary Figure S1) and Kd’s were found to be 111.9 ± 14.5 nM for Smad1 and 41.6 ± 3.9 nM for Smad3 (mean ± standard deviation; n = 4). (D) A stereo view of the Smad1 MH1 in blue superimposed with Smad3 MH1 in black indicating the displacement of helix α2 with respect to the DNA and the loss of phosphate contacts in Smad1.
How do Smads discriminate between TGF-β and BMP response elements?
Studies in Drosophila, Xenopus and mammalian cell lines indicated that Smad1 is targeted to GC-rich BMP response elements (BRE) (22,30,52). EMSAs using cellular extracts containing transiently transfected proteins and luciferase reporter assays further supported the notion that Smad3 specifically recognizes GTCT type SBEs whereas Smad1 prefers GC-rich sites while retaining residual affinity for SBEs (31,53–55). Smad complexes are known to enter the nucleus as trimeric complexes and individual SBEs are too short to enable specific gene regulation. Consistently, composite Smad elements have been identified in many Smad-regulated genes (23,24,33,34). Palindromic SBEs as used in the present study have been found in a few Smad3 regulated genes (26) and GC-rich Smad1 element can be regarded as a ‘compressed’ palindrome spanning 6 instead of 8 nucleotides (33). It was therefore reasoned that despite invariant DNA contacts mediated by the DNA recognition β-hairpin, the Smad1-like ‘open’ and the Smad3-like ‘closed’ conformation could alter their preference to assemble on different composite motifs by affecting protein–protein interactions, the association kinetics or by imposing sterical constraints to bind to SBE-type and GC-type ‘compressed’ palindromes. To test this, a comparison of the binding of the MH1 domains of Smad1 and Smad3 to palindromic SBEs and the GC-rich element was carried out. Profoundly, although its overall affinity to DNA is lower, it was observed that Smad1 exhibits a strongly cooperative binding to the palindromic SBE, while Smad3 binds additively or weakly cooperative (Figure 4A and B). This finding suggests that the ‘open’ conformation of Smad1 facilitates the assembly of two Smad1 MH1 molecules, presumably by engaging in transient interactions during the association process when a second Smad1 MH1 molecule encounters the Smad1 MH1/DNA complex. The sequential docking of two compacted Smad3 MH1 molecules to the SBE DNA, however, occurs in a largely independent fashion as reflected by a ∼10-fold lower cooperativity factor (Figure 4B). Next, the binding of Smad1 and Smad3 to the GC-BRE was tested. Consistent with regarding the GC-rich element as a ‘compressed palindrome’, a 2:1 ratio of Smad1 and Smad3 MH1 was observed when binding to this element (Figure 4C). The trend of a more cooperative binding mode of Smad1 when compared to Smad3 was also observed for the GC-BRE element (Figure 4C). However, to our surprise, it was found that the overall affinity of Smad1 to the SBE and GC-BRE was similar (Figure 4A and C). Furthermore, both, Smad3 and Smad1 MH1, exhibited similar affinities for the GC-BRE (Figure 4C). The promoters of the reported BMP responsive genes contain both the GC-rich compressed palindrome and the GTCT elements (23). Our data indicate that the Smad1 MH1 assembles on GC-rich compressed palindromes as efficiently as on the SBE palindromes in agreement with observations that Smad1 is capable of recognizing and regulating genes with GC-BREs. However, our results do not support the notion that the Smad1 MH1 is selective for GC-rich elements as found in BREs. Previous studies that biochemically define a GC-rich element as selective for Smad1 were done using full-length Smad proteins expressed in mammalian or insect cell culture leading to the formation of Smad4 containing trimeric complexes (31,33). Since Smad1 MH1 alone does not appear to prefer GC-rich sequences it is conceivable that such trimeric complexes exhibit an altered selectivity pattern of its components, such as Smad1, which could, for example, be allosterically induced by Smad4. It remains to be explored how exactly Smad4 affects the DNA binding of Smad1 and Smad3 as well as how constrained motif configurations and transcription factor multimerization influence the process of selective promoter recognition.
Figure 4.

(A) Cooperativity of Smad1 and Smad3 on the palindromic SBE element. Ten percent native gel showing the binding of Smad1 MH1 and Smad3 MH1 to 1 nM of SBE palindromic DNA (5′TGAGTCTAGACATAC3′). The protein concentrations used were 0, 0.61, 1.22, 2.44, 4.88, 9.77, 19.53, 39.06, 78.13, 156.25, 312.5, 625, 1250, 2500 and 5000 nM (from left to right). Experiments were performed in triplicates. (B) Box-plot representing the cooperativity factor (ω = kd1/kd2) for Smad1 and Smad3 binding to the SBE palindromic element calculated as described in the ‘Materials and Methods’ section for 5–6 independent measurements including lanes where the weakest band contributed a fraction bound of at least 10%. The P-value was derived by performing a Welch two-sample t-test using R. (C) Ten percent native gel with 1 nM GC-BRE (5′CGCCTGGCGCCAGAGA) incubated with increasing concentrations of Smad1 and Smad3 MH1 proteins. Protein concentrations used were 0, 0.61, 1.22, 2.44, 4.88, 9.77, 19.53, 39.06, 78.13, 156.25, 312.5, 625, 1250, 2500 and 5000 nM (from left to right). Experiments were performed in triplicates.
CONCLUSION AND OUTLOOK
It is a major puzzle in the biology of gene expression how transcription factors that bind similar DNA motifs and exhibit high-sequence conservation at protein–DNA interfaces are still capable of selectively binding to enhancers of specific sets of target genes even if expressed in the same cell type (29,56). The present study suggests a mechanism how Smad1 and Smad3 discriminate between the regulatory DNA sequences to elicit BMP and TGF-β-specific responses despite the staggering conservation of specific contacts to DNA bases. We observed two major unanticipated features of Smad1 structurally separating it from Smad3. First, an open domain-swapped conformation at the N-terminus and secondly a loss of DNA contacts with respect to Smad3. Both phenomena are likely a result of insertion/deletion events and amino acid substitutions independently occurring in BMP and TGF-β Smads at the α1/α2 hinge and helix α2. Indeed, thermal melting studies and DNA binding assays indicated that Smad1 exhibits an open and decompacted conformation and a more cooperative binding mode as compared to the compact Smad3. Importantly, these results demonstrate how the divergent evolution at regions not involved in base-specific DNA contacts can lead to structural rearrangements affecting DNA binding. Also, selection of target sequences by Smads is thought to be partially achieved by cooperating with other transcription factors and there are multiple reports indicating differing co-factor interactions of Smad1 and Smad3 (57–59). The structural differences of Smad1 with an open and Smad3 with a closed N-terminus could provide selective binding platforms enabling both proteins to team up with specific sets of co-factors. Finally, Smads are thought to bind DNA as heterotrimeric complexes consisting of two R-Smads and one Smad4 molecule and Smad1 and Smad3 are thought to target different composite sites (6). Consistently, the structural differences between Smad1 and Smad3 affect their potential to homodimerize and cooperate on differently configured composite sites. Further studies should carefully explore the nature of composite Smad elements and how they preferentially recruit specific Smad complexes. An unbiased identification of Smad1- and Smad3-specific composite DNA elements is necessary to conduct such studies.
ACCESSION NUMBER
Coordinates and structure factors have been submitted to the protein databank with the accession number 3KMP and RCSB ID rcsb056183.
SUPPLEMENTARY DATA
Supplementary Data are available at NAR Online.
FUNDING
Agency for Science, Technology and Research, Singapore; The Synchrotron Radiation Protein Crystallography Facility is supported by the National Research Program for Genomic Medicine, Taiwan. Funding for open access charge: Agency for Science, Technology and Research, Singapore.
Conflict of interest statement. None declared.
Supplementary Material
ACKNOWLEDGEMENTS
We sincerely acknowledge Dr Bob Robinson for his help with the X-ray data collection, and comments on the article. We thank Dr Kini R. Manjunatha for advice and guidance throughout the project and Dr Andrew Hutchins for comments on the article. We are grateful to the National Synchrotron Radiation Research Center Tawain for access to the synchrotron radiation beamline 13B1 and for providing assistance in data collection. We are grateful to Calista Keow Leng Ng and Choo Siew Hua for technical support.
REFERENCES
- 1.Massagué J. TGF-beta signal transduction. Annu. Rev. Biochem. 1998;67:753–791. doi: 10.1146/annurev.biochem.67.1.753. [DOI] [PubMed] [Google Scholar]
- 2.Massague J, Seoane J, Wotton D. Smad transcription factors. Genes Dev. 2005;19:2783–2810. doi: 10.1101/gad.1350705. [DOI] [PubMed] [Google Scholar]
- 3.Schmierer B, Hill CS. TGFbeta-SMAD signal transduction: molecular specificity and functional flexibility. Nat. Rev. Mol. Cell Biol. 2007;8:970–982. doi: 10.1038/nrm2297. [DOI] [PubMed] [Google Scholar]
- 4.Kingsley D. The TGF-beta superfamily: new members, new receptors, and new genetic tests of function in different organisms. Genes Dev. 1994;8:133–146. doi: 10.1101/gad.8.2.133. [DOI] [PubMed] [Google Scholar]
- 5.Whitman M. Smads and early developmental signaling by the TGFbeta superfamily. Genes Dev. 1998;12:2445–2462. doi: 10.1101/gad.12.16.2445. [DOI] [PubMed] [Google Scholar]
- 6.Chacko B, Qin B, Tiwari A, Shi G, Lam S, Hayward L, De Caestecker M, Lin K. Structural basis of heteromeric smad protein assembly in TGF-beta signaling. Mol. Cell. 2004;15:813–823. doi: 10.1016/j.molcel.2004.07.016. [DOI] [PubMed] [Google Scholar]
- 7.Qin BY, Chacko BM, Lam SS, de Caestecker MP, Correia JJ, Lin K. Structural basis of Smad1 activation by receptor kinase phosphorylation. Mol. Cell. 2001;8:1303–1312. doi: 10.1016/s1097-2765(01)00417-8. [DOI] [PubMed] [Google Scholar]
- 8.Jayaraman L, Massague J. Distinct oligomeric states of SMAD proteins in the transforming growth factor-beta pathway. J. Biol. Chem. 2000;275:40710–40717. doi: 10.1074/jbc.M005799200. [DOI] [PubMed] [Google Scholar]
- 9.ten Dijke P, Miyazono K, Heldin C. Signaling inputs converge on nuclear effectors in TGF-beta signaling. Trends Biochem. Sci. 2000;25:64–70. doi: 10.1016/s0968-0004(99)01519-4. [DOI] [PubMed] [Google Scholar]
- 10.Wu J, Hu M, Chai J, Seoane J, Huse M, Li C, Rigotti D, Kyin S, Muir T, Fairman R, et al. Crystal structure of a phosphorylated Smad2. Recognition of phosphoserine by the MH2 domain and insights on Smad function in TGF-beta signaling. Mol. Cell. 2001;8:1277–1289. doi: 10.1016/s1097-2765(01)00421-x. [DOI] [PubMed] [Google Scholar]
- 11.Yamamoto M, Beppu H, Takaoka K, Meno C, Li E, Miyazono K, Hamada H. Antagonism between Smad1 and Smad2 signaling determines the site of distal visceral endoderm formation in the mouse embryo. J. Cell Biol. 2009;184:323–334. doi: 10.1083/jcb.200808044. [DOI] [PMC free article] [PubMed] [Google Scholar]
- 12.Hoodless P, Haerry T, Abdollah S, Stapleton M, O'C;onnor M, Attisano L, Wrana J. MADR1, a MAD-related protein that functions in BMP2 signaling pathways. Cell. 1996;85:489–500. doi: 10.1016/s0092-8674(00)81250-7. [DOI] [PubMed] [Google Scholar]
- 13.Kawai S, Faucheu C, Gallea S, Spinella-Jaegle S, Atfi A, Baron R, Roman S. Mouse smad8 phosphorylation downstream of BMP receptors ALK-2, ALK-3, and ALK-6 induces its association with Smad4 and transcriptional activity. Biochem. Biophys. Res. Commun. 2000;271:682–687. doi: 10.1006/bbrc.2000.2704. [DOI] [PubMed] [Google Scholar]
- 14.Macías-Silva M, Abdollah S, Hoodless P, Pirone R, Attisano L, Wrana J. MADR2 is a substrate of the TGFbeta receptor and its phosphorylation is required for nuclear accumulation and signaling. Cell. 1996;87:1215–1224. doi: 10.1016/s0092-8674(00)81817-6. [DOI] [PubMed] [Google Scholar]
- 15.Nishimura R, Kato Y, Chen D, Harris S, Mundy G, Yoneda T. Smad5 and DPC4 are key molecules in mediating BMP-2-induced osteoblastic differentiation of the pluripotent mesenchymal precursor cell line C2C12. J. Biol. Chem. 1998;273:1872–1879. doi: 10.1074/jbc.273.4.1872. [DOI] [PubMed] [Google Scholar]
- 16.Zhang Y, Feng X, We R, Derynck R. Receptor-associated Mad homologues synergize as effectors of the TGF-beta response. Nature. 1996;383:168–172. doi: 10.1038/383168a0. [DOI] [PubMed] [Google Scholar]
- 17.Fortuno Er, LeSueur J, Graff J. The amino terminus of Smads permits transcriptional specificity. Dev. Biol. 2001;230:110–124. doi: 10.1006/dbio.2000.0111. [DOI] [PubMed] [Google Scholar]
- 18.Müller F, Blader P, Rastegar S, Fischer N, Knöchel W, Strähle U. Characterization of zebrafish smad1, smad2 and smad5: the amino-terminus of smad1 and smad5 is required for specific function in the embryo. Mech. Dev. 1999;88:73–88. doi: 10.1016/s0925-4773(99)00173-2. [DOI] [PubMed] [Google Scholar]
- 19.Chai J, Wu J, Yan N, Massagué J, Pavletich N, Shi Y. Features of a Smad3 MH1-DNA complex. Roles of water and zinc in DNA binding. J. Biol. Chem. 2003;278:20327–20331. doi: 10.1074/jbc.C300134200. [DOI] [PubMed] [Google Scholar]
- 20.Shi Y, Wang Y, Jayaraman L, Yang H, Massagué J, Pavletich N. Crystal structure of a Smad MH1 domain bound to DNA: insights on DNA binding in TGF-beta signaling. Cell. 1998;94:585–594. doi: 10.1016/s0092-8674(00)81600-1. [DOI] [PubMed] [Google Scholar]
- 21.Brugger S, Merrill A, Torres-Vazquez J, Wu N, Ting M, Cho J, Dobias S, Yi S, Lyons K, Bell J, et al. A phylogenetically conserved cis-regulatory module in the Msx2 promoter is sufficient for BMP-dependent transcription in murine and Drosophila embryos. Development. 2004;131:5153–5165. doi: 10.1242/dev.01390. [DOI] [PubMed] [Google Scholar]
- 22.Ishida W, Hamamoto T, Kusanagi K, Yagi K, Kawabata M, Takehara K, Sampath T, Kato M, Miyazono K. Smad6 is a Smad1/5-induced smad inhibitor. Characterization of bone morphogenetic protein-responsive element in the mouse Smad6 promoter. J. Biol. Chem. 2000;275:6075–6079. doi: 10.1074/jbc.275.9.6075. [DOI] [PubMed] [Google Scholar]
- 23.Karaulanov E, Knöchel W, Niehrs C. Transcriptional regulation of BMP4 synexpression in transgenic Xenopus. EMBO J. 2004;23:844–856. doi: 10.1038/sj.emboj.7600101. [DOI] [PMC free article] [PubMed] [Google Scholar]
- 24.López-Rovira T, Chalaux E, Massagué J, Rosa J, Ventura F. Direct binding of Smad1 and Smad4 to two distinct motifs mediates bone morphogenetic protein-specific transcriptional activation of Id1 gene. J. Biol. Chem. 2002;277:3176–3185. doi: 10.1074/jbc.M106826200. [DOI] [PubMed] [Google Scholar]
- 25.Dennler S, Itoh S, Vivien D, ten Dijke P, Huet S, Gauthier J. Direct binding of Smad3 and Smad4 to critical TGF beta-inducible elements in the promoter of human plasminogen activator inhibitor-type 1 gene. EMBO J. 1998;17:3091–3100. doi: 10.1093/emboj/17.11.3091. [DOI] [PMC free article] [PubMed] [Google Scholar]
- 26.Jonk L, Itoh S, Heldin C, ten Dijke P, Kruijer W. Identification and functional characterization of a Smad binding element (SBE) in the JunB promoter that acts as a transforming growth factor-beta, activin, and bone morphogenetic protein-inducible enhancer. J. Biol. Chem. 1998;273:21145–21152. doi: 10.1074/jbc.273.33.21145. [DOI] [PubMed] [Google Scholar]
- 27.Nagarajan R, Zhang J, Li W, Chen Y. Regulation of Smad7 promoter by direct association with Smad3 and Smad4. J. Biol. Chem. 1999;274:33412–33418. doi: 10.1074/jbc.274.47.33412. [DOI] [PubMed] [Google Scholar]
- 28.Zawel L, Dai J, Buckhaults P, Zhou S, Kinzler K, Vogelstein B, Kern S. Human Smad3 and Smad4 are sequence-specific transcription activators. Mol. Cell. 1998;1:611–617. doi: 10.1016/s1097-2765(00)80061-1. [DOI] [PubMed] [Google Scholar]
- 29.Badis G, Berger MF, Philippakis AA, Talukder S, Gehrke AR, Jaeger SA, Chan ET, Metzler G, Vedenko A, Chen X, et al. Diversity and complexity in DNA recognition by transcription factors. Science. 2009;324:1720–1723. doi: 10.1126/science.1162327. [DOI] [PMC free article] [PubMed] [Google Scholar]
- 30.Kim J, Johnson K, Chen HJ, Carroll S, Laughon A. Drosophila Mad binds to DNA and directly mediates activation of vestigial by Decapentaplegic. Nature. 1997;388:304–308. doi: 10.1038/40906. [DOI] [PubMed] [Google Scholar]
- 31.Kusanagi K, Inoue H, Ishidou Y, Mishima HK, Kawabata M, Miyazono K. Characterization of a bone morphogenetic protein-responsive Smad-binding element. Mol. Biol. Cell. 2000;11:555–565. doi: 10.1091/mbc.11.2.555. [DOI] [PMC free article] [PubMed] [Google Scholar]
- 32.Makkar P, Metpally R, Sangadala S, Reddy B. Modeling and analysis of MH1 domain of Smads and their interaction with promoter DNA sequence motif. J. Mol. Graph Model. 2009;27:803–812. doi: 10.1016/j.jmgm.2008.12.003. [DOI] [PubMed] [Google Scholar]
- 33.Gao S, Laughon A. Decapentaplegic-responsive silencers contain overlapping mad-binding sites. J. Biol. Chem. 2006;281:25781–25790. doi: 10.1074/jbc.M603371200. [DOI] [PubMed] [Google Scholar]
- 34.Gao S, Laughon A. Flexible interaction of Drosophila Smad complexes with bipartite binding sites. Biochim. Biophys. Acta. 2007;1769:484–496. doi: 10.1016/j.bbaexp.2007.05.006. [DOI] [PubMed] [Google Scholar]
- 35.Kusanagi K, Kawabata M, Mishima HK, Miyazono K. Alpha-helix 2 in the amino-terminal mad homology 1 domain is responsible for specific DNA binding of Smad3. J. Biol. Chem. 2001;276:28155–28163. doi: 10.1074/jbc.M103371200. [DOI] [PubMed] [Google Scholar]
- 36.Baburajendran N, Palasingam P, Ng C.KL, Jauch R, Kolatkar P. Crystal optimization and preliminary diffraction data analysis of the Smad1 MH1 domain bound to a palindromic SBE DNA element. Acta Crystallogr. F. 2009;65:1105–1109. doi: 10.1107/S1744309109037476. [DOI] [PMC free article] [PubMed] [Google Scholar]
- 37.De Marco V, Stier G, Blandin S, de Marco A. The solubility and stability of recombinant proteins are increased by their fusion to NusA. Biochem. Biophys. Res. Commun. 2004;322:766–771. doi: 10.1016/j.bbrc.2004.07.189. [DOI] [PubMed] [Google Scholar]
- 38.Nallamsetty S, Austin BP, Penrose KJ, Waugh DS. Gateway vectors for the production of combinatorially-tagged His6-MBP fusion proteins in the cytoplasm and periplasm of Escherichia coli. Protein Sci. 2005;14:2964–2971. doi: 10.1110/ps.051718605. [DOI] [PMC free article] [PubMed] [Google Scholar]
- 39.Jauch R, Ng CK, Saikatendu KS, Stevens RC, Kolatkar PR. Crystal structure and DNA binding of the homeodomain of the stem cell transcription factor Nanog. J. Mol. Biol. 2008;376:758–770. doi: 10.1016/j.jmb.2007.11.091. [DOI] [PubMed] [Google Scholar]
- 40.Wilkinson KD. Protein-protein interactions: methods and applications. Methods Mol. Biol. 2004;261:15–31. doi: 10.1385/1-59259-762-9:015. [DOI] [PubMed] [Google Scholar]
- 41.Otwinowski Z, Minor W. Processing of X-ray diffraction data collected in oscillation mode. Methods Enzymol. 1997;276:307–326. doi: 10.1016/S0076-6879(97)76066-X. [DOI] [PubMed] [Google Scholar]
- 42.McCoy AJ, Grosse-Kunstleve RW, Adams PD, Winn MD, Storoni LC, Read RJ. Phaser crystallographic software. J. Appl. Crystallogr. 2007;40:658–674. doi: 10.1107/S0021889807021206. [DOI] [PMC free article] [PubMed] [Google Scholar]
- 43.Adams PD, Gopal K, Grosse-Kunstleve RW, Hung LW, Ioerger TR, McCoy AJ, Moriarty NW, Pai RK, Read RJ, Romo TD, et al. Recent developments in the PHENIX software for automated crystallographic structure determination. J. Synchrotron. Radiat. 2004;11:53–55. doi: 10.1107/s0909049503024130. [DOI] [PubMed] [Google Scholar]
- 44.Emsley P, Cowtan K. Coot: model-building tools for molecular graphics. Acta Crystallogr. D Biol. Crystallogr. 2004;60:2126–2132. doi: 10.1107/S0907444904019158. [DOI] [PubMed] [Google Scholar]
- 45.Brunger AT, Adams PD, Clore GM, DeLano WL, Gros P, Grosse-Kunstleve RW, Jiang JS, Kuszewski J, Nilges M, Pannu NS, et al. Crystallography & NMR system: a new software suite for macromolecular structure determination. Acta Crystallogr. D Biol. Crystallogr. 1998;54:905–921. doi: 10.1107/s0907444998003254. [DOI] [PubMed] [Google Scholar]
- 46.Afonine PV, Grosse-Kunstleve RW, Adams PD. A robust bulk-solvent correction and anisotropic scaling procedure. Acta Crystallogr. D Biol. Crystallogr. 2005;61:850–855. doi: 10.1107/S0907444905007894. [DOI] [PMC free article] [PubMed] [Google Scholar]
- 47.Collaborative Computational Project N. The CCP4 Suite: programs for protein crystallography. Acta Crystallogr. D. 1994;50:760–763. doi: 10.1107/S0907444994003112. [DOI] [PubMed] [Google Scholar]
- 48.DeLano WL. The PyMOL Molecular Graphics System. USA: DeLano Scientific, San Carlos, CA; 2002. [Google Scholar]
- 49.Lu XJ, Olson WK. 3DNA: a software package for the analysis, rebuilding and visualization of three-dimensional nucleic acid structures. Nucleic Acids Res. 2003;31:5108–5121. doi: 10.1093/nar/gkg680. [DOI] [PMC free article] [PubMed] [Google Scholar]
- 50.Stroud JC, Wu Y, Bates DL, Han A, Nowick K, Paabo S, Tong H, Chen L. Structure of the forkhead domain of FOXP2 bound to DNA. Structure. 2006;14:159–166. doi: 10.1016/j.str.2005.10.005. [DOI] [PubMed] [Google Scholar]
- 51.Jauch R, Jakel S, Netter C, Schreiter K, Aicher B, Jackle H, Wahl MC. Crystal structures of the Mnk2 kinase domain reveal an inhibitory conformation and a zinc binding site. Structure. 2005;13:1559–1568. doi: 10.1016/j.str.2005.07.013. [DOI] [PubMed] [Google Scholar]
- 52.Henningfeld KA, Rastegar S, Adler G, Knochel W. Smad1 and Smad4 are components of the bone morphogenetic protein-4 (BMP-4)-induced transcription complex of the Xvent-2B promoter. J. Biol. Chem. 2000;275:21827–21835. doi: 10.1074/jbc.M000978200. [DOI] [PubMed] [Google Scholar]
- 53.Alvarez Martinez CE, Binato R, Gonzalez S, Pereira M, Robert B, Abdelhay E. Characterization of a Smad motif similar to Drosophila mad in the mouse Msx 1 promoter. Biochem. Biophys. Res. Commun. 2002;291:655–662. doi: 10.1006/bbrc.2002.6502. [DOI] [PubMed] [Google Scholar]
- 54.Park GT, Morasso MI. Bone morphogenetic protein-2 (BMP-2) transactivates Dlx3 through Smad1 and Smad4: alternative mode for Dlx3 induction in mouse keratinocytes. Nucleic Acids Res. 2002;30:515–522. doi: 10.1093/nar/30.2.515. [DOI] [PMC free article] [PubMed] [Google Scholar]
- 55.von Bubnoff A, Peiffer DA, Blitz IL, Hayata T, Ogata S, Zeng Q, Trunnell M, Cho KW. Phylogenetic footprinting and genome scanning identify vertebrate BMP response elements and new target genes. Dev. Biol. 2005;281:210–226. doi: 10.1016/j.ydbio.2005.02.014. [DOI] [PubMed] [Google Scholar]
- 56.Palasingam P, Jauch R, Ng CK, Kolatkar PR. The structure of Sox17 bound to DNA reveals a conserved bending topology but selective protein interaction platforms. J. Mol. Biol. 2009;388:619–630. doi: 10.1016/j.jmb.2009.03.055. [DOI] [PubMed] [Google Scholar]
- 57.Chen X, Rubock MJ, Whitman M. A transcriptional partner for MAD proteins in TGF-beta signalling. Nature. 1996;383:691–696. doi: 10.1038/383691a0. [DOI] [PubMed] [Google Scholar]
- 58.Alarcon C, Zaromytidou AI, Xi Q, Gao S, Yu J, Fujisawa S, Barlas A, Miller AN, Manova-Todorova K, Macias MJ, et al. Nuclear CDKs drive Smad transcriptional activation and turnover in BMP and TGF-beta pathways. Cell. 2009;139:757–769. doi: 10.1016/j.cell.2009.09.035. [DOI] [PMC free article] [PubMed] [Google Scholar]
- 59.Massague J, Wotton D. Transcriptional control by the TGF-beta/Smad signaling system. EMBO J. 2000;19:1745–1754. doi: 10.1093/emboj/19.8.1745. [DOI] [PMC free article] [PubMed] [Google Scholar]
- 60.Notredame C, Higgins DG, Heringa J. T-Coffee: A novel method for fast and accurate multiple sequence alignment. J. Mol. Biol. 2000;302:205–217. doi: 10.1006/jmbi.2000.4042. [DOI] [PubMed] [Google Scholar]
Associated Data
This section collects any data citations, data availability statements, or supplementary materials included in this article.