


Abstract
DNA-binding proteins perform vital functions related to transcription, repair and replication. We have developed a new sequence-based machine learning protocol to identify DNA-binding proteins. We compare our method with an extensive benchmark of previously published structure-based machine learning methods as well as a standard sequence alignment technique, BLAST. Furthermore, we elucidate important feature interactions found in a learned model and analyze how specific rules capture general mechanisms that extend across DNA-binding motifs. This analysis is carried out using the malibu machine learning workbench available at http://proteomics.bioengr.uic.edu/malibu and the corresponding data sets and features are available at http://proteomics.bioengr.uic.edu/dna.
INTRODUCTION
DNA-binding proteins maintain, regulate, read and replicate the fundamental code of life, DNA. These proteins perform a diverse set of functions and span a correspondingly diverse set of families having low-sequence similarity. However, they are grouped together by one well-defined characteristic: they all interact with DNA. Due to the importance of DNA-binding functions, it is desirable to develop a genome-scale method to identify such proteins.
A number of techniques both computational and experimental have been developed to identify proteins that bind DNA and model interactions (1). Specific experimental techniques range from filter binding assays (2) to chromatin immunoprecipitation on microarrays (ChIP-chip) (3). More general techniques, e.g. genetic analysis (4) and X-ray crystallography (5), can be used to provide a detailed picture of binding at the expense of time and money. Hence, a number of in silico efforts have investigated informative feature representations over a range of machine learning algorithms. For example, several groups have investigated structure-based features for specific DNA-binding structural motifs (e.g. helix-turn-helix) achieving 78% and 71% accuracy using a hidden Markov model (6,7). Likewise, previous work has also focused on a wider range of DNA-binding proteins using a more general set of structure-based attributes in conjunction with neural networks (8,9) and random forests (10). This trend was further extended to low-resolution homology models using logistic regression and a novel set of structure descriptors (11) and using unsupervised techniques (12). In addition, a number of works have used physicochemical properties to classify full-length sequences (13–15) (as opposed to single domains). Notwithstanding, a number of methods (8,16–23) have been developed to identify DNA-binding residues. While knowing whether a protein contains residues that bind DNA should be sufficient to categorize a protein as DNA binding, current best results suggest otherwise (24,25).
In previously published work, we have investigated the prediction of proteins that bind DNA, RNA (24,25) and membrane (25,26) using a combination of sequence and structure features. Specifically, we achieved a balanced 86% accuracy (leave-pair-out iterated holdout) using support vector machines (SVM) to discriminate DNA-binding proteins that outperformed all previously published results. Both previous and current works use the malibu open source machine learning workbench (27).
In this work, we address limitations of previously published work. First, while the number of solved structures continues to increase at a fast pace, <1% of proteins have a solved structure; this motivates our interest in reliable sequence representations. Szilagyi and Skolnick (11) attempted to resolve this issue by benchmarking their prediction algorithm on low-resolution structures. However, this technique requires knowledge of specific domain boundaries on the sequence, which limits their training set (predictive power of their algorithm) and its application. Our proposed technique only requires a sequence and does not require domain boundaries scaling to full-length sequences. Second, the rules that lead to a prediction are often just as important as the prediction itself. Several published works (11,24,25) analyze the models learned by simple linear models. However, these approaches lack the ability to elucidate relationships between features only their relative importance or correlation. Here, we consider a learning algorithm, ADTree, which has a predictive power comparable with other advanced machine learning techniques yet provides clear relationships between features.
In the following, we will introduce the data sets, representation and classifiers used to evaluate the performance of the proposed approach. Then we will present results both comparing directly to five previously published works and analyzing the rules extracted from the learned model. This will be followed by a discussion of the results and future work.
MATERIALS AND METHODS
Data set
In order to compare with previous published work, we have recreated five previously published data sets (Table 1). The DNA-binding proteins for each data set originated from one of two sources: the work of Luscombe and Thornton (28) and the Nucleic Acid Database (29). First, based on Luscombe and Thornton (28), Stawiski et al. (30) collected a set of 54 DNA-binding protein chains with no more than 35% sequence identity (JMB03). Subsequently, Ahmad and Sarai (9) compiled a set of 78 DNA-binding protein chains from a set of 62 representative structures (JMB04) and Bhardwaj et al. (24) combined the data sets of both Stawiski and Ahmad producing a set of 121 DNA-binding protein chains (NAR05). Langlois et al. (25) filtered Bhardwaj's; data set to 20% identity yielding 75 protein chains (ABME07). Second, Szilagyi and Skolnick (11) went on to construct the largest set of 138 DNA-binding protein chains using the Nucleic Acid Database (JMB06).
Table 1.
Statistics of data sets used in this work
| Example | Pos. | Neg. | Identity | |
|---|---|---|---|---|
| JMB03 | 304 | 54 | 250 | 35/25 |
| JMB04 | 188 | 78 | 110 | 25?/25 |
| NAR05 | 359 | 121 | 238 | 35/25? |
| JMB06 | 248 | 138 | 110 | 35/25 |
| ABME07 | 289 | 75 | 214 | 20 |
| LEAC35 | 388 | 138 | 250 | 35/25 |
| LEAC25 | 372 | 122 | 250 | 25/25 |
In the identity column, the first number refers to the identity of the positive set and the second the negative set. ? indicates there is some question to the accuracy of the number.
Since a classifier requires both positive and negative examples, each of the aforementioned work also constructed a set of proteins known not to bind DNA. Many studies (24,25,30) used the PDBSELECT database (31) applying a 25% identity cutoff to yield 250 protein chains. Others (24) used a subset of the PDBSELECT, 238 proteins and Langlois et al. (25) used a more stringent 20% identity cutoff yielding 214 proteins from this same set. Finally, two works (9,11) started with a representative 126 set of PDB chains (32) excluding DNA-binding proteins giving a set of 110 protein chains.
We also created two more data sets. The first data set combines the positive set from Szilagyi and Skolnick (11) and the negative set from Stawiski et al. (30) creating a data set with 388 protein examples (denoted as LEAC35 that stands for local environment amino acid composition). The second data set is similar to the first except that the proteins in the positive set have been filtered such that no two proteins share >25% sequence identity using the Pisces Server (33) (LEAC25).
Feature representation
Most supervised machine learning algorithms require the examples in a data set to have a fixed number of numerical attributes describing the object of interest. We present a novel representation of protein sequences called LEAC. It considers both the type and environment of an amino acid when calculating the composition of a sequence. Since the structure of a protein performs a vital role in its function, a powerful feature representation will leverage structure information. Indeed, the secondary structure (local regular structures) can be assigned with some accuracy from sequence. The current implementation utilizes secondary structure propensities (34) using a window similar to the original Chou–Fasman (35) of eight residues on either side (using any window size from 6–10 yields similar results). Note that while pseudo amino acid composition (36) also represents physico chemical properties of sequence, it is primary concerned with encoding sequence order correlations. In contrast, the LEAC sequence representation attempts to encode a set of special residue types conditioned on the local environment.
Figure 1 illustrates the algorithm for calculating this feature. First, the environment for a sequence is defined as a property calculated over some window around (not including) the current residue. In the figure, both beta sheet and alpha helix propensity are summed,  , over a window of three amino acids on each side of the current residue (a lysine). Second, the property summed over the windows is compared with a threshold yielding a single digit of a binary number. Finally, this binary number is converted to a decimal index of a composition array, which is incremented by one.
Figure 1.

Illustration of the calculation of local environment amino acid composition.
Three versions of this descriptor are calculated, where for each version two properties are considered. For example, in one version the helix and sheet propensity using a window around a specific amino acid is compared against a threshold of 1 (the average of the property over each type). Thus, for each amino acid, there are now four amino acid types where: helix and sheet both exceed the threshold; helix exceeds the threshold; sheet exceeds the threshold; and neither exceeds the threshold. The other two versions consider (helix, turn) and (sheet, turn). Note, for each version we have 80 features yielding 240 when combining them together.
Two additional feature types compose the complete feature description. The first is dipeptide composition, which does not maintain the amino acid order (including unknown amino acids) comprising 231 features. The third feature type sums a certain property over the entire sequence. In this case, we consider only the total charge over the protein. While normalizing these features to sequence length yields slightly better results, the normalized values are less interpretable in the ADTree model. In sum, there are 472 features to describe each protein.
Classifiers
The following work utilizes two classifiers: boosted decision trees and the ADTree. The boosted decision tree classifier has an expressive model yet is resistant to overfitting; a feature found in all state-of-the-art classifiers. It serves as a basis to compare the new sequence representation to those of previous work. The ADTree classifier, however, has an interpretable model that performs reasonably well on many data sets. It serves to illustrate the relationships between important rules making a prediction.
Boosted decision trees
The AdaBoost (37) algorithm builds a weighted committee of weak learning algorithms each trained over a biased distribution of the data set. Specifically, the first classifier is trained over an unbiased, uniform distribution and every subsequent classifier uses a distribution biased toward mistaken instances on previous rounds. Our current implementation of the confidence-rated (38) AdaBoost algorithm uses a custom decision tree with non-standard impurity (39) as the weak learner. The number of boosting iterations was chosen to be about five times the number examples in the largest data set with 2048 iterations. The decision trees are grown such that they reach no more than 90% accuracy.
Alternating decision tree
The alternating decision tree (ADTree) algorithm (37) builds an option tree (a voted decision tree) using the confidence-rated boosting algorithm and decision stump in the manner first suggested by Kearns and Mansour (40). An option tree (41) (Figure 3) can be viewed as a forest of trees where every node casts a weighted vote. The results reported here use an ADTree stopped at 12 iterations (for clarity).
Figure 3.

An ADTree built over the JMB06 data set. The square nodes in the model hold the name of the feature and order it was learned. The round nodes hold the weighted vote where a positive number predicts DNA binding. Below the square node is the threshold of prediction, if this number is exceeded then the right path is taken, otherwise the left. Below each path in the tree, there is a set of numbers in the format counted/total for the prefixing DNA-binding subgroup.
Classifier evaluation
The goal of classification is to find a function or model that best generalizes the training data. To determine the generalization performance of a classifier, it is necessary to evaluate the trained model over unseen examples from a held-out test set. Given the small size of this data set, n-cross-validation is demonstrably superior to holdout (42). A common choice for n, the number of folds, is 10. Moreover, we perform stratification to maintain the class distribution in each partition. Note, for this experiment every classifier is trained and tested over the same random partitions.
The performance of the classifier cannot be entirely summarized with a single metric. Furthermore, a set of metrics cannot sum up classifier performance in every situation (e.g. different class distributions). Thus, we compare both receiver operating characteristic (ROC) curve and several metrics for each algorithm. Specifically, we report the accuracy  , and Matthews correlation coefficient (MCC)
 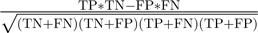 , sensitivity
  , specificity
  , and area under the ROC curve.
RESULTS
This work primarily achieves two goals. First, we demonstrate that our proposed method, which uses physicochemical features derived from sequence, performs comparably with previous structure-based approaches. We also directly demonstrate that the proposed method predicts nucleic acid binding function even when sequence identity falls below 20%, where sequence alignment techniques can no longer recognize homology. Second, we derive a set of rules from a learned model that characterize DNA-binding proteins. We define several measures for rule importance and apply them to select a subset of rules. We subsequently validate these rules using examples from literature.
Performance of proposed method
The first goal of our work is to compare this method directly with a standard sequence alignment method, BLAST (43). This comparison was performed on the same training and test partition for each fold of cross-validation. For this analysis, the class of top hit from the BLAST algorithm was used to predict the label of a test sequence and the negative log of the e-value was the corresponding confidence.
Based on the BLAST results in Table 2, we can group data sets into three categories: hard, medium and easy. Over the hard data sets (JMB03, LEAC35, LEAC25) where BLAST can only achieve ∼70% AUC, our method outperforms BLAST by ∼20%. Over the medium data set (JMB06) where BLAST performs ∼80% AUC, this difference is cut to ∼13%. Over the easy data sets (JMB04, NAR05) where BLAST can already achieve 90% AUC, our method still improves upon BLAST by ∼7%. This analysis provides a fair assessment of the performance with respect to the difficulty of each data set in benchmark. Such a rigorous assessment demonstrates that our method performs consistently over data sets with various levels of difficulty.
Table 2.
Comparison of new protocol with previous work and BLAST
| Accuracy | MCCa | Sensitivity | Specificity | AUCb | |
|---|---|---|---|---|---|
| JMB03 | |||||
| BLAST | 79.3 | 21.5 | 27.8 | 90.4 | 66.0 |
| OURS | 89.1 | 66.2 | 48.1 | 98.0 | 90.3 (91.1)c |
| Stawiski et al. (30) | 92.0 | 74.0 | 81.0 | 94.4 | – |
| Szilagyi and Skolnick (11) | – | 73.0 | – | – | 93.0 |
| JMB04 | |||||
| BLAST | 81.4 | 70.4 | 80.8 | 81.8 | 90.5 |
| OURS | 89.9 | 84.9 | 84.6 | 93.6 | 97.1 |
| Ahmad and Sarai (9) | 83.9 | 68.0d | 80.8 | 87.0 | - |
| Szilagyi and Skolnick (11) | – | 79.0 | – | – | 95.0 |
| NAR05 | |||||
| BLAST | 82.4 | 70.2 | 75.2 | 86.1 | 90.3 |
| OURS | 94.7 | 88.8 | 88.4 | 97.9 | 96.7 |
| Bhardwaj et al. (24) | 86.3 | – | 80.6 | 87.8 | – |
| JMB06 | |||||
| BLAST | 71.8 | 45.1 | 79.7 | 61.8 | 80.1 |
| OURS | 85.9 | 74.8 | 89.9 | 80.9 | 93.4 |
| Szilagyi and Skolnick (11) | – | 74.0 | – | – | 93.0 |
| ABME07 | |||||
| BLAST | 72.7 | 32.5 | 42.7 | 83.2 | 69.0 |
| OURS | 89.6 | 74.3 | 69.3 | 96.7 | 91.3 |
| Langlois et al. (25) | 88.5 | – | 66.7 | 96.3 | 88.7 |
| LEAC35 | |||||
| BLAST | 72.9 | 46.3 | 59.4 | 80.4 | 74.9 |
| OURS | 84.0 | 69.5 | 68.8 | 92.4 | 92.3 |
| LEAC25 | |||||
| BLAST | 69.4 | 28.6 | 42.6 | 82.4 | 67.8 |
| OURS | 84.7 | 66.2 | 64.8 | 94.4 | 91.5 |
aMaximum MCC from ROC curve.
bArea under the ROC curve.
cUsing leave-one-out cross-validation instead of 10-fold.
dMetric calculated from original published data by Szilagyi and Skolnick (11).
The comparison drawn on the last two data sets illustrates the power of the protocol proposed in this work. Specifically, reducing the redundancy by 10% causes BLAST to perform ∼7% worse in terms of AUC; however, the new protocol loses less than a single percentage point. The main advantage of the proposed sequence representation is that it still captures characteristics that define the DNA-binding function from sequence even when there is little sequence similarity in the data.
Along with the comparison to BLAST, we also compare this approach with previous published works. Our goal is to build a classifier that accurately predicts DNA-binding proteins from sequence since protein sequence is often the only available information. To this end, we reconstructed five previous protein sequence data sets with known structures for direct comparison (9,11,24,25,30). We validate our protocol with 10-fold cross-validation. In addition, we constructed two new data sets combining the positive and negative sets from Szilagyi and Skolnick (11) and Stawiski et al. (30), respectively.
Table 2 compares our new method, boosted trees with the LEAC descriptor (OURS), to previous work (9,11,24,25,30) and the BLAST sequence alignment tool. Over all the data sets our method performs competitively with previous work, with the possible exception of JMB03. The JMB03 data set has considerably less DNA-binding examples than any other data set (Table 1). Note that using leave-one-out cross-validation (instead of 10-fold) increases the area under the ROC curve to 91.1 (Table 2). Indeed, since we expect structure-based features to capture more robust characteristics, it is not surprising that our sequence-based method performs worse over this small data set. The comparison over the ABME07 data set is the closest in that both use the same algorithm, boost trees; it demonstrates that the new sequence description performs well irrespective of the algorithm used. The last two data sets, LEAC35 and LEAC25, evince that this new protocol performs well on larger (LEAC35) and more stringent (LEAC25) data sets. In addition, Figure 2 compares our new method with ones proposed by Szilagyi and Skolnick (11) (sequence and structure). It shows that our method does better than their sequence-based technique for more of the graph and performs comparably with their structure-based technique. Moreover, while both method dominate BLAST by a considerable margin over much of the plot, only our method dominates BLAST over the entire graph.
Figure 2.

A ROC comparison of the new sequence-based feature representation and Boosted Trees with the JMB06 structure-based protocol and BLAST.
Knowledge extraction
Extracting useful rules from expressive state-of-the-art classifiers such as boosted trees or SVMs remains an open problem. Nevertheless, simpler classifiers such as decision trees (pruned to a relatively small size) can provide useful rules but generally perform poorly compared with more expressive classifiers. One compromise between performance and interpretability is the ADTree classifier; it has a generalized decision tree model that is built using a boosting-type algorithm. By analyzing the ADTree model, we can gain insights into the relationships between the characteristics that define protein–DNA interactions. First, we will define a set a criteria to judge the relevance of a propensity rule in the context of the model. Second, we will examine individual features and their relationships using this criteria. Third, we will use two groups of DNA-binding proteins, helix-turn-helices and nucleases, to illustrate the biological relevance of this knowledge. Note that the ADTree model achieves 87% AUC with both 10-fold cross-validation and bootstrapping 1000 models over the JMB06 data set.
Measuring rule importance
The ADTree model shown in Figure 3, contains 12 nodes and encodes 15 different rules (paths to a leaf prediction) and was built over the entire data set. Only a subset of these rules are important to and robust in defining the characteristics of a DNA-binding protein. In the following, we investigate rules using three criteria to select relevant rules:
Robustness: How conserved is this rule to perturbations of the data set?
Quality: Does this rule help us understand the class of interest?
Support: How many examples support this rule from the majority class?
First, the robustness of a rule is determined by bootstrapping the model 1000 times and counting the number of times a rule appears in each bootstrapped model. This count is represented on the tree by a color code (Figure 3). Second, the quality of a rule depends on the class of interest and the problem domain. For DNA-binding proteins, we are interested in rules that reflect the protein properties that facilitate binding DNA. The third criterion, support, helps to define the context of a rule in the model. That is, the support measures the number of examples in the majority class that are correctly predicted by the model.
Among the relevant features found using the above criteria: charge, arginine, lysine, leucine and histidine compose nearly all of these features. These features compose elements that are known to be important to DNA binding and suggest that the model largely captures relevant information about the data.
Extracted rules
The ADTree model automatically extracts relevant rules from a training set consisting of only sequence information. Below, we will validate these rules by providing supporting experimental evidence from literature or from the 3D structure of the protein–DNA complex. The proposed method will be able to extract more rules when a larger training set is available. Note that while these rules are presented separately, they have a implicit dependence, which is captured by the weighted voting.
We use the following notations for a single predicate of a rule:
 (more than 10 leucine in an environment with high turn propensity)
LhT (5) (rule number 5)
Both of these notations refer to the same rule. The first notation explicitly lays out the predicate while the second, abbreviated notation uniquely identifies the predicate in the tree. When two predicates such as charge (1) and LhT (5), have a relationship in the tree, they form a rule where each predicate is combined using a conjunction, e.g.  . In each notation, the primary letter corresponds to the single letter for a residue and the second two letters indicate the environment. There are three possible environment codes: H, T, S. If the code is capitalized (e.g. H) this indicates there is a high propensity for the environment, e.g. H means environment with high helix propensity. A lower case letter indicates low propensity and the absence of the letter says nothing about the propensity.
It was noted from the first solved protein–DNA complex that the side chains of surface residues in contact with DNA had a predominately positive charge (44). The role of charge and its distribution throughout the proteins structure has been extensively studied by Ahmad and Sarai (9) and served as an important feature in their classifier; likewise, other groups have included features based on charge in the form of positive surface patches (24,30). While the charge distribution throughout a structure has been found to be an important feature, the overall charge of a sequence (number of positively charged versus negatively charge amino acids) also provides a decent feature (11,24).
This work also finds charge to be an important feature. While the ADTree illustrated in Figure 3 was built over the JMB06 data set, this feature is found to be important regardless of the data set and only the threshold varies slightly. Having a charge greater than 2.6 characterizes 88 of 138 DNA-binding proteins and only 13 of 110 non-DNA-binding proteins. Both the zinc-coordinating and the zipper-type subgroups are completely characterized by a significant number of positively charge residues. At the same time, a majority of hydrolases and transferases tend not to have a significant positive charge; this issue will be addressed later.

Not all DNA-binding proteins have a significant positive charge; rules in other branches as well as subbranches serve to correctly classify these ‘more negatively charged’ proteins. Notwithstanding, the negatively charged residues serve to ligate divalent cations, which catalyze cleavage. For example, a number of restriction enzymes require metal ions (e.g. Mg ) to cleave DNA such as MunI (1D02) (45,46). A number of binding sites have been observed on restriction enzymes leading to a number of proposed mechanisms. Some mechanisms propose that under certain conditions other cation binding sites serve to regulate enzyme activity, e.g. EcoRI (1CL8) (47). It has also been suggested that calcium ions may be required to reduce electrostatic repulsion, e.g. MunI (1D02) (46). In contrast, positively charged nucleases such as EcoRV (1SX5) and I-CreI (1G9Z) have different methods of regulation. In this case, binding affinity is not modulated by the concentration of specific cations. Instead, one proposed mechanism for EcoRV suggests that DNA initially docks near the active site and a conformation change must be triggered before catalysis can begin (48).
One important subrule that serves to correctly classify negatively charged DNA-binding proteins is LhT (5), which captures leucine residues in regions with high loop propensity that make non-specific contacts to DNA, e.g. PvuII endonuclease (3PVI). Looking at the representative structure of the PvuII endonuclease in Figure 4a, 5 of the ten leucines in a turn environment make non-specific contacts with DNA. The turn environment is defined by sequence not structure; thus, some of the leucines fall in sheets near a loop, while others actually fall on loops. Since this feature is learned over negatively charged proteins and nucleases rather than transcription factors tend to be negatively charged, it reflects nucleases rather than (more intuitively) transcription factors known to have a high proportion of leucine such as leucine zippers. Notwithstanding the principle interaction between the hydrophobic leucine and thymine base remains the same (49).
Figure 4.

Several example protein structures bound to DNA. (a) 3PVI illustrating turn leucine residues in contact with DNA. (b) 3PVI illustrating turn histidine residues in contact with DNA. (c) 1ECR illustrating sheet arginine residues in contact with DNA.
Another important rule characterizing DNA-binding proteins is the presence of an arginine found in an environment with high sheet propensity (and low helix propensity). This rule characterizes 15 DNA-binding proteins more than charge, yet at the same time characterizes more than two times the number of non-DNA-binding proteins (Figure 4c). This rule fully characterizes a number of subgroups including other DNA-binding proteins, transferases and zipper type. However, a number of groups are only partially characterized by this feature. For instance, this arginine distinguishes the repair enzyme, T4 endonuclease V (1VAS), from the other positively charged nucleases. This is consistent with the view that arginine is more important for site-specific recognition in direct readout (e.g. Human AAG DNA repair glycosylase, 1EWN), whereas this repair enzyme uses indirect readout to find a lesion on the DNA (50).
The  rule corrects the previous
  for cases where a DNA-binding protein may not have sufficient arginine in a sheet environment but has a sufficient number in a turn environment. Indeed, this rule accounts for ∼20% support of the DNA-binding proteins. This rule seems to correct for DNA-binding proteins that have a portion of arginine in more flexible environments such has HTH or restriction enzyme endonucleases. Similarly, intron homing endonucleases (e.g. I-CreI, 1G9Z or endonuclease I-PpoI, 1A73) have lengthy recognition sequences, which are characterized by arginines on flexible loops (51). This rule seems to better characterize such DNA-binding proteins.
The alanine rule (at the start) has two interpretations: (i) it separates proteins with large flexible regions from other less flexible proteins or (ii) it characterizes smaller proteins as more likely to be DNA-binding (smaller in that they have less alanine since they are smaller). In either case, this rule is not very interesting and will be discussed later. The histidine rule (following the alanine rule) holds more interest in its characterization of specific proteins and subgroups (Figure 4b), such as hydrolases and transferases. In some cases, specific histdines that fall in this environment, such as His85 in PvuII, assist in direct readout (52). It also serves to coordinate metal ions in proteins, such as DNA-binding helix-turn-helix diphtheria toxin repressor (1DDN) (53) and serves in catalysis, e.g. His98 in endonuclease I-PpoI (1A73) (54).
Other Rules
The examples, thus far, cover rules that meet the previous described criteria identifying important rules yet a number of rules fail to meet this criteria. For example, the ADTree model in Figure 3 comprises, atypically, three distinct trees that additively contribute to the entire model. Two of the three trees are rooted with the conserved feature charge and a number of arginine found in an environment that prefers a beta sheet structure. Yet, the third root is feature that checks for a larger number of alanine residues found in an environment that prefers a sheet structure. This feature predicts that proteins bind DNA only if they do not contain this characteristic; moreover less than half of the DNA-binding proteins fall in this category while more than half of the non-binding proteins do not. Thus, this rule is not conserved, has low support and is not interesting; this learned rule may be an artifact of a small data set. In addition, the internal nodes of the ADTree mainly consist of relevant features with the probable exceptions of both the conditional glycine and aspartate found in the rightmost tree. Similar to the conditional alanine feature mentioned earlier, both of these features predict the negative class with their abundance and thus they could be artifacts of the small data set.
DISCUSSION AND CONCLUSION
This work has introduced a new representation of sequence that implicity captures residues of functional importance. Since the function of a protein is determined by several residues in coordination, the local environment of a residue can determine its functional role. One advantage of this technique is that it yields a sparse representation, which permits efficiently learning even with a large number of features (this is similar to the advantage held by the bag-of-words representation in text mining). While our current work considered only secondary structure propensity, this feature representation can be extended to encode any number of properties that can be derived from either sequence or structure.
This work performed a rigorous benchmark comparing this new protocol with previously proposed machine learning methods and BLAST. We found that this method could accurately discriminate DNA-binding proteins even when the sequence identity was low. This performance was comparable with previously proposed methods and significantly better than BLAST. We demonstrate that our current sequence-based method can perform very well, and thus, will give reasonable results when applied to a genome-scale DNA-binding protein prediction.
The knowledge mined from the ADTree algorithm illustrated that many of the rules relate better to binding mechanisms crossing the boundaries of structural classes. Unlike previous work (11), we choose to subdivide the DNA-binding proteins by function then by structure (in the case of transcription factors). Even in this more rigorous subdivision, we find that most of the rules learned work across subgroups rather than specifically for certain subgroups. This is due to the fact that such features capture underlying mechanisms of function rather than function itself. For instance, both certain transcription factors as well as enzymes require ions to bind DNA and thus tend to be negatively charged and require histidine for ion coordination. One interesting feature found to discriminate DNA-binding proteins well in the ADTree model is arginine found in a sheet environment. It is well known that arginine is found in many favorable DNA-binding interfaces; however, it is not quite clear why an arginine in a sheet environment better discriminates DNA-binding proteins.
To assess how a classifier built over a set of known domains scales to a genome-wide analysis, we apply the learned model to a well-characterized genome, Saccharomyces cerevisiae. Since our prediction is on the domain level, we use a data set already parsed into domains by an automatic algorithm (55). The resulting data set has 14 374 domains and our algorithm predicts 21% (3138) to bind DNA and the other 79% (13 203) as non-DNA binding. Except for domains with experimentally derived 3D structures, there is no large data set with experimentally verified DNA-binding annotation on the domain level. However, on the protein level, we found that out of 329 annotated DNA-binding proteins (as annotated by the SwissProt), 263 (or 80%) consist of domains predicted by our method as DNA binding.
Beyond the problem of domain parsing, there are additional problems to constructing a training set from genome-wide data. First, as pointed out previously, most of the labeled data is on the full sequence level rather than the domain level. To build a training set, we would either have to use the full sequences and deal of considerable noise at the feature level or use parsed domains and deal with considerable noise on the class label level. Second, the training set would have to be non-homologous or the resulting classifier will be biased toward overrepresented sequences. The currently available software to handle this problem, can only reduce the redundancy (reliably) to 40% sequence identity and this is not sufficient for our needs. We require at least 25% sequence identity.
In future work, we plan to extend this protocol to large-scale sequence databases. In order to accurately access (and motivate) this protocol, we face the challenge of constructing a properly annotated non-redundant data set. Over such a data set, sequence-based analysis techniques such as BLAST will perform poorly; yet this protocol will yield stable, accurate results. We also plan to apply this method to discriminate other functions; the challenge here will be to create an algorithm that automatically constructs relevant patterns for other functions.
FUNDING
National Institutes of Health P01 AI060915 (to H.L., Partially). National Institute of Health training grant [T32 HL 07692: Cellular Signaling in Cardiovascular System (P.I. John Solaro) to R.E.L.]. Funding for open access charge: University of Illinois at Chicago.
Conflict of interest statement. None declared.
ACKNOWLEDGEMENTS
We would also like to thank Dr Andras Szilagyi for providing the JMB03 data set. We thank the anonymous reviewers for their valuable insights and suggestions.
REFERENCES
- 1.Segal E, Fondufe-Mittendorf Y, Chen L, Thastrom A, Field Y, Moore IK, Wang J-PZ, Widom J. A genomic code for nucleosome positioning. Nature. 2006;442:772–778. doi: 10.1038/nature04979. [DOI] [PMC free article] [PubMed] [Google Scholar]
- 2.Cajone F, Salina M, Benelli-Zazzera A. 4-hydroxynonenal induces a DNA-binding protein similar to the heat-shock factor. Biochem. J. 1989;262:977–979. doi: 10.1042/bj2620977. [DOI] [PMC free article] [PubMed] [Google Scholar]
- 3.Buck MJ, Lieb JD. ChIP-chip: considerations for the design, analysis, and application of genome-wide chromatin immunoprecipitation experiments. Genomics. 2004;83:349–360. doi: 10.1016/j.ygeno.2003.11.004. [DOI] [PubMed] [Google Scholar]
- 4.Freeman K, Gwadz M, Shore D. Molecular and genetic analysis of the toxic effect of RAP1 overexpression in yeast. Genetics. 1995;141:1253–1262. doi: 10.1093/genetics/141.4.1253. [DOI] [PMC free article] [PubMed] [Google Scholar]
- 5.Chou C-C, Lin T-W, Chen C-Y, Wang A.HJ. Crystal structure of the hyperthermophilic archaeal DNA-binding protein Sso10b2 at a resolution of 1.85 angstroms. J. Bacteriol. 2003;185:4066–4073. doi: 10.1128/JB.185.14.4066-4073.2003. [DOI] [PMC free article] [PubMed] [Google Scholar]
- 6.Shanahan HP, Garcia MA, Jones S, Thornton JM. Identifying DNA-binding proteins using structural motifs and the electrostatic potential. Nucleic Acids Res. 2004;32:4732–4741. doi: 10.1093/nar/gkh803. [DOI] [PMC free article] [PubMed] [Google Scholar]
- 7.Pellegrini-Calace M, Thornton JM. Detecting DNA-binding helix-turn-helix structural motifs using sequence and structure information. Nucleic Acids Res. 2005;33:2129–2140. doi: 10.1093/nar/gki349. [DOI] [PMC free article] [PubMed] [Google Scholar]
- 8.Ahmad S, Gromiha MM, Sarai A. Analysis and prediction of DNA-binding proteins and their binding residues based on composition, sequence and structural information. Bioinformatics. 2004;20:477–486. doi: 10.1093/bioinformatics/btg432. [DOI] [PubMed] [Google Scholar]
- 9.Ahmad S, Sarai A. Moment-based prediction of DNA-binding proteins. J. Mol. Biol. 2004;341:65–71. doi: 10.1016/j.jmb.2004.05.058. [DOI] [PubMed] [Google Scholar]
- 10.Nimrod G, Szilagyi A, Leslie C, Ben-Tal N. Identification of DNA-binding proteins using structural, electrostatic and evolutionary features. J. Mol. Biol. 2009;387:1040–1053. doi: 10.1016/j.jmb.2009.02.023. [DOI] [PMC free article] [PubMed] [Google Scholar]
- 11.Szilagyi A, Skolnick J. Efficient prediction of nucleic acid binding function from low-resolution protein structures. J. Mol. Biol. 2006;358:922–933. doi: 10.1016/j.jmb.2006.02.053. [DOI] [PubMed] [Google Scholar]
- 12.Gao M, Skolnick J. From nonspecific DNA-protein encounter complexes to the prediction of dna-protein interactions. PLoS Comput. Biol. 2009;5:e1000341. doi: 10.1371/journal.pcbi.1000341. [DOI] [PMC free article] [PubMed] [Google Scholar]
- 13.Yu X, Cao J, Cai Y, Shi T, Li Y. Predicting rRNA-, RNA-, and DNA-binding proteins from primary structure with support vector machines. J. Theor. Biol. 2006;240:175–184. doi: 10.1016/j.jtbi.2005.09.018. [DOI] [PubMed] [Google Scholar]
- 14.Fujishima K, Komasa M, Kitamura S, Suzuki H, Tomita M, Kanai A. Proteome-wide prediction of novel DNA/RNA-binding proteins using amino acid composition and periodicity in the hyperthermophilic Archaeon Pyrococcus furiosus. DNA Res. 2007;14:91–102. doi: 10.1093/dnares/dsm011. [DOI] [PMC free article] [PubMed] [Google Scholar]
- 15.Cai Y, Lin SL. Support vector machines for predicting rRNA-, RNA-, and DNA-binding proteins from amino acid sequence. Biochim. Biophys. Acta. 2003;1648:127–133. doi: 10.1016/s1570-9639(03)00112-2. [DOI] [PubMed] [Google Scholar]
- 16.Tjong H, Zhou H-X. DISPLAR: an accurate method for predicting DNA-binding sites on protein surfaces. Nucleic Acids Res. 2007;35:1465–1477. doi: 10.1093/nar/gkm008. [DOI] [PMC free article] [PubMed] [Google Scholar]
- 17.Stormo GD. DNA binding sites: representation and discovery. Bioinformatics. 2000;16:16–23. doi: 10.1093/bioinformatics/16.1.16. [DOI] [PubMed] [Google Scholar]
- 18.Stormo GD. Computer methods for analyzing sequence recognition of nucleic acids. Annu. Rev. Biophys. Biophys. Chem. 1988;17:241–263. doi: 10.1146/annurev.bb.17.060188.001325. [DOI] [PubMed] [Google Scholar]
- 19.Workman C, Stormo GD. Ann-spec: a method for discovering transcription factor binding sites with improved specificity. In: Altman RB, Dunker AK, Hunter L, Lauderdale K, Klein T.ED, editors. Pacific Symposium on Biocomputing. Hawaii, Stanford: Oahu; 2000. pp. 467–478. [DOI] [PubMed] [Google Scholar]
- 20.Yan C, Terribilini M, Wu F, Jernigan R, Dobbs D, Honavar V. Predicting DNA-binding sites of proteins from amino acid sequence. BMC Bioinformatics. 2006;7:262–272. doi: 10.1186/1471-2105-7-262. [DOI] [PMC free article] [PubMed] [Google Scholar]
- 21.Bhardwaj N, Langlois RE, Zhao G, Lu H. Structure based prediction of binding residues on DNA-binding proteins. In: IEEE, editor. 27th Annual International Conference on the IEEE EMBS. China, IEEE: Shanghai; 2005. pp. 2611–2614. [DOI] [PubMed] [Google Scholar]
- 22.Kuznetsov IB, Gou Z, Li R, Hwang S. Using evolutionary and structural information to predict DNA-binding sites on DNA-binding proteins. Proteins Struct. Funct. Bioinform. 2006;64:19–27. doi: 10.1002/prot.20977. [DOI] [PubMed] [Google Scholar]
- 23.Bhardwaj N, Lu H. Residue-level prediction of DNA-binding sites and its application on DNA-binding protein predictions. FEBS Lett. 2007;581:1058–1066. doi: 10.1016/j.febslet.2007.01.086. [DOI] [PMC free article] [PubMed] [Google Scholar]
- 24.Bhardwaj N, Langlois RE, Zhao G, Lu H. Kernel-based machine learning protocol for predicting DNA-binding proteins. Nucleic Acids Res. 2005;33:6486–6493. doi: 10.1093/nar/gki949. [DOI] [PMC free article] [PubMed] [Google Scholar]
- 25.Langlois R, Carson M, Bhardwaj N, Lu H. Learning to translate sequence and structure to function: Identifying DNA binding and membrane binding proteins. Ann. Biomed. Eng. 2007;35:1043–1052. doi: 10.1007/s10439-007-9312-z. [DOI] [PMC free article] [PubMed] [Google Scholar]
- 26.Bhardwaj N, Stahelin RV, Langlois RE, Cho W, Lu H. Structural bioinformatics prediction of membrane-binding proteins. J. Mol. Biol. 2006;359:486–495. doi: 10.1016/j.jmb.2006.03.039. [DOI] [PMC free article] [PubMed] [Google Scholar]
- 27.Langlois RE, Lu H. Intelligible machine learning with malibu for bioinformatics and medical informatics. In: IEEE, editor. 30th Annual International Conference on the IEEE EMBS. Vancouver IEEE; 2008. pp. 3795–3798. [DOI] [PubMed] [Google Scholar]
- 28.Luscombe NM, Thornton JM. Protein-DNA interactions: Amino acid conservation and the effects of mutations on binding specificity. J. Mol. Biol. 2002;320:991–1009. doi: 10.1016/s0022-2836(02)00571-5. [DOI] [PubMed] [Google Scholar]
- 29.Berman HM, Olson WK, Beveridge DL, Westbrook J, Gelbin A, Demeny T, Hsieh SH, Srinivasan AR, Schneider B. The nucleic acid database. A comprehensive relational database of three-dimensional structures of nucleic acids. Biophys. J. 1992;63:751–759. doi: 10.1016/S0006-3495(92)81649-1. [DOI] [PMC free article] [PubMed] [Google Scholar]
- 30.Stawiski EW, Gregoret LM, Mandel-Gutfreund Y. Annotating nucleic acid-binding function based on protein structure. J. Mol. Biol. 2003;326:1065–1079. doi: 10.1016/s0022-2836(03)00031-7. [DOI] [PubMed] [Google Scholar]
- 31.Hobohm U, Sander C. Enlarged representative set of protein structures. Protein Sci. 1994;3:522–524. doi: 10.1002/pro.5560030317. [DOI] [PMC free article] [PubMed] [Google Scholar]
- 32.Rost B, Sander C. Improved prediction of protein secondary structure by use of sequence profiles and neural networks. Proc. Natl Acad. Sci. USA. 1993;90:7558–7562. doi: 10.1073/pnas.90.16.7558. [DOI] [PMC free article] [PubMed] [Google Scholar]
- 33.Wang G, Dunbrack R.L., Jr Pisces: a protein sequence culling server. Bioinformatics. 2003;19:1589–1591. doi: 10.1093/bioinformatics/btg224. [DOI] [PubMed] [Google Scholar]
- 34.Prabhakaran M. The distribution of physical, chemical and conformational properties in signal and nascent peptides. Biochem. J. 1990;269:691–696. doi: 10.1042/bj2690691. [DOI] [PMC free article] [PubMed] [Google Scholar]
- 35.Chou PY, Fasman GD. Prediction of the secondary structure of proteins from their amino acid sequence. In: Alton M, editor. Advances in Enzymology and Related Areas of Molecular Biology. Springer; 2006. pp. 45–148. [DOI] [PubMed] [Google Scholar]
- 36.Chou K-C, Cai Y-D. Prediction and classification of protein subcellular location – sequence-order effect and pseudo amino acid composition. J. Cell. Biochem. 2003;90:1250–1260. doi: 10.1002/jcb.10719. [DOI] [PubMed] [Google Scholar]
- 37.Freund Y, Schapire RE. Experiments with a new boosting algorithm. In: Saitta L, editor. International Conference on Machine Learning. Vol. 13. Italy, Morgan Kaufmann: Bari; 1996. pp. 148–156. [Google Scholar]
- 38.Schapire RE, Singer Y. Improved boosting algorithms using confidence-rated predictions. Mach. Learn. 1999;37:297–336. [Google Scholar]
- 39.Friedman J, Hastie T, Tibshirani R. Additive logistic regression: a statistical view of boosting. Ann. Stat. 1998, 2000;28:337–407. [Google Scholar]
- 40.Kearns M, Mansour Y. On the boosting ability of top-down decision tree learning algorithms. J. Comput. Syst. Sci. 1996;58:109–128. [Google Scholar]
- 41.Buntine W. Learning classification trees. Stat. Comput. 1992;2:63–73. [Google Scholar]
- 42.Goutte C. Note on free lunches and cross-validation. Neural Comput. 1997;9:1211–1215. [Google Scholar]
- 43.Altschul S, Madden T, Schaffer A, Zhang J, Zhang Z, Miller W, Lipman D. Gapped BLAST and PSI-BLAST: a new generation of protein database search programs. Nucleic Acids Res. 1997;25:3389–3402. doi: 10.1093/nar/25.17.3389. [DOI] [PMC free article] [PubMed] [Google Scholar]
- 44.Ohlendorf DH, Matthew JB. Electrostatics and flexibility in protein-DNA interactions. Adv. Biophys. 1985;20:137–151. doi: 10.1016/0065-227x(85)90034-6. [DOI] [PubMed] [Google Scholar]
- 45.Vipond IB, Halford SE. Specific DNA recognition by EcoRV restriction endonuclease induced by calcium ions. Biochemistry. 1995;34:1113–1119. doi: 10.1021/bi00004a002. [DOI] [PubMed] [Google Scholar]
- 46.Pingoud A, Jeltsch A. Recognition and cleavage of DNA by type-ii restriction endonucleases. Eur. J. Biochem. 1997;246:1–22. doi: 10.1111/j.1432-1033.1997.t01-6-00001.x. [DOI] [PubMed] [Google Scholar]
- 47.Pingoud V, Wende W, Friedhoff P, Reuter M, Alves J, Jeltsch A, Mones L, Fuxreiter M, Pingoud A. On the divalent metal ion dependence of DNA cleavage by restriction endonucleases of the EcoRI family. J. Mol. Biol. 2009;393:140–160. doi: 10.1016/j.jmb.2009.08.011. [DOI] [PubMed] [Google Scholar]
- 48.Schulze C, Jeltsch A, Franke I, Urbanke C, Pingoud A. Crosslinking the EcoRV restriction endonuclease across the DNA-binding site reveals transient intermediates and conformational changes of the enzyme during DNA binding and catalytic turnover. EMBO J. 1998;17:6757–6766. doi: 10.1093/emboj/17.22.6757. [DOI] [PMC free article] [PubMed] [Google Scholar]
- 49.Chene P. Mutations at position 277 modify the DNA-binding specificity of human p53 in vitro. Biochem. Biophys. Res. Commun. 1999;263:53. doi: 10.1006/bbrc.1999.1294. [DOI] [PubMed] [Google Scholar]
- 50.Vassylyev DG, Kashiwagi T, Mikami Y, Ariyoshi M, Iwai S, Ohtsuka E, Morikawa K. Atomic model of a pyrimidine dimer excision repair enzyme complexed with a DNA substrate: Structural basis for damaged DNA recognition. Cell. 1995;83:773–782. doi: 10.1016/0092-8674(95)90190-6. [DOI] [PubMed] [Google Scholar]
- 51.Edgell DR, Derbyshire V, Roey PV, LaBonne S, Stanger MJ, Li Z, Boyd TM, Shub DA, Belfort M. Intron-encoded homing endonuclease i-tevi also functions as a transcriptional autorepressor. Nat. Struct. Mol. Biol. 2004;11:936–944. doi: 10.1038/nsmb823. [DOI] [PubMed] [Google Scholar]
- 52.Nastri HG, Evans PD, Walker IH, Riggs PD. Catalytic and DNA binding properties of PvuII restriction endonuclease mutants. J. Biol. Chem. 1997;272:25761–25767. doi: 10.1074/jbc.272.41.25761. [DOI] [PubMed] [Google Scholar]
- 53.White A, Ding X, vanderSpek JC, Murphy JR, Ringe D. Structure of the metal-ion-activated diphtheria toxin repressor/ tox operator complex. Nature. 1998;394:502–506. doi: 10.1038/28893. [DOI] [PubMed] [Google Scholar]
- 54.Li C, Hor L, Chang Z, Tsai L, Yang W, Yuan HS. DNA binding and cleavage by the periplasmic nuclease vvn: a novel structure with a known active site. EMBO J. 2003;22:4014–4025. doi: 10.1093/emboj/cdg377. [DOI] [PMC free article] [PubMed] [Google Scholar]
- 55.Malmstrom L, Riffle M, Strauss C.EM, Chivian D, Davis TN, Bonneau R, Baker D. Superfamily assignments for the yeast proteome through integration of structure prediction with the gene ontology. PLoS Biol. 2007;5:e76. doi: 10.1371/journal.pbio.0050076. [DOI] [PMC free article] [PubMed] [Google Scholar]