

Abstract
The dopamine D2 receptor (DRD2) appears to be involved in impulsive behaviors, and particularly in behavioral inhibition. We sought to determine whether inhibition and impulsivity were related to genetic polymorphisms in the DRD2 gene (DRD2) in healthy volunteers (N = 93). Participants received placebo or d-amphetamine in random order. They performed the stop task, measuring behavioral inhibition, and rated their mood states on each session. They also completed the Zuckerman–Kuhlman Personality Questionnaire, including an Impulsivity subscale. We investigated the association between 12 single nucleotide polymorphisms (SNPs) and haplotypes in DRD2 and stop task performance in the nondrug (i.e., placebo) session and on the personality measure of impulsivity. We secondarily evaluated the DRD2 SNPs in relation to response to d-amphetamine on stop task performance and mood ratings. Mood was not related to genotypes in either the drug free condition or in response to drug. However, 2 SNPs, rs4648317 and rs12364283, and a haplotype block consisting of those SNPs, were associated with better performance on the stop task in the drug free condition and lower scores on the Impulsivity subscale. We also found that rs12364283 was associated with effects of d-amphetamine on stop task performance: d-amphetamine decreased stop reaction time (RT) in the A/A group but increased stop RT in the combined A/G + G/G genotype. Of the SNPs we evaluated, rs12364283, which has been associated with DRD2 expression, was the most significantly associated with inhibition and impulsivity. The significant relationship between DRD2 genotype and both behavioral inhibition and impulsivity suggests a possible common genetic influence on behavioral and self-report measures of impulsivity.
Keywords: DRD2, inhibition, impulsivity, amphetamine, Stop Task
Individuals vary in behavioral inhibition, or the predisposition to respond to stimuli without regard to negative consequences. These individual differences have been observed in healthy populations (de Wit, Crean, & Richards, 2000), as well as in psychiatric samples such as patients with attention deficit/hyperactivity disorder and substance use disorders (Colzato, van den Wildenberg, & Hommel, 2007; Schachar, Tannock, & Logan, 1993). One possible source of the observed variability is genetic variation in the neurotransmitter systems responsible for the phenotype. Several lines of evidence suggest that dopamine plays an important role in inhibition in both humans (Friedel, 2004) and nonhumans (Cardinal, Pennicott, Sugathapala, Robbins, & Everitt, 2001; Dulawa, Grandy, Low, Paulus, & Geyer, 1999; Puumala, & Sirvio, 1998; Rubinstein et al., 1997; Winstanley, Theobald, Cardinal, & Robbins, 2004, 2006). Specifically, there is evidence that the dopamine receptor D2 (DRD2) is important for inhibition. Lower expression of DRD2 in patients with Huntington’s disease is associated with poor behavioral inhibition (Cropley, Fujita, Innis, & Nathan, 2006; Lawrence et al., 1998), and imaging studies with healthy participants demonstrate a relationship between DRD2 availability and performance on a measure of behavioral inhibition (Volkow et al., 1998). In addition, rats with lower DRD2 availability perform more poorly on the five-choice serial reaction time (RT) tasks, a measure of behavioral inhibition in animals (Dalley et al., 2007). Functional neuroimaging studies suggest that corticostriatal circuitry—especially the right inferior frontal gyrus and striatum, both rich in DRD2 receptors (Bertolino, Fazio, Caforio, Blasi, & Rampino, 2009)—plays an important role in behavioral inhibition (Aron, Dowson, Sahakian, & Robbins, 2003; Robbins, 2007; Rubia, 2002; Semrud-Clikeman, Steingard, Filipek, Bekken, Biederman, & Renshaw, 2000; Vaidya et al., 1998).
Recently, Zhang et al. (2007) evaluated 23 polymorphisms within DRD2 to determine whether any of them controlled DRD2 expression. Only a previously uncharacterized single nucleotide polymorphism (SNP), rs12364283, was directly associated with DRD2 expression. It is interesting that Taq1A, a polymorphism that has been associated with alcoholism in some (Amadeo, Abbar, Fourcade, Waksman, & Leroux, 1993; Blum, Noble, Sheridan, Finley, & Montgomery, 1991; Comings, Comings, Muhleman, Dietz, Shahbahrami, & Test, 1991; Foley, Loh, Innes, Williams, & Tannenberg, 2004; Hietala, Pohljalainen, Heikkila-Kallio, West, Salaspuro, & Syvalahti, 1997; Higuchi, Muramatsu, Murayama, & Hayashida, 1994; Ishiguro et al., 1998) but not all studies (Dick et al., 2007; Gelernter & Kranzler, 1999; Gelernter et al., 1991; Gelernter et al., 2006), was not found to be associated with DRD2 expression. Several recent studies have identified associations between rs12364283 and phenotypes such as working memory, brain activity, and negative symptoms in schizophrenic patients (Bertolino, Fazio, Caforio, Blasi, & Rampino, 2009) and avoidance-based decisions (Frank & Hutchison, 2009). In this study, we evaluated rs12364283 and 11 other SNPs including: rs4648318 and rs4274224, both of which have been weakly associated with nicotine dependence in European Americans (Huang et al., 2009); rs4648317, which has been associated with nicotine dependence in adolescents (Laucht et al., 2008); rs1079596, which has been associated with performance on the continuous performance test (Kollins et al., 2008); and rs1125394 and rs1799978, which have been associated with therapeutic responses to clozapine (Hwang et al., 2006) and risperidone (Ikeda et al., 2008).
We evaluated performance on a behavioral task as well as a self-report measure of impulsive personality in healthy volunteers. We used the stop task (Logan & Cowan, 1984), a standardized measure of behavioral inhibition. On this task, participants are instructed to respond to a “go” stimulus on most trials, but they are told to withhold their response when a “stop” signal is presented. The time between the stop signal and the go signal is systematically varied to determine the time needed to inhibit a response. More “impulsive” individuals require longer times to inhibit their responses on the stop task, although their go RTs may be normal. We measured impulsivity as a personality trait using the Impulsivity/Sensation Seeking scale on the Zuckerman–Kuhlman Personality Questionnaire (ZKPQ; Zuckerman, Kuhlman, Joireman, Teta, & Kraft, 1993). It is not clear whether the behavioral inhibition task measures the same underlying construct as the self-report questionnaire (Reynolds, Ortengren, Richards, & de Wit, 2006). Some studies have reported positive correlations between self-report measures of impulsivity and stop RTs (Gorlyn, Keilp, Tryon, & Mann, 2005; Logan, Schachar, & Tannock, 1997), whereas others have not (Cheung, Mitsis, & Halperin, 2004; Lijffijt, Bekker, Quik, Bakker, Kenemans, & Verbaten, 2004). Thus, a genotype that is associated with performance on the inhibition task may or may not also be associated with the self-report measure of impulsivity.
In addition to the analysis of stop task performance on the placebo session, while participants were drug free, we also compared the genotypic groups on subjective and behavioral responses to acute doses of d-amphetamine (5, 10, and 20 mg). Several lines of evidence suggest that responses to d-amphetamine might be related to DRD2. For example, DRD2 availability has been associated with subjective responses to stimulants (Volkow et al., 1999): Participants who liked the effect of intravenous methylphenidate, an amphetaminelike drug, had significantly lower DRD2 levels than participants who disliked its effects. Therefore, we also evaluated the effect of DRD2 genotype on both subjective rating and behavioral inhibition after acute d-amphetamine challenge.
Our primary goal was to investigate DRD2 polymorphisms in relation to behavioral inhibition in a drug-free state (i.e., placebo condition) and a self-report measure of impulsivity. Secondarily, we evaluated behavioral inhibition and mood responses to acute doses of d-amphetamine in relation to DRD2 polymorphisms. We hypothesized that measures in both our primary and secondary analyses would depend on the DRD2 genotype.
Method
Participants
Healthy Caucasian male and female volunteers (N = 93), ages 18–35 years were recruited by posters, advertisement, and word-of-mouth referrals. To reduce variability related to tolerance and withdrawal from nicotine or caffeine, we excluded participants who reported smoking more than 10 cigarettes per week or consuming more than three cups of coffee per day. At screening, volunteers underwent a structured clinical psychiatric interview and a physical examination, including electrocardiogram (EKG). They also completed a psychiatric Symptom Checklist (SCL-90; Derogatis, 1983), the Michigan Alcoholism Screening Test (Selzer, 1971), and a health questionnaire with a detailed section on current and lifetime drug use and personality questionnaires including the ZKPQ (Zuckerman et al., 1993). They were excluded if they were taking medication for a current condition, if they had any current Axis I psychiatric disorder including substance dependence (in accordance with the fourth edition of the Diagnostic and Statistical Manual of Mental Disorders [DSM–IV]; American Psychiatric Association, 1994), or any current or past medical condition considered to be a contraindication for d-amphetamine (e.g., abnormal EKG or hypertension). Candidates had to speak English and have at least a high school education. Their body mass index (BMI) had to be in the range between 19 and 26kg/m2. To minimize the influence of hormones, women were tested only during the follicular phase (White, Justice, & de Wit, 2002). Women who were pregnant, lactating, or planning to become pregnant during the study were excluded from participation. The study was approved by The University of Chicago Institutional Review Board.
Design and Procedure
Participants completed four 4-hr sessions in which they received d-amphetamine (5 mg, 10 mg, and 20 mg) or placebo in random order under double-blind conditions. Placebo and d-amphetamine (Mallinkrodt, MO) were placed in size 00 capsules with dextrose filler. Placebo capsules contained dextrose only.
Participants attended an orientation session to familiarize themselves with the procedures of the study, practice the questions, provide informed consent, schedule their study sessions, and provide a 20-ml (2 × 10 ml) blood sample for genotyping. They were instructed to abstain from taking drugs (including alcohol, caffeine, and nicotine) 24 hr before each session and to fast from midnight the night before the sessions. On arrival at the laboratory for each session, urine was tested for recent drug use and pregnancy, and a breath alcohol level was obtained. Participants were tested individually and remained in a comfortably furnished room with TV and reading material for the 4-hr session. They could watch emotionally-neutral movies and read during the sessions when measurements were not being taken, but they were not allowed to study.
The four experimental sessions were conducted from 0900 to 1300 and were separated by at least 48 hr. Precapsule subjective reporting of mood was recorded at 0900. At 0930, participants ingested a capsule containing d-amphetamine (5, 10, or 20 mg) or placebo. For blinding purposes, they were informed that the capsule might contain a stimulant, sedative, or placebo. The stop task was administered by computer, 90 min after capsule administration, which is the expected time of peak d-amphetamine blood concentration. Mood measures were obtained 30, 60, 90, 150, and 180 min after ingestion of the capsule, and several other measures were obtained that are not reported here because of the specific nature of the hypothesis. These included the Digit Symbol Substitution Test (Wechsler, 1958), the Multidimensional Personality Questionnaire (Tellegen, 1982), Deviation From the Mode (de Wit, 2008), Addiction Research Center Inventory (Martin, Sloan, Sapira, & Jasinski, 1971) and the Drug Effects Questionnaire (Johanson & Uhlenhuth, 1980).
At the end of each session, participants also completed an end-of-session questionnaire reporting on their overall experience with the drug they received. After completing all four sessions, participants were debriefed and paid a total of $120.
Dependent Measures
Profile of Mood States (POMS; McNair, Lorr, & Droppleman, 1971)
The POMS consists of 72 adjectives commonly used to describe momentary mood states. Participants rate from 0 (not at all) to 5 (extremely) the extent to which each adjective describes how they feel at that moment. The items on the POMS have been factor analyzed to yield eight mood state scales: Anger, Anxiety, Confusion, Depression, Elation, Fatigue, Friendliness, and Vigor. In addition, the POMS has two intuitively derived scales: Arousal ([Anxiety + Vigor] − [Fatigue + Confusion]) and Positive Mood (Elation − Depression).
Stop task (Logan et al., 1997)
The primary dependent measures on this task are the stop and go times. On each trial, participants are presented with a go signal (symbol on the computer screen) and instructed press a certain key as quickly as possible. The go signal appears at 2-s intervals, and the individual’s RTs (go RTs) are recorded. On 25% of the trials, a tone (stop signal) is sounded after the presentation visual stimulus is presented, and participants are instructed to inhibit (stop) their go response on those trials. The delay from the onset of the go signal to the onset of the stop signal (stop-signal delay) is systematically adjusted in 50-ms increments. If the individual fails to stop, the stop-signal delay is decreased by 50 ms on the following stop-signal trial. If the individual successfully stops, the stop-signal delay is increased by 50 ms on the next trial. Trials continue to vary until the individual is able to inhibit (stop) his or her key press responses on approximately 50% of trials. Stop RT is computed by subtracting the average stop-signal delay at which the individual is able to inhibit the go response 50% of the time from the average go RT. Each administration of the stop task consisted of four blocks of 64 trials (256 total trials). Completion of all 256 trials with brief breaks between the blocks takes approximately 10 min.
At the beginning of each administration of the stop task, the stop delay is set at 200 ms. To ensure that the participants had adjusted their stop-signal delay to the point at which they successfully stopped 50% of the time, we computed the stop RT (and go RT) from the last two blocks of 64 trials. Thus, the procedure provides a measure of the latency in milliseconds to respond to the letter presentation, or the go RT, and the time in milliseconds needed to inhibit a go response, or the stop RT.
The ZKPQ (Zuckerman et al., 1993)
The ZKPQ is a 99-item scale comprising the following subscales: Impulsive/Sensation Seeking (19 items), Neuroticism–Anxiety (19 items), Aggression–Hostility (17 items), Activity (17 items), Sociability (17 items), and Infrequency (10 items). We only evaluated the Impulsive/Sensation Seeking sub-scale of the ZKPQ in this analysis because the primary aim was to examine DRD2 genotype in relation to impulsivity.
Genotyping
Participants were genotyped at 12 SNPs in the DRD2, which were part of the Addiction Array (Hodgkinson et al., 2008), based on the Illumina Golden-Gate platform. Arrays were imaged with an Illumina Bead-station GX500, and the data were analyzed with GenCall v6.2.0.4 and GTS Reports software v5.1.2.0 (Illumina). Criteria for sample exclusion and determining genotyping failure were previously described (Hodgkinson et al., 2008).
Population stratification
We genotyped all study participants for 186 ancestry informative markers (AIMs) that were included on the Addictions Array (Hodgkinson et al., 2008). The 186 AIMs represent a subset of a previously defined set of 204 AIMS (Enoch, Shen, Xu, Hodkinson, & Goldman, 2006). We ran STRUCTURE (Pritchard, Stpehens, & Donnelly, 2000) to identify subpopulations of individuals using these AIMs. All participants’ self-reported Caucasian ancestry was confirmed.
Statistical Analysis
Drug-free state analyses
First, for each SNP, we checked whether genotype correlated (p > .01) with demographic measures including gender, BMI, education in years, age, current and lifetime substance use. We also evaluated whether any of the demographic factors correlated with stop RT or go RT. If they did, we included them as covariates in further analyses. If the minimum allele frequency was <0.1 we combined the rare homozygous genotype with the heterozygous genotype.
We assessed stop and go RTs for differences between genotypic groups without administration of drug (placebo), using a one-way analysis of variance (ANOVA). We repeated the same analysis for the Impulsivity/Sensation Seeking subscale of the ZKPQ. We assessed the significance of each SNP for each phenotype after adjusting for multiple testing (12 SNPs) while accounting for the correlations between SNPs.
We constructed a linkage disequilibrium (LD) map using Haploview software, Version 4.1, from which we defined haplotype blocks. We constructed the blocks using the method of Gabriel et al. (2002) but modified it to include SNPs for which D′ = 1 regardless of lower confidence bound. Haplotypes that were observed fewer than five times were dropped from the analysis. We also checked that LD estimates were similar between our data and those of the HapMap CEU sample (i.e., Utah residents with Northern and Western European ancestry from the CEPH [Centre d’Etude du Polymorphisme Humain] sample). Using PLINK, we tested each haplotype within each block of DRD2 for association with stop RT, go RT, and ZKPQ Impulsivity/Sensation Seeking subscale scores. We empirically assessed statistical significance while accounting for the testing of multiple haplotypes in each block separately using 5,000 permutated datasets.
A standard likelihood ratio test was used to determine whether haplotypes constructed from the haplotype blocks were better able to explain the trait variation then the most associated SNP in the block. First, we regressed the trait value on predictors that count the number of each haplotype possessed by a participant. Individuals with rare haplotypes had the count for that haplotype equally distributed among the other haplotypes. This is akin to the method of Zaykin et al. (Zaykin, Westfall, Young, Karnoub, Wagner, & Ehm, 2002). Next, we regressed the trait value on the allele count of the most significantly associated SNP in the haplotype block. Multiplying two times the log ratio of the haplotype regression likelihood and the SNP regression likelihood produced a statistic that is asymptotically chi-square distributed with degrees of freedom equal to the number of unique haplotypes minus the number of unique genotypes at the SNP.
Response to d-amphetamine analyses
We conducted two-factor repeated measure ANOVAs (or analyses of covariance [ANCOVAs], with dose as a repeated measure) for outcome measures stop RT, go RT, and POMS to compare the effect of individual SNPs on responses to drug (0, 5, 10, 20 mg). Because mood was measured at multiple time points, we calculated the area under the curve relative to baseline (Time 0), for each drug dose. We conducted post hoc analyses to identify the source of genotype–drug interactions.
Results
Genotype Frequencies and Haplotype Construction
Table 1 shows the genotype frequencies for the 12 SNPs included in the study. The frequencies and LD between SNPs were similar to those calculated in the HapMap CEU sample (available in the International HapMap Genome Browser B36). Eleven SNPs had a minor genotype frequency of less than 0.1 (see Table 1). Participants in these groups were combined with the heterozygous group in the analysis. Only one SNP, rs4274224, was analyzed using all three genotype groups. All SNPs were in Hardy–Weinberg equilibrium. D′ values between the 12 polymorphisms are shown in Figure 1. We formed two haplotype blocks: Haplotype Block 1 contained SNPs rs2242592, rs1079596, rs1125394, and rs27471857; and Haplotype Block 2 contained rs4648317, rs4350392, rs1799978, and rs12364283. SNPs rs71003679, rs4648318, rs4274224, and rs4581480 were not part of any haplotype block.
Table 1.
Genotype Frequencies of the DRD2 Polymorphisms
| SNP | Genotype | ||
|---|---|---|---|
| rs2242592a | C/C 5 (5.4) | C/T 40 (43.5) | T/T 47 (51.1) |
| rs1079596 | A/A 6 (6.5) | G/A 25 (26.9) | G/G 62 (66.7) |
| rs1125394 | A/A 62 (66.7) | A/G 25 (26.9) | G/G 6 (6.5) |
| rs2471857 | A/A 6 (6.5) | A/G 25 (26.9) | G/G 62 (66.7) |
| rs7103679 | T/T 3 (3.2) | T/C 27 (29.0) | C/C 63 (67.7) |
| rs4648318 | A/A 60 (64.5) | A/G 30 (32.3) | G/G 3 (3.2) |
| rs4274224 | A/A 29 (31.2) | A/G 49 (52.7) | G/G 15 (16.1) |
| rs4581480 | C/C 1 (1.1) | T/C 16 (17.2) | T/T 76 (81.7) |
| rs4648317 | C/C 71 (76.3) | T/C 19 (20.4) | T/T 3 (3.2) |
| rs4350392 | A/A 3 (3.2) | A/C 21 (22.6) | C/C 69 (74.2) |
| rs1799978 | A/A 82 (88.2) | A/G 11 (11.8) | G/G 0 |
| rs12364283 | A/A 78 (83.9) | A/G 14 (15.1) | G/G 1 (1.1) |
Note. Values are ns (and percentages). SNP = single nucleotide polymorphism.
One participant’s genotype data was missing
Figure 1.
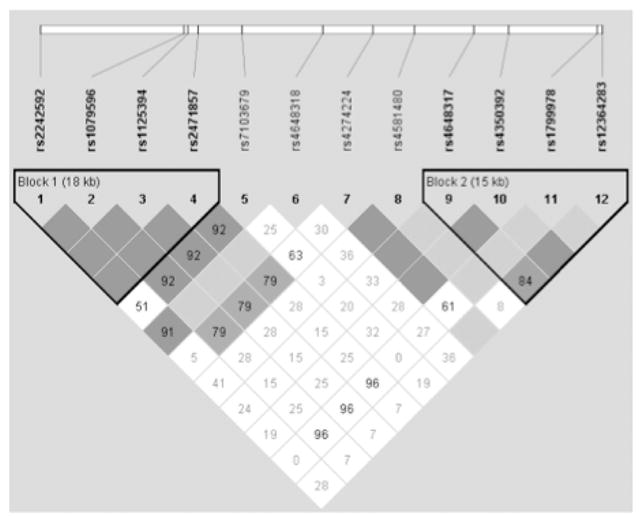
Linkage disequilibrium (LD) plot of the 12 DRD2 loci included in the analysis. LD values represented are D′. The haplotype structure of DRD2 is similar to the haplotypes identified in the HapMap Project.
Demographic Characteristics
The sample included a similar number of men and women (see Table 2 for participant demographics). Participants were mostly in their 20s with either some college or a completed college education. They were moderate caffeine and alcohol drinkers and low cigarette and marijuana users.
Table 2.
Participant Demographic Characteristics and Current and Lifetime Nonmedical Drug Use
| Demographic characteristic | Value |
|---|---|
| n | 93 |
| Mean age in years (±SEM) | 22.3 ± 0.3 |
| Gender (male/female) | 50/43 |
| Mean BMI (±SEM) | 22.5 ± 0.2 |
| No. of years of education | |
| High school | 1 |
| Some college | 39 |
| College degree | 39 |
| Advanced degree | 14 |
| Current substance use | |
| Alcohol (mean number of drinks per week ± SEM) | 4.3 ± 0.4 |
| Tobacco (mean number of cigarettes per week ± SEM) | 0.6 ± 0.1 |
| Marijuana (mean number of times used per month ± SEM) | 0.8 ± 0.2 |
| Caffeine (mean cups per week ± SEM) | 6.0 ± 0.5 |
| Lifetime substance use (% ever used) | |
| Marijuana | 74.2 |
| Stimulants | 32.3 |
| Opiates | 23.7 |
| Hallucinogens | 16.1 |
| Inhalants | 8.6 |
Drug-Free Genotype Differences—Stop Task
Data from 4 participants were dropped because they were extreme outliers on either stop RT or go RT (scores outside of 3 standard deviations). The demographic characteristics of this subsample (n = 89) were similar to those of the overall sample (see Table 2) and did not vary significantly across genotypic groups. In general, stop and go RTs were not related to demographic variables included in the study, although the go RT was positively correlated with caffeine use and negatively with BMI. Therefore, caffeine use and BMI were included as covariates in further analyses with go RT.
Genotypic groups of three SNPs (rs4648317, rs4350392, and rs12364283—all in Haplotype Block 2) had significantly different stop RTs (see Table 3). The remaining SNPs in the analysis were not associated with stop RT. The most significantly associated SNP, rs12364283, had a p value of .005. After correcting for testing all 12 SNPs, the p value remained significant at .035 (see Table 4). None of the DRD2 loci included in this study were associated with go RT.
Table 3.
Summary of Significant Associations Between DRD2 Single Nucleotide Polymorphisms (SNPs) and Measures of Behavioral Inhibition (Stop Task) and Self-Reported Personality Measure of Impulsivity (on the ZKPQ)
| Stop RTa (drug free) |
Impulsivity/Sensation Seeking subscale of the ZKPQ |
|||||||
|---|---|---|---|---|---|---|---|---|
| SNP | Mean ± SEM | p | F | Mean ± SEM | p | F | ||
| rs4648317 | C/C 194.3 ± 5.6 | C/T + T/T 161.8 ± 10.3 | .006 | 7.8 | C/C 9.9 ± 0.5 | C/T + T/T 7.8 ± 0.8 | .045 | 4.2 |
| rs4350392 | C/C 193.7 ± 5.7 | A/C 166.3 ± 10.1 | .018 | 5.8 | C/C 9.9 ± 0.5 | A/C 8.0 ± 0.8 | ns | ns |
| rs12364283 | A/A 192.7 ± 5.3 | A/G + G/G 153.9 ± 13.3 | .005 | 8.2 | A/A 9.8 ± 0.5 | A/G + G/G 7.3 ± 1.1 | .041 | 4.3 |
Note. ZKPQ = Zuckerman–Kuhlman Personality Questionnaire. Higher values represent higher self-reported impulsivity/sensation seeking.
Stop reaction times are given in milliseconds.
Higher values indicate more impulsive responding on the stop task.
Table 4.
Means for Stop Reaction Times (RTs, in Milliseconds) and Zuckerman–Kuhlman Personality Questionnaire Self-Reported Impulsivity/Sensation Seeking Score According to Single Nucleotide Polymorphisms (SNPs) in Block 2: rs4648317, rs4350392, rs179978, and rs12364283 and Haplotypes Formed by Them
| SNP and haplotype | Values |
|||||||
|---|---|---|---|---|---|---|---|---|
| Allele 1 | n | Mean | Allele 2 | n | Mean | p | Adjusted p | |
| Stop RT | ||||||||
| SNP | ||||||||
| rs4648317 | T | 23 | 169.8 | C | 155 | 190.5 | .0065 | .0474* |
| rs4350392 | A | 25 | 165.0 | C | 153 | 190.2 | .0184 | .1294 |
| rs179978 | G | 11 | 178.5 | A | 167 | 187.2 | .5517 | .9972 |
| rs12364283 | G | 15 | 154.9 | A | 163 | 189.6 | .0052 | .0352* |
| Count | Mean | p | Adjusted p | |
|---|---|---|---|---|
| Haplotype | ||||
| TAAA | 10 | 180.2 | .5083 | .8872 |
| TAAG | 13 | 145.8 | .0047 | .0186* |
| CCAA | 142 | 191.1 | .0083 | .0324* |
| CCGA | 11 | 178.5 | .6869 | .9718 |
| Allele 1 | n | Mean | Count | n | Mean | p | Adjusted p | |
|---|---|---|---|---|---|---|---|---|
| Zuckerman–Kuhlman Personality Questionnaire Self-Reported Impulsivity/Sensation Seeking | ||||||||
| SNP | ||||||||
| rs4648317 | T | 23 | 7.2 | C | 149 | 9.8 | .0448 | .2950 |
| rs4350392 | A | 24 | 7.4 | C | 148 | 9.8 | .0715 | .4258 |
| rs179978 | G | 11 | 11.1 | A | 161 | 9.3 | .1448 | .6778 |
| rs12364283 | G | 14 | 7.3 | A | 158 | 9.6 | .0411 | .2758 |
| Count | Mean | p | Adjusted p | |
|---|---|---|---|---|
| Haplotype | ||||
| TAAA | 10 | 7.5 | .1106 | .3220 |
| TAAG | 13 | 6.9 | .0237 | .0760 |
| CCAA | 137 | 9.7 | .1267 | .3610 |
| CCGA | 11 | 11.1 | .1309 | .3654 |
Note. Count is the number of each allele or haplotype observed in all individuals. Mean is the average value among individuals possessing the allele or haplotype specified in the row, calculated as the sum of the values for each individual multiplied by 0, 1, or 2, depending on the number of alleles or haplotypes possessed by the participant, and divided by the total number of alleles or haplotypes observed. p values for SNP tests come from analysis of variance with SNP genotype as a factor. p values for haplotypes were determined with 5,000 permuted datasets. Adjusted p value for SNP tests corrects for testing 12 correlated SNPs with permutation testing. Adjusted p values in the haplotype table may be interpreted similarly, but the correction is for testing four haplotypes.
Statistically significant at the .05 level.
Four haplotypes (TAAG, CCGA, TAAA, and CCAA) constructed from rs4648317, rs4350392, rs1799978, and rs12364283, were assessed for association with stop and go RTs. Haplotype TAAG was associated with faster stop RT (p = .005, indicating lower impulsivity) and remained significant after adjusting for multiple testing (p = .02). Haplotype CCAA was associated with slower stop RT (p = .008) and remained significant after adjusting for multiple testing (p = .03). (See Table 4 for the mean stop RT values for each haplotype.) Haplotypes in Block 1 were not associated with stop RT. None of the haplotypes (in Block 1 or Block 2) were associated with go RT.
We also tested whether using the haplotypes in Block 2 could improve the prediction of stop RT beyond fitting only the most significant single (rs12364283). The likelihood ratio test based on fitting stop RT as a function of rs12364283 genotypes and, separately, as a function of the four haplotypes observed in Block 2 was not significant. Thus, the other SNPs in Block 2 contain little additional information about the relationship between stop RT beyond what rs12364283 explains.
The ZKPQ
This analysis included only 86 participants because the questionnaire was added later in the study. In this subset, genotypic groups of the individual 12 DRD2 loci were similar on the demographic variables included in this study. Of the 12 SNPs, 2 showed nominally significant differences on the Impulsivity/Sensation Seeking subscale of the ZKPQ (rs4648317 and rs12364283—both in Haplotype Block 2; see Table 3). However, the two SNPs did not remain significant after adjusting for multiple testing (see Table 4).
In addition, the haplotype TAAG, which was also associated with the fastest stop RT (indicating lower impulsivity), had the lowest mean impulsivity score (p = .02). After adjusting for testing all four haplotypes, this p value increased to .08 (see Table 4) and, hence, did not remain statistically significant.
Response to d-Amphetamine Analyses
Administration of d-amphetamine produced typical effects on mood, but none of the DRD2 loci included in the study were associated with mood responses to the drug. The drug did not significantly alter stop RT, F(3, 264) = 1.6, p = .18; or go RT, F(3, 264) = 0.23, p = .88. However, the drug did influence stop RT when we stratified on the genotype of SNP rs12364283; for Dose × Genotype, F(3, 258) = 4.0, p = .008 (Figure 2A). None of the remaining SNPs showed a statistically significant differential pattern of response to d-amphetamine. Post hoc comparisons indicated that d-amphetamine decreased stop RT in the A/A group but increased stop RT in the combined A/G + G/G genotype. In comparison with the placebo condition, d-amphetamine decreased stop RT in the 5-mg (p ≤ .05), 10-mg (p ≤.001), and 20-mg (p ≤.05) conditions in the A/A group. However, in the combined A/G + G/G genotype, 10-mg d-amphetamine (p ≤.05) increased stop RT in comparison with the placebo. Administration of other doses of d-amphetamine did not produce results that were different from placebo. Go RTs did not interact with any of the DRD2 loci included in this study. (See Figure 2, Panels A and B, for stop and go RTs by rs12364283.)
Figure 2.

(A) Mean stop reaction time (RT) plus or minus standard error of the mean after placebo (0) and d-amphetamine (5, 10, 20 mg) in participants grouped by DRD2 rs12364283 genotype. In the placebo condition, A/A carriers (n = 75) took longer to inhibit a response in comparison with the combined A/G + G/G group (n = 14; # p ≤.01). In comparison with the placebo condition, administration of 5 (*p ≤.05), 10 (**p ≤.001), and 20 mg (*p ≤.05) of d-amphetamine decreased stop RTs in the A/A group. In the A/G + G/G genotype, 10 mg of d-amphetamine increased stop RTs (*p ≤.05). (B) Mean go RT plus or minus standard error of the mean in participants grouped by DRD2 rs12364283. Go RTs did not differ between the two genotypic groups of rs12364283. # p ≤.01. *p ≤.05. **p ≤.001.
Discussion
The results of this study support the idea that DRD2 is implicated in inhibition and impulsivity. First, individual SNPs rs4648317 and rs12364283, as well as the haplotype block consisting of those SNPs, were associated with better performance on the response inhibition task in a drug-free condition and lower scores on self-reported measurement of impulsivity. Second, analyses of responses to d-amphetamine according to DRD2 showed a significant interaction between the drug and rs12364283 on a response inhibition task, although the groups did not differ in subjective ratings of mood.
rs1236423, which is located in a conserved suppressor region of DRD2, is of particular interest because it was shown by Zhang et al. (2007) to influence the expression of DRD2 in postmortem brain tissues. The minor allele of rs12364283 confers higher transcriptional activity compared with the major allele; a gain-of-function such as this might be expected to have functional consequences even in heterozygotes. The minor G allele enhances expression of DRD2 (Zhang et al., 2007), and imaging studies show that enhanced DRD2 expression is associated with better performance on inhibition tasks (for a review, see Cropley et al., 2006). These data are consistent with our finding that participants with genotypes A/G or G/G performed better on the stop RT in comparison with the A/A group. Analysis of the Block 2 haplotype was no better than rs12364283 alone at accounting for variability in stop RT. These data are consistent with the hypothesis that rs12364283 influences behavior because of its effect on DRD2 gene expression.
Results of previous work assessing the relationship between impulsivity and inhibition provided mixed results. Although some studies found that higher self-reported impulsivity is associated with poor behavioral inhibition (i.e., higher stop RT; Gorlyn et al., 2005; Logan et al., 1997), others have shown no relationship (Cheung et al., 2004; Lijffijt et al., 2004). In our study, we found that the combined genotype T/C + C/C of rs4648317 and the combined genotype A/G + G/G of rs12364283, as well as the haplotype block consisting of these SNPs, were associated with lower self-reported impulsivity/sensation seeking, as well as lower stop RT (i.e., better behavioral inhibition performance). This finding is the first step in understanding the genetic basis of the neurobiological processes of the two phenotypes. However, the results need to be interpreted cautiously and replicated in future studies in light of the fact that self-reported measure of impulsivity/sensation seeking did not remain significant after adjusting for multiple comparisons.
Analyses of our secondary aim evaluating genetic determinants of subjective rating of mood and behavioral responses to d-amphetamine provided interesting results. Contrary to our hypothesis, the drug did not influence mood differentially in the DRD2 genotypic groups. Results of a previous study indicated that DRD2 availability may be associated with subjective responses to stimulants (Volkow et al., 1999). One possible explanation is that our study may have been underpowered to detect this effect. The finding that genotypic groups of rs12364283 showed a differential pattern of response on the stop task after administration of d-amphetamine is consistent with previous studies. Results of work in animals (Eagle, Tufft, Goodchild, & Robbins, 2007) and humans (de Wit et al., 2000; Mattay et al., 2003) have indicated an interesting pattern of response to psycho-stimulants. Eagle et al. (2007) divided rats into slow and fast responders and found that the administration of methyl-phenidate, a drug that is similar to d-amphetamine, reversed stop RTs only in slow-stopping rats, whereas it worsened stop RTs in fast-stopping rats. A similar pattern of response has been observed in humans (de Wit et al., 2000), where administration of d-amphetamine did not significantly change stop RT in the overall sample of participants, but when participants were divided into slow and fast stoppers by the median split, the drug improved stop RT only in participants with an initially long stop RT. With the use of genotype locus, rather than slow or fast RT, to segregate our participants into two groups, our finding that d-amphetamine improved stop RT in the rs12364283 A/A group (with initially longer stop RT) and worsened stop RT in the rs12364283 A/G + G/G group (with initially shorter stop RT) is consistent with the two previous studies.
This study also had limitations. It included a relatively homogenous population of Caucasian college students, and it is not known whether these findings would apply to more heterogeneous populations including participants of different ages or races/ethnicities. We only analyzed behavioral and mood outcome measures in our study: It would be interesting to determine whether these DRD2 variations modulate brain activity corresponding to impulsive behavior, both in a drug-free condition as well as in response to d-amphetamine. One other limitation concerns the interpretation of the interaction between drug and genotype on stop RT. It is possible that the differential effect of amphetamine in the A/G+/G/G and A/A groups was driven by differences in baseline (placebo) stop RTs. In addition, the multiple adjustment procedure for haplotype analyses included only haplotypes in Block 2 and not all haplotypes evaluated in the study.
In summary, we found an association between DRD2 and two impulsivity phenotypes. This experiment was highly controlled and involved a sample of healthy volunteers. The findings add to our understanding of genetic effects on neurobiological mechanisms of inhibition and impulsivity. Our finding that the DRD2 genotype—in particular, the recently discovered promoter SNP rs12364283—influences both behavioral inhibition and self-reported measure of impulsivity demonstrates a common genetic influence on experimentally and interview-based measures of impulsivity.
Acknowledgments
The authors gratefully acknowledge the support of David Goldman and Colin Hodgkinson of the National Institute of Alcoholism and Alcohol Abuse for genotyping the subjects described here. We thank Patricia Kriegel and Margo Meverden for their skillful technical assistance. Ajna Hamidovic was funded by Ruth L. Kirschstein National Research Service Award F32DA024920. This work was supported by Grants RO1DA021336 (AAP) and RO1DA02812 (HdW) from the National Institute on Drug Abuse and MO1RR00055 from the National Center for Research Resources of the National Institutes of Health.
References
- Amadeo S, Abbar M, Fourcade ML, Waksman G, Leroux MG. D2 dopamine receptor gene and alcoholism. Journal of Psychiatric Research. 1993;27:173–179. doi: 10.1016/0022-3956(93)90005-m. [DOI] [PubMed] [Google Scholar]
- American Psychiatric Association. Diagnostic and statistical manual of mental disorders. 4. Washington, DC: Author; 1994. [Google Scholar]
- Aron AR, Dowson JH, Sahakian BJ, Robbins TW. Methylphenidate improves response inhibition in adults with attention-deficit/hyperactivity disorder. Psychiatry. 2003;54:1465–1468. doi: 10.1016/s0006-3223(03)00609-7. [DOI] [PubMed] [Google Scholar]
- Bertolino A, Fazio L, Caforio G, Blasi G, Rampino A. Functional variants of the dopamine receptor D2 gene modulate prefronto-striatal phenotypes in schizophrenia. Brain. 2009;132:417–425. doi: 10.1093/brain/awn248. [DOI] [PMC free article] [PubMed] [Google Scholar]
- Blum K, Noble EP, Sheridan PJ, Finley O, Montgomery A. Association of the A1 allele of the D2 dopamine receptor gene with severe alcoholism. Archives of General Psychiatry. 1991;48:409–416. doi: 10.1016/0741-8329(91)90693-q. [DOI] [PubMed] [Google Scholar]
- Cardinal RN, Pennicott DR, Sugathapala CL, Robbins TW, Everitt BJ. Impulsive choice induced in rats by lesions of the nucleus accumbens core. Science. 2001;292:2499–2501. doi: 10.1126/science.1060818. [DOI] [PubMed] [Google Scholar]
- Cheung AM, Mitsis EM, Halperin JM. The relationship of behavioral inhibition to executive functions in young adults. Journal of Clinical and Experimental Neuropsychology. 2004;26:393–404. doi: 10.1080/13803390490510103. [DOI] [PubMed] [Google Scholar]
- Colzato LS, van den Wildenberg WPM, Hommel B. Impaired inhibitory control in recreational cocaine users. PLoS ONE. 2007;2:e1143. doi: 10.1371/journal.pone.0001143. [DOI] [PMC free article] [PubMed] [Google Scholar]
- Comings DE, Comings BG, Muhleman D, Dietz G, Shahbahrami B, Tast D. The dopamine D2 receptor locus as a modifying gene in neuropsychiatric disorders. JAMA: Journal of the American Medical Association. 1991;266:1793–1800. [PubMed] [Google Scholar]
- Cropley VL, Fujita M, Innis RB, Nathan PJ. Molecular imaging of the dopaminergic system and its association with human cognitive function. Biological Psychiatry. 2006;59:898–907. doi: 10.1016/j.biopsych.2006.03.004. [DOI] [PubMed] [Google Scholar]
- Dalley JW, Fryer TD, Brichard L, Robinson ESJ, Theobald DEH, Laane K, Robbins TW. Nucleus accumbens D2/3 receptors predict trait impulsivity and cocaine reinforcement. Science. 2007;315:1267–1270. doi: 10.1126/science.1137073. [DOI] [PMC free article] [PubMed] [Google Scholar]
- Derogatis L. SCL-90-R: Administration, scoring, and procedures manual II. Towson, MD: Clinical Psychometric Research; 1983. [Google Scholar]
- de Wit H. Impulsivity as a determinant and consequence of drug use: A review of underlying processes. Addiction Biology. 2008;14:22–31. doi: 10.1111/j.1369-1600.2008.00129.x. [DOI] [PMC free article] [PubMed] [Google Scholar]
- de Wit H, Crean J, Richards JB. Effects of d-amphetamine and ethanol on a measure of behavioral inhibition in humans. Behavioral Neuroscience. 2000;114:830–837. doi: 10.1037//0735-7044.114.4.830. [DOI] [PubMed] [Google Scholar]
- Dick DM, Wang JC, Plunkett J, Aliev F, Hinrichs A, Bertelsen S, Goate A. Family-based association analyses of alcohol dependence phenotypes across DRD2 and neighboring gene ANKK1. Alcoholism: Clinical and Experimental Research. 2007;10:1645–1653. doi: 10.1111/j.1530-0277.2007.00470.x. [DOI] [PubMed] [Google Scholar]
- Dulawa SC, Grandy DK, Low MJ, Paulus MP, Geyer MA. Dopamine D4 receptor-knock-out mice exhibit reduced exploration of novel stimuli. Journal of Neuroscience. 1999;19:9550–9556. doi: 10.1523/JNEUROSCI.19-21-09550.1999. [DOI] [PMC free article] [PubMed] [Google Scholar]
- Eagle DM, Tufft MRA, Goodchild HL, Robbins TW. Differential effects of modafinil and methylphenidate on stop-signal reaction time task performance in the rat, and inter-actions with the dopamine receptor antagonist cis-flupenthixol. Psychopharmacology. 2007;192:193–206. doi: 10.1007/s00213-007-0701-7. [DOI] [PubMed] [Google Scholar]
- Enoch MA, Shen PH, Xu K, Hodgkinson C, Goldman D. Using ancestry-informative markers to define populations and detect population stratification. Journal of Psychopharmacology. 2006;20:19–26. doi: 10.1177/1359786806066041. [DOI] [PubMed] [Google Scholar]
- Foley PF, Loh EW, Innes DJ, Williams SM, Tannenberg AEG. Association studies of neurotransmitter gene polymorphisms in alcoholic Caucasians. Annals of the NewYork Academy of Sciences. 2004;1025:39–46. doi: 10.1196/annals.1316.005. [DOI] [PubMed] [Google Scholar]
- Frank MJ, Hutchison K. Genetic contributions to avoidance-based decisions: Striatal D2 receptor polymorphisms. Neuroscience. 2009;164:131–140. doi: 10.1016/j.neuroscience.2009.04.048. [E-pub April 22, 2009, ahead of print] [DOI] [PMC free article] [PubMed] [Google Scholar]
- Friedel RO. Dopamine dysfunction in borderline personality disorder: A hypothesis. Neuropsychopharmacology. 2004;29:1029–1039. doi: 10.1038/sj.npp.1300424. [DOI] [PubMed] [Google Scholar]
- Gabriel SB, Schaffner SF, Nguyen H, Moore JM, Roy J, Blumenstiel B, Altshuler D. The structure of haplotype blocks in the human genome. Science. 2002;296:2225–2229. doi: 10.1126/science.1069424. [DOI] [PubMed] [Google Scholar]
- Gelernter J, Kranzler HR. D2 dopamine receptor gene (DRD2) allele and haplotype frequencies in alcohol dependent and control subjects: No association with phenotype or severity of, phenotype. Neuropsychopharmacology. 1999;20:640–649. doi: 10.1016/S0893-133X(98)00110-9. [DOI] [PubMed] [Google Scholar]
- Gelernter J, O’Malley S, Risch N, Kranzler HR, Krystal J, Merikangas K, Kidd KK. No association between an allele at the D2 dopamine receptor gene (DRD2) and alcoholism. JAMA: Journal of the American Medical Association. 1991;266:1801–1807. [PubMed] [Google Scholar]
- Gelernter J, Yu Y, Weiss R, Brady K, Panhuysen C, Yang BZ, Farrer L. Haplotype spanning TTC12 and ANKK1, flanked by the DRD2 and NCAM1 loci, is strongly associated to nicotine dependence in two distinct American populations. Human Molecular Genetics. 2006;15:3498–3507. doi: 10.1093/hmg/ddl426. [DOI] [PubMed] [Google Scholar]
- Gorlyn M, Keilp JG, Tryon WW, Mann JJ. Performance test correlates of component factors of impulsiveness. Personality and Individual Differences. 2005;38:1549–1559. [Google Scholar]
- Hietala J, Pohjalainen T, Heikkila-Kallio U, West C, Salaspuro M, Syvalahti E. Allelic association between D2 but not D1 dopamine receptor gene and alcoholism in Finland. Psychiatric Genetics. 1997;7:19–25. doi: 10.1097/00041444-199700710-00003. [DOI] [PubMed] [Google Scholar]
- Higuchi S, Muramatsu T, Murayama M, Hayashida M. Association of structural polymorphism of the dopamine D2 receptor gene and alcoholism. Biochemical and Biophysical Research Communications. 1994;204:1199–1205. doi: 10.1006/bbrc.1994.2590. [DOI] [PubMed] [Google Scholar]
- Hodgkinson CA, Yuan QP, Xu K, Shen PH, Heinz E, Lobos EA, Goldman D. Addictions biology: Haplotype-based analysis for 130 candidate genes on a single array. Alcohol and Alcoholism. 2008;43:505–515. doi: 10.1093/alcalc/agn032. [DOI] [PMC free article] [PubMed] [Google Scholar]
- Huang WH, Payne TJ, Ma JZ, Beuten J, Dupont RT, Inohara N, Li MD. Significant association of ANKK1 and detection of a functional polymorphism with nicotine dependence in an African-American sample. Neuropsychopharmacology. 2009;34:319–330. doi: 10.1038/npp.2008.37. [DOI] [PubMed] [Google Scholar]
- Hwang R, Shinkai T, Deluca V, Macciardi F, Potkin S, Meltzer HY, Kennedy JL. Dopamine D2 receptor gene variants and quantitative measures of positive and negative symptom response following clozapine treatment. European Neuropsychopharmacology. 2006;16:248–259. doi: 10.1016/j.euroneuro.2005.09.004. [DOI] [PubMed] [Google Scholar]
- Ikeda M, Yamanouchi Y, Kinoshita Y, Kitajima T, Yoshimura R, Hashimoto S, Iwata N. Variants of dopamine and serotonin candidate genes as predictors of response to risperidone treatment in first-episode schizophrenia. Pharmacogenomics. 2008;9:1437–1443. doi: 10.2217/14622416.9.10.1437. [DOI] [PubMed] [Google Scholar]
- Ishiguro H, Arinami T, Saito T, Akazawa S, Enomoto M, Mitushio H, Shibuya H. Association study between the −141C Ins/Del and TaqI A polymorphisms of the dopamine D2 receptor gene and alcoholism. Alcohol: Clinical and Experimental Research. 1998;22:845–848. [PubMed] [Google Scholar]
- Johanson CE, Uhlenhuth EH. Drug preference and mood in humans: Diazepam. Psychopharmacology. 1980;71:269–273. doi: 10.1007/BF00433061. [DOI] [PubMed] [Google Scholar]
- Kollins SH, Anastopoulos AD, Lachiewicz AM, FitzGerald D, Morrissey-Kane E, Garrett ME, Ashley-Koch AE. SNPs in dopamine D2 receptor gene (DRD2) and norepinephrine transporter gene (NET) are associated with continuous performance task (CPT) phenotypes in ADHD children and their families. American Journal of Medical Genetics Part B: Neuropsychiatric Genetics. 2008;147B:1580–1588. doi: 10.1002/ajmg.b.30876. [DOI] [PMC free article] [PubMed] [Google Scholar]
- Laucht M, Becker K, Frank J, Schmidt MH, Esser G, Treutlein J, Schumann G. Genetic variation in dopamine pathways differentially associated with smoking progression in adolescence. Journal of the American Academy of Child and Adolescent Psychiatry. 2008;47:673–681. doi: 10.1097/CHI.0b013e31816bff77. [DOI] [PubMed] [Google Scholar]
- Lawrence AD, Weeks RA, Brooks DJ, Andrews TC, Watkins LH, Harding AE, Sahakian BJ. The relationship between striatal dopamine receptor binding and cognitive performance in Huntington’s disease. Brain. 1998;121:1343–1355. doi: 10.1093/brain/121.7.1343. [DOI] [PubMed] [Google Scholar]
- Lijffijt M, Bekker EM, Quik EH, Bakker J, Kenemans JL, Verbaten MN. Differences between low and high trait impulsivity are not associated with differences in inhibitory motor control. Journal of Attention Disorders. 2004;8:25–32. doi: 10.1177/108705470400800104. [DOI] [PubMed] [Google Scholar]
- Logan GD, Cowan WB. On the ability to inhibit thought and action—A theory of an act of control. Psychological Review. 1984;91:295–327. doi: 10.1037/a0035230. [DOI] [PubMed] [Google Scholar]
- Logan GD, Schachar RJ, Tannock R. Impulsivity and inhibitory control. Psychological Science. 1997;8:60–64. [Google Scholar]
- Martin WR, Sloan JW, Sapira JD, Jasinski DR. Physiologic, subjective, and behavioral effects of amphetamine, methamphetamine, ephedrine, phenmetrazine, and methylphenidate in man. Clinical Pharmacology and Therapeutics. 1971;12:245–258. doi: 10.1002/cpt1971122part1245. [DOI] [PubMed] [Google Scholar]
- Mattay VS, Goldberg TE, Fera F, Hariri AR, Tessitore A, Egan MF, Weinberger DR. Catechol O-methyltransferase val158-met genotype and individual variation in the brain response to amphetamine. Proceedings of the National Academy of Sciences USA. 2003;100:6186–6191. doi: 10.1073/pnas.0931309100. [DOI] [PMC free article] [PubMed] [Google Scholar]
- McNair D, Lorr M, Droppleman L. Profile of mood states. San Diego, CA: EdITS; 1971. [Google Scholar]
- Pritchard JK, Stephens M, Donnelly P. Inference of population structure using multilocus genotype data. Genetics. 2000;155:945–959. doi: 10.1093/genetics/155.2.945. [DOI] [PMC free article] [PubMed] [Google Scholar]
- Puumala T, Sirvio J. Changes in activities of dopamine and serotonin systems in the frontal cortex underlie poor choice accuracy and impulsivity of rats in an attention task. Neuroscience. 1998;83:489–499. doi: 10.1016/s0306-4522(97)00392-8. [DOI] [PubMed] [Google Scholar]
- Reynolds B, Ortengren A, Richards JB, de Wit H. Dimensions of impulsive behavior: Personality and behavioral measures. Personality and Individual Differences. 2006;40:305–315. [Google Scholar]
- Robbins TW. Shifting and stopping: Fronto-striatal substrates, neurochemical modulation and clinical implications. Philosopical Transactions of the Royal Society B: Biological Sciences. 2007;362:917–932. doi: 10.1098/rstb.2007.2097. [DOI] [PMC free article] [PubMed] [Google Scholar]
- Rubia K. The dynamic approach to neurodevelopmental psychiatric disorders: Use of fMRI combined with neuropsychology to elucidate the dynamics of psychiatric disorders, exemplified in ADHD and schizophrenia. Behavioral Brain Research. 2002;130:47–56. doi: 10.1016/s0166-4328(01)00437-5. [DOI] [PubMed] [Google Scholar]
- Rubinstein M, Phillips TJ, Bunzow JR, Falzone TL, Dziewczapolski G, Zhang G, Grandy DK. Mice lacking dopamine D4 receptors are supersensitive to ethanol, cocaine, and methamphetamine. Cell. 1997;90:991–1001. doi: 10.1016/s0092-8674(00)80365-7. [DOI] [PubMed] [Google Scholar]
- Schachar RJ, Tannock R, Logan G. Inhibitory control, impulsiveness and attention-deficit hyperactivity disorder. Clinical Psychology Review. 1993;13:721–739. [Google Scholar]
- Selzer ML. Michigan Alcoholism Screening Test—Questions for a new diagnostic instrument. American Journal of Psychiatry. 1971;127:1653–1658. doi: 10.1176/ajp.127.12.1653. [DOI] [PubMed] [Google Scholar]
- Semrud-Clikeman M, Steingard RJ, Filipek P, Bekken K, Biederman J, Renshaw PF. Neuroanatomical-neuropsychological correlates of ADHD. Journal of the American Academy of Child and Adolescent Psychiatry. 2000;39:477–484. doi: 10.1097/00004583-200004000-00017. [DOI] [PubMed] [Google Scholar]
- Tellegen A. Multidimensional Personality Questionnaire manual. Minneapolis: University of Minnesota Press; 1982. [Google Scholar]
- Vaidya CJ, Austin G, Kirkorian G, Ridlehuber HW, Desmond JE, Glover GH, Gabrieli JDE. Selective effects of methylphenidate in attention deficit hyperactivity disorder: A functional magnetic resonance study. Proceedings of the National Academy of Sciences USA. 1998;95:14494–14499. doi: 10.1073/pnas.95.24.14494. [DOI] [PMC free article] [PubMed] [Google Scholar]
- Volkow ND, Gur RC, Wang GJ, Fowler JS, Moberg PJ, Ding YS, Logan J. Association between decline in brain dopamine activity with age and cognitive and motor impairment in healthy individuals. American Journal of Psychiatry. 1998;155:344–349. doi: 10.1176/ajp.155.3.344. [DOI] [PubMed] [Google Scholar]
- Volkow ND, Wang GJ, Fowler JS, Logan J, Gatley SJ, Gifford A, Pappas N. Prediction of reinforcing responses to psychostimulants in humans by brain dopamine D-2 receptor levels. American Journal of Psychiatry. 1999;156:1440–1443. doi: 10.1176/ajp.156.9.1440. [DOI] [PubMed] [Google Scholar]
- Wechsler D. The measure and appraisal of adult intelligence. Baltimore: Williams and Wilkins; 1958. [Google Scholar]
- White TL, Justice AJH, de Wit H. Differential subjective effects of D-amphetamine by gender, hormone levels and menstrual cycle phase. Pharmacology Biochemistry and Behavior. 2002;73:729–741. doi: 10.1016/s0091-3057(02)00818-3. [DOI] [PubMed] [Google Scholar]
- Winstanley CA, Theobald DEH, Cardinal RN, Robbins TW. Contrasting roles of basolateral amygdala and orbitofrontal cortex in impulsive choice. Journal of Neuroscience. 2004;24:4718–4722. doi: 10.1523/JNEUROSCI.5606-03.2004. [DOI] [PMC free article] [PubMed] [Google Scholar]
- Winstanley CA, Theobald DEH, Dalley JW, Cardinal RN, Robbins TW. Double dissociation between serotonergic and dopaminergic modulation of medial prefrontal and orbitofrontal cortex during a test of impulsive choice. Cerebral Cortex. 2006;16:106–114. doi: 10.1093/cercor/bhi088. [DOI] [PubMed] [Google Scholar]
- Zaykin D, Westfall P, Young S, Karnoub M, Wagner M, Ehm M. Testing association of statistically inferred haplotypes with discrete and continuous traits in samples of unrelated individuals. Human Heredity. 2002;53:79–91. doi: 10.1159/000057986. [DOI] [PubMed] [Google Scholar]
- Zhang Y, Bertolino A, Fazio L, Blasi G, Rampino A, Romano R, Sadée W. Polymorphisms in human dopamine D2 receptor gene affect gene expression, splicing, and neuronal activity during working memory. Proceedings of the National Academy of Sciences USA. 2007;104:20552–20557. doi: 10.1073/pnas.0707106104. [DOI] [PMC free article] [PubMed] [Google Scholar]
- Zuckerman M, Kuhlman M, Joireman J, Teta P, Kraft M. A comparison of three structural models of personality: The big three, the big five, and the alternative five. Journal of Personality and Social Psychology. 1993;65:757–768. [Google Scholar]