Abstract
Conventional stereo displays produce images in which focus cues – blur and accommodation – are inconsistent with the simulated depth. We have developed new display techniques that allow the presentation of nearly correct focus. Using these techniques, we find that stereo vision is faster and more accurate when focus cues are mostly consistent with simulated depth; furthermore, viewers experience less fatigue when focus cues are correct or nearly correct.
VIEWING THE REAL WORLD stimulates many depth cues, all specifying the same 3-D layout. With modern graphics and display technology, most of these cues can be presented with high fidelity. But conventional displays always present the images on one surface [e.g., the phosphor grid for cathoderay displays (CRTs) or the focal plane associated with head-mounted displays (HMDs)]. Consequently, images presented on computer displays stimulate some cues that specify the depth intended by the graphics engineer (simulated depth cues) and others that specify properties of the display itself, such as its distance and the shape of its surface (screen cues). Screen cues include motion parallax due to the viewer's head movements relative to the screen and visible pixelization due to the discrete nature of the screen. Here, however, we consider only one class of screen cues: focus cues. Focus cues come in two forms.
Blur gradient in the retinal image
For real scenes, retinal blur varies consistently with changes in scene depth: the retinal image is sharpest for objects at the distance to which the eye is focused and blurred for objects at other distances. In conventional computer displays, focal distance is constant, so the scene appears sharp if the eye is focused on the display surface, and blurred if it is focused elsewhere. Consequently, the blur produced by viewing a conventional stereo display specifies flatness.
Accommodation
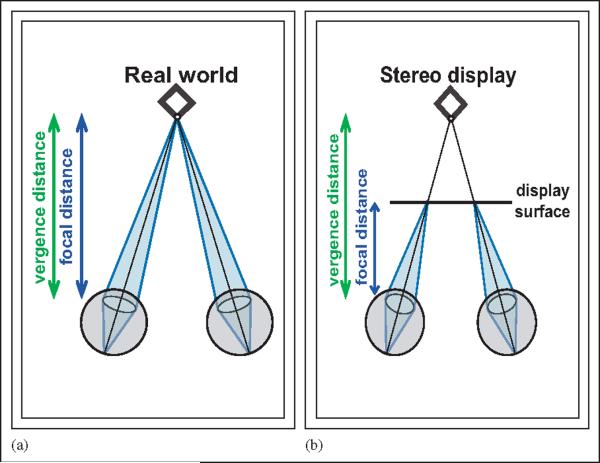
When viewing real scenes, the viewer accommodates (i.e., changes the focal power of the lens in the eye) to minimize blur for the fixated part of the scene (the part of the scene to which the eyes are pointed, as opposed to objects in the visual periphery). As the eye looks around the simulated scene in a stereo display, the focal distance of the light does not vary, so accommodation signals flatness and a specific depth (Fig. 1).
Fig. 1.
Vergence and focal distances with real stimuli and stimuli presented on conventional stereo displays. (a) Viewing an object in the real world. Vergence distance is the distance where the fixation axes of the two eyes converge. Focal distance is the distance to which the two eyes are focused. In the real world, vergence and focal distance are typically the same. (b) The same object viewed on a conventional stereo display. The display surface is nearer than the simulated object, so focal distance is shorter than vergence distance. Because focal distance is constant, vergence and focus distances match only for simulated objects at the focal distance.
Stereo displays present images separately to the two eyes. Objects within the images are displaced horizontally to create binocular disparity, which in turn creates the stimulus to vergence (the angle between the lines of sight when the two eyes fixate the same point in space). The binocular disparity creates a compelling 3-D sensation because it recreates the differences in the two eyes' images that occur in viewing real 3-D scenes. While the disparity signals are important, the incorrect focus cues in stereo displays are likely to cause perceptual distortions, viewer fatigue, and difficulty in achieving binocular fusion; they have also proven difficult to eliminate from conventional displays.1 Here, we summarize some of the work in Hoffman, Girshick, Akeley, and Banks (2008)2 on the influence of focus cues on depth perception and viewer fatigue during viewing of stereo displays.
For a stimulus to be sharply focused on the retina, the eye must be accommodated to a distance close to the object's focal distance. The acceptable range is the depth of focus, which is roughly ±0.3 diopters (D; diopters are viewing distance in inverse meters). For a stimulus to be seen as single (fused) rather than double, the eyes must be converged to a distance close to the object distance. Vergence errors must be less than Panum's fusion area (±15–30 arcmin, the maximum disparity for which the visual system can fuse the two eyes' images and thereby produce a single perceived image). Accommodation and vergence responses are normally coupled: accommodative changes evoke vergence changes (accommodative vergence), and vergence changes evoke accommodative changes (vergence accommodation).
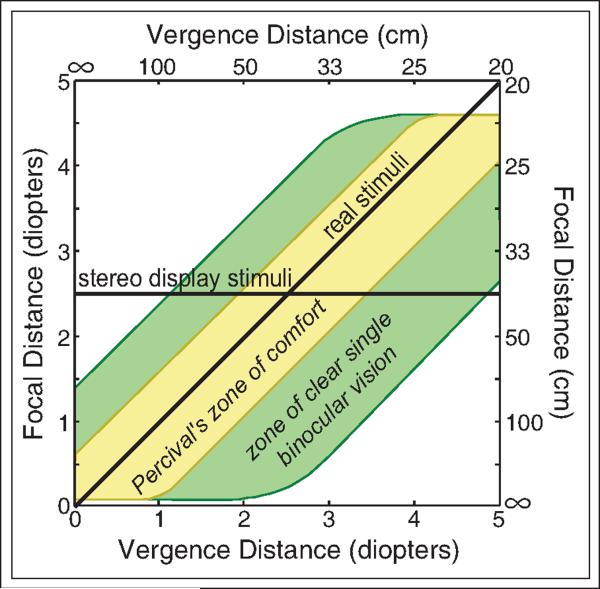
In the real world, accommodation-vergence coupling is helpful because focal and vergence distances are almost always the same no matter where the viewer looks (diagonal line in Fig. 2). The zone of clear single binocular vision (green region in Fig. 2) is the set of vergence and focal distances for which a typical viewer can see a sharply focused single image; i.e., it is the set of those distances for which vergence and accommodation can be adjusted sufficiently well. Percival's zone of comfort (yellow region) is an optometric rule of thumb for the viewing of stereo stimuli; it is the approximate range of vergence and accommodation responses for which the viewer can fuse images without discomfort. As shown in Fig. 2, vergence and focal distance must be close to one another to support clear, single vision without undue effort.
Fig. 2.
The range of vergence and accommodation responses possible and comfortable for a typical adult. The zone of clear single binocular vision and Percival's zone of comfort are represented by the green and yellow regions, respectively. The diagonal line represents most stimuli in the real world. The horizontal line represents stimuli in a conventional stereo display.
In conventional stereo displays, the normal correlation between vergence and focal distance is disrupted (horizontal line in Fig. 2): focal distance is now fixed at the display while vergence distance varies depending on the part of the simulated scene the viewer fixates. In natural viewing, focal distance would nearly always be identical to vergence distance (diagonal line). Given the conflict created in conventional displays, we expect that the ability to fuse a binocular stimulus will be reduced relative to the ability with real-world stimuli.
Prolonged use of conventional stereo displays is known to produce viewer fatigue and discomfort; it has often been claimed that these symptoms are caused by the required dissociation between vergence and accommodation, but this has never been proven. Because stereo displays are being used in more and more applications, particularly medicine, it is important to determine if the dissociation really causes fatigue and discomfort. If we can find evidence that it does, it will help guide solutions to the problem.
There have been many efforts to construct displays that provide correct focus cues.3 We developed a display (described in detail by Akeley et al.1 and Hoffman et al.2) that provides nearly correct focus cues while using off-the-shelf graphics hardware and preserving view-dependent lighting effects such as occlusions, highlights, and reflections. The display is shown schematically in Fig. 3(a). Each eye views a light field created by optically summing three image planes with a mirror and two plate beamsplitters. This creates a volumetric stereoscopic display because the light for each eye comes from sources at different distances. We fix the viewer's position in front of the display, so that we can calculate each eye's view and display the correct disparities and viewpoint-specific lighting effects. We render all the images as sharp and allow the eye's optics to create the appropriate blur for each distance to which the eye accommodates. This eliminates the need to track fixation and accommodation. When we render points that fall between image planes, we use depth-weighted blending, a weighted sum of the two adjacent image planes along a line of sight. Depth-weighted blending simulates the focus cues that are appropriate for between-image-plane positions and thereby eliminates discontinuities in blur.
Fig. 3.
Fixed-viewpoint volumetric display. (a) Schematic of viewports in the display and optical paths to the eyes; the left side is a view from the top and the right side is a view from the right. (b) A viewer using the display. The head position is fixed with a bite bar. (c) Schematic of image-plane spacing.
We are interested in knowing how viewers perceive the images presented in various types of displays. Understanding this starts with the formation of the retinal images. The properties of those images are determined by the graphics rendering, the display of the rendering, and by the optics of the viewer's eyes. Human optics is linear and largely homogeneous, so we can use linear systems analysis to characterize retinal-image formation. We calculate the retinal images formed by luminance sine-wave gratings (patterns of light and dark stripes) presented on a given display. Specifically, we calculate the ratio of contrast in the retinal image divided by the contrast of the image presented on the display. It was important in these calculations to use the actual optics of human eyes because normal optical aberrations make the depth of focus larger than it is for idealized (i.e., diffraction limited) optics.
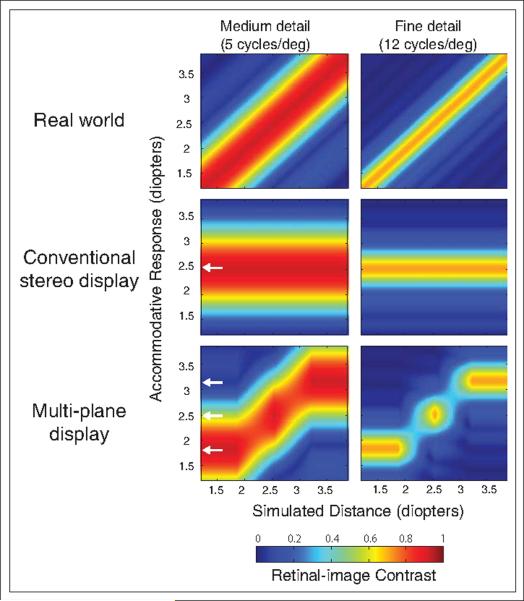
The retinal images formed by viewing real-world stimuli, stimuli on conventional stereo displays, and stimuli in our multi-plane volumetric display are similar in some situations and quite different in others. The upper, middle, and lower rows of Fig. 4 show retinal-image contrasts for sinusoidal gratings presented in the real world, on a conventional display, and in our volumetric display. The left and right columns show those contrasts for spatial frequencies of 5 and 12 cycles/deg, respectively (the latter corresponds to fine detail and the former to less fine detail; a typical computer display viewed from 50 cm can display a maximum detail of ~18 cycles/deg). The x-axes represent the real or simulated focal distance of the stimulus. The y-axes represent the eye's focal distance, which is the distance to which the eye is focused. Colors represent the retinal-image contrast if the stimulus contrast is 1, red representing the highest contrast and blue the lowest. The optics in the modeling is those of author DMH's left eye. Austin Roorda (UC Berkeley) measured the optics and assisted with the modeling.
Fig. 4.
Retinal-image contrasts for different display techniques. In each panel, simulated distance (in diopters) is plotted as a function of the distance to which the eye accommodates (in diopters). Retinal-image contrast for an object of contrast 1 is indicated by the colors. The white arrows in the middle and bottom rows represent the distances to the image planes.
Consider a real stimulus at a distance of 2.5 diopters (D) at a spatial frequency of 5 cycles/deg (upper left panel in Fig. 4). As one would expect, focusing the eye at the actual object distance of 2.5D yields maximum retinal contrast. At a frequency of 12 cycles/deg (upper right panel), retinal-image contrast is reduced even when the eye is accurately focused and small errors in accommodation have a pronounced effect. The plots in the top row represent the normal relationship between object distance, accommodative response, and retinal-image contrast.
Next, consider a conventional display (middle row in Fig. 4). The distance to the display surface is fixed at 40 cm (2.5D), so retinal contrast is now maximized by accommodating to the distance of the display rather than to the simulated distance. To maintain a clear percept, the observer must hold accommodation fixed despite changes in simulated distance, and this requires the dissociation of accommodation and vergence.
Now consider our multi-plane volumetric display (bottom row). The three image planes are separated by 0.67D, so the workspace is a 1.33D volume. When the simulated distance is at the distance of an image plane, the retinal contrast produced by viewing our display is identical to the contrast produced by viewing a stimulus in the real world. When the simulated distance is between planes, the stimulus is formed by a depth-weighted blend of intensities from the two nearest planes. The retinal image created by blending is nearly identical to that produced by a real object at low spatial frequencies and a reasonable approximation at medium spatial frequencies. Importantly, retinal-image contrast is maximized by focusing at the simulated distance rather than at one of the image planes. At high frequencies, the blended image is a poorer approximation to the real world: the peak contrast occurs by accommodating to a distance near the image planes rather than at the simulated distance. Despite the relatively poor approximation at high spatial frequencies, the stimuli created in the multi-plane volumetric display appear quite realistic even for objects between image planes because low and mid spatial frequencies, where our approximation is good, are the most important for blur detection and control of accommodation.
We used the multi-plane volumetric display to examine the influence of appropriate and inappropriate focus cues on perception and fatigue. Vergence and accommodative distances differ in conventional stereo displays, but the differences are generally smaller than the spread of the zone of clear single binocular vision and also frequently smaller than Percival's zone of comfort. Nonetheless, many viewers find it difficult to fuse stimuli in stereo displays. We measured how focus cues affect the time needed to fuse a random-dot stereogram for different amounts of conflict between vergence and focal distance. The stimulus was a periodic corrugation in depth (like a corrugated tin sheet) in one of two orientations.
When properly fused and viewed binocularly, it was easy for the viewer to perceive the orientation correctly. But when it was viewed with one eye, or was not properly fused, it looked like noisy dots with no clear pattern in depth and the orientation could not be determined. The results are shown in Fig. 5; all three subjects could fuse the stereo-gram (and thereby identify the corrugation orientation) at shorter durations when the vergence-focal conflict was small or zero. In the far-vergence condition (blue), the vergence stimulus appeared at a far distance (1.87D) and the focal distance was 1.87D (no conflict), 2.54D (medium conflict), or 3.21D (large conflict). In the near-vergence condition (red), the vergence stimulus appeared at 3.21D and the focal distance was 1.87D (large conflict), 2.54D (medium conflict), or 3.21D (no conflict). Thus, presenting focus cues that were appropriate or nearly appropriate for the depth in the stimulus led to consistently better perceptual performance.
Fig. 5.
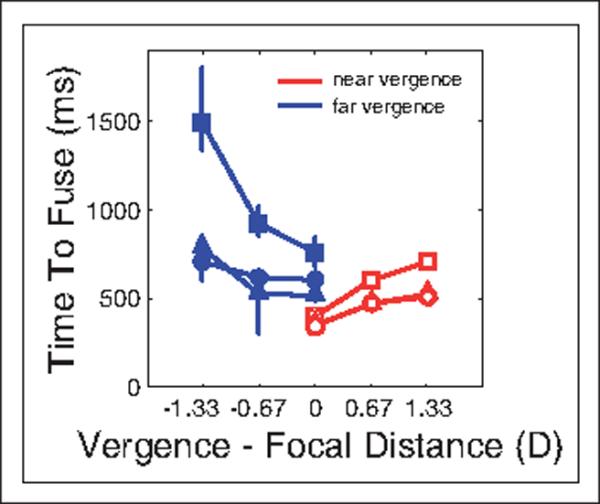
Results of time-to-fusion experiment. Stimulus duration required to fuse and thereby perceive a corrugation in depth is plotted as a function of the difference between the vergence and focal distances in diopters. Red represents conditions in which the eyes had to converge (the eye movement required for viewing a near target) and blue represents conditions in which the eye had to diverge. Different symbol shapes are the data from different subjects. Error bars are 95% confidence intervals.
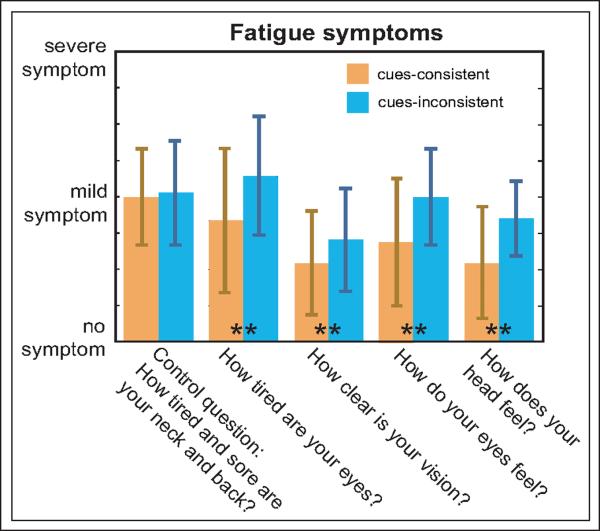
We also examined whether the conflict between vergence and accommodation required in conventional stereo displays is the cause of visual fatigue and discomfort. The vergence-focal conflict in such displays is generally smaller than the zone of single clear binocular vision and Percival's zone of comfort (Fig. 2), so it is not a foregone conclusion that the conflict causes fatigue and discomfort. To examine this, we had 11 subjects fixate stereograms at various simulated distances in two sessions lasting 45 minutes each. In one session, vergence distance was randomized while focal distance was constant; this is the cues-inconsistent condition and is similar to the viewing conditions in conventional stereo displays. In the other session, we took advantage of the properties of the multi-plane display: vergence and focal distance were always the same, and they changed randomly from trial to trial; this is the cues-consistent condition. The two sessions were otherwise identical. Subjects answered questionnaires after each session. The results are shown in Fig. 6. Subjects reported significantly worse symptoms after the cues-inconsistent session. They also preferred the cues-consistent session over the cues-inconsistent one. This study offers the most compelling evidence to date that the visual fatigue associated with viewing stereo displays can be attributed to the unnatural relationship between vergence and focal distance.2
Fig. 6.
Results from the visual-fatigue experiment. The average symptom severity is plotted for each of the five questions. Orange and blue bars represent the data from the cues-consistent and cues-inconsistent sessions, respectively. Error bars are the standard deviation of reported symptoms from the 17 sets of observations (11 subjects, 6 tested twice). ** indicates p<0.025.
Conclusions
Conventional stereo displays create conflicts among various signals the visual system relies on to estimate 3-D layout in natural scenes. Many of these signals, e.g., binocular disparity, shading, and perspective, can be presented with high fidelity in modern displays, but some – particularly focus cues – cannot. The incompatibility between signals that are consistent with the simulated scene and focus cues that are consistent with the distance to the display surface may cause distortions in depth perception,4 difficulties in fusing binocular stimuli, and viewer fatigue and discomfort. We developed a multi-plane volumetric display that allows us to present nearly correct focus cues for a variety of simulated viewing situations. Using the display, we showed that rendering nearly correct focus cues improves the ability to fuse binocular stimuli, increases the ability to perceive small variations in disparity, and reduces viewer fatigue and discomfort. As stereo displays become more widely used, it will become increasingly important to understand and minimize adverse consequences of inappropriate focus cues. On-going research in display technology is aimed at developing techniques for displaying all signals, including focus cues, with high fidelity so that the viewer can experience the intended depth percepts without undue fatigue or discomfort.
References
- 1.Akeley K, Watt SJ, Girshick AR, Banks MS. A stereo display prototype with multiple focal distances. ACM Transactions on Graphics. 2004;23(3):804–813. [Google Scholar]
- 2.Hoffman DM, Girshick AR, Akeley K, Banks MS. Vergence–accommodation conflicts hinder visual performance and cause visual fatigue. Journal of Vision. 2008;8(3):1–30. doi: 10.1167/8.3.33. [DOI] [PMC free article] [PubMed] [Google Scholar]
- 3.Schowengerdt BT, Seibel EJ. True 3-D scanned voxel displays using single or multiple sources. J Soc Info Display. 2006;14(6):135–143. [Google Scholar]
- 4.Watt SJ, Akeley K, Ernst MO, Banks MS. Focus cues affect perceived depth. Journal of Vision. 2005;5(10):834–862. doi: 10.1167/5.10.7. [DOI] [PMC free article] [PubMed] [Google Scholar]


