

Abstract
Ovarian cancer, the second most common gynecological malignancy, accounts for 3% of all cancers among women in the United States, and has a high mortality rate, largely because existing therapies for widespread disease are rarely curative. Ovarian endometrioid adenocarcinoma (OEA) accounts for about 20% of the overall incidence of all ovarian cancer. We have used proteomics profiling to characterize low stage (FIGO stage 1 or 2) versus high stage (FIGO stage 3 or 4) human OEAs. In general, the low stage tumors lacked p53 mutations and had frequent CTNNB1, PTEN, and/or PIK3CA mutations. The high stage tumors had mutant p53, were usually high grade, and lacked mutations predicted to deregulate Wnt/β-catenin and PI3K/Pten/Akt signaling. We utilized 2-D liquid-based separation/mass mapping techniques to elucidate molecular weight and pI measurements of the differentially expressed intact proteins. We generated 2-D protein mass maps to facilitate the analysis of protein expression between both the low stage and high stage tumors. These mass maps (over a pI range of 5.6–4.6) revealed that the low stage OEAs demonstrated protein over-expression at the lower pI ranges (pI 4.8–4.6) in comparison to the high stage tumors, which demonstrated protein over-expression in the higher pI ranges (pI 5.4–5.2). These data suggest that both low and high stage OEAs have characteristic pI signatures of abundant protein expression probably reflecting, at least in part, the different signaling pathway defects that characterize each group. In this study, the low stage OEAs were distinguishable from high stage tumors based upon the proteomic profiles. Interestingly, when only high-grade (grade 2 or 3) OEAs were included in the analysis, the tumors still tended to cluster according to stage, suggesting that the altered protein expression was not solely dependent upon tumor cell differentiation. Further, these protein profiles clearly distinguish OEA from other types of ovarian cancer at the protein level.
Keywords: Endometrioid ovarian cancer, Liquid-based protein separation, Mass mapping
1 Introduction
Ovarian cancer, the second most common gynecological malignancy, accounts for 3% of all cancers among women in the United States [1]. Five-year survival rates can be as high as 94% with early detection of the malignancy. However, as ovarian cancer is insidious in onset, less than 20% of ovarian tumors present at early stages of tumor development. The 5-year survival of women with advanced stage ovarian cancer is approximately 28%, largely because existing therapies for widespread disease are rarely curative [1].
Approximately 90% of ovarian cancers are thought to arise from the ovarian surface epithelium or from surface epithelial inclusion glands and/or cysts. Epithelial ovarian cancers (carcinomas) occur as several distinct morphological subtypes, including serous, endometrioid, clear cell, and mucinous tumors, based on their appearance under the light microscope. Combined, serous and endometrioid carcinomas account for ~75–80% of all ovarian cancer. Substantial evidence suggests that the different morphological subtypes of ovarian carcinoma likely represent biologically and genetically distinct disease entities [2]. For example, about 85% of mucinous ovarian adenocarcinomas harbor K-RAS gene mutations, while K-RAS mutations are much less frequently observed in clear cell, endometrioid, and typical (high grade) serous carcinomas [3–5]. Likewise, mutations of the CTNNB1 gene (encoding β-catenin) are observed in 16–38% of ovarian endometrioid adenocarcinomas (OEAs), but are uncommon in the other types of ovarian carcinomas [6–11]. As in other cancers, the genes mutated in ovarian cancer typically encode proteins that function in conserved signaling pathways [12].
Recent investigations of ovarian endometrioid cancers have provided insights into the signaling pathways dysregulated during ovarian cancer pathogenesis. For example, the canonical Wnt signaling pathway is frequently deregulated in OEAs, and usually occurs as a consequence of activating mutations in the gene (CTNNB1) that encodes β-catenin [7, 9, 13–15]. Similarly, mutations predicted to deregulate the PI3K/Pten/Akt signaling pathway, such as inactivating mutations of the PTEN or activating mutations of the PI3K catalytic subunit, PIK3CA, are also frequently observed in OEAs [16–18]. More recently, Wu et al. [19] have demonstrated that OEAs with defects in Wnt/β-catenin and/or PI3K/Pten/Akt signaling are usually low grade, low stage tumors, whereas high grade, high stage (stages 3/4) OEAs typically harbor p53 mutations and lack Wnt/β-catenin and PI3K/Pten/Akt signaling pathway defects.
Though comprehensive studies of tumor RNA and DNA have provided a number of insights into ovarian cancer pathogenesis, proteins are the major effector molecules in tumor cells. Protein levels may be discordant with corresponding transcript levels, and PTMs can have biologically critical effects on protein function. To date, a number of proteomics-based studies have been conducted on ovarian tumors or on sera from patients with ovarian tumors using several methods, including 2-D PAGE [20, 21], surface enhanced laser desorption ionization (SELDI) [22], and 2-D liquid-based separation methodologies [23, 24]. The latter methodology not only has greater reproducibility, but also has the ability to identify and quantify proteins, and the capability to compare results amongst different sets of experiments and samples [25]. Cancer-specific protein expression patterns in specific histologic subtypes of ovarian carcinomas have not been defined.
In this study, we compared protein expression profiles for the low stage (FIGO stage 1 or 2) and high stage (FIGO stage 3 or 4) OEAs. In general, the low stage tumors lacked p53 mutations and had frequent CTNNB1, PTEN, and/or PIK3CA mutations, while the high stage tumors were high grade, had mutant p53 and lacked mutations predicted to deregulate Wnt/β-catenin and PI3K/Pten/Akt signaling. We employed 2-D liquid-based separation coupled with ESI-TOF MS to accurately obtain intact protein molecular weights, and both MALDI-MS and MALDI-QIT MS for protein identification. Using these methods, protein expression profiles of both low and high stage OEAs were obtained from consecutive pH ranges (pH 5.6–4.6), and were visualized by a 2-D mass map. We have identified proteins distinguishing low versus high stage OEA by MS. Interestingly, when only high-grade (grade 2 or 3) OEAs were included in the analysis, the tumors still tended to cluster according to stage, suggesting that the altered protein expression was not solely dependent upon tumor cell differentiation. Additionally, we have demonstrated that the proteomic profiles of OEA are distinguishable from those of other types of ovarian cancer.
2 Materials and methods
2.1 Sample preparation
We have analyzed twelve OEA tumor samples: six were low stage (stage 1) and six were high stage (stages 3/4). Further, two tumors were analyzed twice, using independent tumor lysates. We also analyzed two OEAs whose staging and mutational status remained hidden to the investigators until after completion of experiments within this study. The OEA proteomic data obtained herein were also compared to proteomic data obtained from a previously published analysis of 16 ovarian clear cell carcinomas and eight ovarian serous carcinomas [26], using principal component analysis (PCA) to view tumor interrelationships. The University of Michigan Institutional Review Board (IRB) approved the experimental protocol. The OEAs were histologically analyzed and staged by a board-certified pathologist (K. R. C.) prior to utilization in this study. The tumor tissues were stored at −80°C until use. The tissue samples were solubilized in lysis buffer using a minibead beater (Biospec, Bartlesville, OK). The lysis buffer was composed of 7 M urea (Sigma–Aldrich, St. Louis, MO), 2 M thiourea (Sigma–Aldrich), 100 mM DTT (Sigma–Aldrich), 0.2% n-octyl-β-D-glucopyranoside (OG; Sigma–Aldrich), 0.5% biolyte ampholytes, pH 3–10 (BioRad, Hercules, CA), 10% glycerol (Sigma–Aldrich), and 2% v/v of 50×diluted protease inhibitor cocktail solution. The homogenized tissue samples were incubated at room temperature for 30 min, then centrifuged (35 000×g, 1 h, 4°C) to pellet insoluble material. The lysed samples were exchanged from the lysis buffer solution to the buffer solution for further chromatofocusing (CF) experiments, using a PD–10G column (Amersham Bioscience, Piscataway, NJ). The Brad-ford protein assay (BioRad) was used for protein quantitation.
2.2 CF
CF was performed on a Beckman System Gold model 127s binary HPLC pump with high-pressure mixer (Fullerton, CA, USA), and an HPCF 1-D column (2.1×250 mm2) (Eprogen, Darien, IL). Two buffer solutions (a start buffer (SB) and an elution buffer (EB)) were utilized for the generation of a pH gradient on the CF column. The SB solution was composed of 6 M urea and 25 mM Bis-Tris (pH 7.4). The EB solution was composed of 6 M urea and 10% poly-buffer74 (pH 3.8). Both buffer solutions were brought to pH by addition of a saturated solution of iminodiacetic acid. The CF column was preequilibrated with SB, after which the mobile phase was switched to EB solution for pH gradient initiation. The pH gradient was monitored on-line with a postdetector pH flow cell (Lazar Research Laboratories, Los Angeles, CA). The UV absorbance of the eluent was monitored on-line at 280 nm. The flow rate was 0.2 mL/min, with fractions collected in 0.2 pH units. Each fraction was stored at −80°C until use.
2.3 On-line mass mapping by nonporous silica (NPS) RP-HPLC with LC-ESI-TOF MS
The second dimensional separation and MW determination of proteins were performed simultaneously using ESI-TOF MS (LCT System, Waters-Micromass, Manchester, UK) coupled with NPS RP-HPLC. The separation was performed with an ODS-I column (4.6×33 mm2), which is a packed column with polymeric C18, 1.5 μm silica (Eprogen). The UV absorbance was monitored on-line at 214 nm on a Beck-man 166 System Gold HPLC system. A water/ACN gradient, containing 0.1% TFA, was used, with 0.3% of formic acid v/v in 50% ACN solution added separately with a postcolumn splitter before ESI-TOF MS. The gradient was as follows: from 5 to 10% in 1 min, 10 to 25% in 1 min, 25 to 35% in 3 min, 35 to 45% in 5 min, 45 to 75% in 10 min, 75 to 100% in 1 min, 100% in 1 min, and 100 to 5% in 1 min. The flow rate was 0.4 mL/min for the separation. Approximately 30% of the eluent from HPLC was delivered on-line to the ESI-TOF MS, with the remainder collected using an automated fraction collector. The ESI-TOF MS was set as follows: capillary voltage 3000 V, sample cone 37 V, extraction cone 5 V, desolvation temperature 200°C, source temperature 110°C, desolvation gas flow 600 L/h, and maximum nebulizer gas flow. Prior to each experiment, the instrument was externally calibrated by direct injection of the NaI/CsI solution. Five picomolar bovine insulin (Sigma–Aldrich) was added to the sample for internal standard and normalization. The intact MW value was determined by deconvoluting the combined ESI spectra of the protein utilizing Protein Trawler™ (Bio-Analyte, Portland, ME). The Protein Trawler program allows fast deconvolution processing based on MaxEnt 1 algorithm in MassLynx V 4.0 program.
2.4 Trypsin digestion
All of the NPS RP-HPLC sample fractions were lyophilized to 20 μL, with any remaining TFA neutralized by the addition of 10% v/v NH4HCO3 into samples. After the addition of 10% v/v DTT and 0.25 μg of TPCK-treated trypsin (Promega, Madison, WI) to each sample, the samples were vortexed, and then incubated at 37°C for 18 h. The tryptic digestion was terminated by the addition 2.5% v/v TFA.
2.5 MALDI-MS and MALDI-QIT MS analysis
The digested samples were desalted on 2 μm C18 ZipTips (Millipore) before spotting onto a MALDI-QIT plate. MALDI-QIT targets were prepared by depositing 0.5 μL of the sample on the plate with 0.5 μL of matrix solution (1:4 dilution of saturated CHCA (in 50% ACN, 1% TFA)), containing 50 fmol of angiotensin I, adrenocorticotropin (ACTH, amino acid 1–17), and adrenocorticotropin (ACTH, 18–39) for the internal calibration. The mixture was dried at ambient conditions. The delayed extraction reflectron mode was utilized during MALDI-TOF MS analysis. The operation condition was as follows: operating voltage 20 kV, extraction voltage 19 950 V, focusing voltage 16 kV, reflectron 24.5 kV, and nitrogen laser operating 337 nm. The pulse voltage was 2300 V, and sensitivity was 100 mV. Peptide mass spectra, with a mass range of 800–5000 Da, were obtained during MALDI-TOF MS analysis. The matrix solution for MALDI-QIT was prepared from DHB (2,5,-dihydroxybenzoic acid) in 50% ACN, 0.1% TFA. Data acquisition and processing during MALDI-QIT-TOF analysis were controlled by Kratos “Launchpad” software, with the standard instrument setting for optimum transmission at medium mass. The MALDI-QIT-TOF was externally calibrated using fullerite deposited directly onto the plate. The data acquired from MALDI-TOF MS analysis were searched in MS-fit (http://pro-spector.ucsf.edu/ucsfhtml13.4/msfit.htm) for protein identification. For the MS-fit, the Swiss-Prot (http://us.expasy.org) databases were searched using the following parameters: (i) species: homo sapiens; (ii) maximum number of missed cleavages: 1; (iii) possible modifications: peptide N-terminal glutamine to pyroglutamic acid, oxidation of methionine, protein N-terminus acetylated, and phosphorylation of serine, threonine, and tyrosine; (iv) peptide mass tolerance: 50 ppm; (v) MW ranged from 1000 to 90 000 Da; (vi) pI range of proteins 4–8. The MALDI-QIT-TOF confirmed the identified proteins by MALDI-MS. The data acquired from MALDI-QIT-TOF were searched in MASCOT using Swiss-Prot with the following parameters; (i) species: homo sapiens (ii) possible modifications: peptide N-terminal glutamine to pyroglutamic acid, oxidation of methionine, protein N-terminus acetylated, and phosphorylation of serine, threonine, and tyrosine (iii) peptide tolerance: 1.2 Da (iv) MS/MS tolerance: 0.8 Da (v) peptide charge: +1. The following criteria were used to obtain a confident search result: (i) MOWSE score was at least 103; (ii) four minimum matched peptides (iii) two or more consecutive y- or b-series ions for MS/MS; (iv) total six or more y- or b ions for MS/MS.
2.6 Data analysis
To compare protein expression between low stage (stage 1) versus high stage (stages 3/4) OEAs, MW and intensity of proteins obtained by deconvoluting the ESI spectra were converted to a single text file, and were then transformed by log10 (max [X + 100.0] + 100). Higher abundance proteins were selected and colored in the mass map if the t-test p-value of the log-transformed data between the two groups (low and high stage OEAs) was <0.05, with ≥2-fold increase in the protein expression ratio. Both hierarchical clustering (HC) and PCA techniques were utilized to view sample relationships, based upon protein expression similarities. The HC produced dendrograms in which points are close if they have greater correlation, found by calculating the Pearson correlation coefficient. PCA facilitated a 2-D view of protein expression of different types of ovarian cancer (serous, clear, endometrioid) at pH 5.4–5.2, thus transforming the dataset to a new coordinate system such that the greatest variance from expression dataset turn into the first principal component, the second greatest variance becomes the second component, and so on. Two components displayed the relationship of the dataset in which similar data are more closely located. Two sets of protein expression data were compared by analysis with DeltaVue software (Beckman Coulter), with each protein map having a different color (red, green) and differences between the two protein maps shown in a third map (middle).
2.7 Ovarian tumor tissue microarrays and immunohistochemistry
Two ovarian tumor tissue microarrays were constructed as described [27], with the tissues randomly selected from the University of Michigan Pathology archives. These two tissue microarrays (combined) contained triplicates of ovarian tumor samples, including five clear cell carcinomas, 26 ovarian papillary serous carcinomas, six ovarian endometrioid carcinomas, 15 metastatic ovarian carcinomas, eight mixed ovarian serous/endometrioid carcinomas, four ovarian serous/clear cell carcinomas, one papillary serous cysta-denocarcinoma, and one mixed anaplastic/endometrioid carcinoma. Immunohistochemistry for Lamin A/C was performed using a mouse mAb (clone JOL2, Chemicon) at 1:50 dilution; immunohistochemistry for S100A9 (Calgranulin B) was performed using a mouse mAb (Clone 1C10, Novus Biologicals) at 1:600 dilution. Anti-Lamin A/C and anti-S100A9 primary antibodies were hybridized to both tissue microarrays for 30 min at RT using citrate buffer (pH 6.0) and microwave antigen retrieval (10 min) and the Dako automated instrument (Dako Cytomation, Carpinteria, CA). Detection of the primary antibody was performed using the Dako Envision kit.
3 Results and discussion
In this work, 12 ovarian endometrioid carcinoma tumor samples (six low stage (stage 1) and six high stage (stages 3/4) were analyzed in the initial training set by 2-D liquid-based protein separation methodology. Differentially expressed proteins in the low stage versus high stage tumors were subsequently identified using MS. Extracted tumor proteins were resolved by CF in the first dimensional separation (based on pI), followed by NPS RP-HPLC separation in the second dimension (based on hydrophobicity). Intact protein MW values obtained by ESI-TOF MS were deconvoluted by Protein Trawler to generate a list of protein MW and intensities. Proteins were identified using MALDI-TOF MS, and confirmed by MALDI-TOF-QIT MS/MS. 2-D mass maps (based upon the intact protein pI and MW) facilitated comparison of protein expression between different samples. OEA tumor samples were categorized as either low stage (stage 1) or high stage (stages 3/4) tumors. Five out of six low stage OEAs had CTNNB1, PTEN, and/or PIK3CA mutations and lacked p53 mutations. In contrast, five out of six high stage (stages 3/4) OEAs had mutant p53 and lacked mutations predicted to deregulate Wnt/β-catenin and PI3K/Pten/Akt signaling (Table 1).
Table 1.
Summary of OEAs utilized in this study
| Tumor | Clinical data | CTNNB1 mutation (exon 3) | PTEN mutation (exons 1–9) | PIK3CA mutation (exons 9, 20) | TP53 mutation (exons 5–8) | IHC | ||||||
|---|---|---|---|---|---|---|---|---|---|---|---|---|
| ID | Age | Stage | Grade | AA | Codon | AA | Codon (exon) | AA | Codon (exon) | AA | Codon (exon) | p53 |
| OE-15T | 61 | 1C | 3 | – | – | – | – | – | – | – | – | − |
| OE-17T | 67 | 1C | 2 | Ser–Cys | 33 | – | – | – | – | – | – | − |
| OE-20T | 69 | 4 | 2 | – | – | – | – | – | – | – | – | + |
| OE-24T | 66 | 3C | 1 | – | – | – | – | – | – | Tyr–Asn | 236 (Exon 7) | + |
| OE-25T | 58 | 3 | 3 | – | – | – | – | – | – | Arg–His | 273 (Exon 8) | + |
| OE-28T | 73 | 4 | 3 | – | – | – | – | – | – | – | – | + |
| OE-35T | 70 | 4 | 3 | – | – | – | – | – | – | Stop | 196 (Exon 6) | − |
| OE-37T | 40 | 1A | 1 | Ser–Cys | 37 | – | – | – | – | – | – | − |
| OE-39T | 73 | 3C | 2 | – | – | – | – | – | – | Val–Leu | 216 (Exon 6) | + |
| OE-44T | 69 | 1 | 1 | Ser–Cys | 33 | – | – | – | – | – | – | − |
| OE-47T | 72 | 1A | 1 | Ser–Ala | 37 | – | – | – | – | – | – | − |
| OE-48T | 37 | 1C | 1 | Gly–Glu | 34 | Thr–Pro | 131 (Exon 5) | – | – | – | – | − |
| OE-71T | 49 | 1C | 2 | Gly–Val | 34 | Glu–Lys | 542 (Exon 9) | – | – | − | ||
| OE-104T | 61 | 3C | 3 | – | – | – | – | – | – | Pro–Ser | 151 (Exon 5) | + |
We used CF to resolve extracted proteins (based upon protein pI) to compare protein expression profiles associated with the clinical stage of the tumors. We utilized a pH range of 5.6–4.6, as the greatest number of the proteins from the CF column eluted in this range according to the UV absorption profile. Within the selected pH range, the second dimensional separation and the ESI-TOF MS were simultaneously performed to generate 2-D mass maps displaying both protein MW and expression level. Moreover, the 2-D mass maps facilitated comparison of differential protein expression between the low stage and high stage tumors. A comparison of the mass maps for low stage and high stage OEA tumors from pH 5.6 to 4.6, at 0.2 pI intervals, is shown in Fig. 1. The blue bands represent over-expression of proteins in high stage tumors; the purple bands indicate proteins with over-expression in low stage tumors. Overall, more proteins were over-expressed in high stage OEAs, than were over-expressed in low stage OEAs. As shown in Fig. 1, proteins over-expressed in the high stage OEAs were more frequently present in the pI range of 5.4–5.2, whereas proteins over-expressed in low stage OEAs were more frequently present in a lower pI range (e.g., pH 4.8–4.6). This subtle pH change in terms of protein expression based on OEA stages may indicate post-translational changes in protein expression during tumor progression.
Figure 1.

Comparison of mass maps showing protein expression differences between low stage (stage 1) and high stage (stage 3/4) ovarian endometrioid tumors across several pH ranges. The blue bands represent over-expression of proteins in the high stage tumors. The purple bands represent over-expression of proteins in the low stage tumors.
Differences in protein expression between low stage and high stage OEAs might be related to the mutational status of the OEAs. CTNNB1, PTEN, PIK3CA, and/or p53 mutations may all have profound effects on global protein expression in the tumor cells. Table 2 indicates the proteins over-expressed in low stage OEAs. Some of these proteins were previously identified as candidate markers of ovarian cancer, including Calgranulin B, and protein phosphatase 2, catalytic subunit, alpha isoform. Calgranulin B shows the most elevated level of expression difference between low stage and high stage OEAs in this study. It is a member of S100 family, and is a Ca2+-binding protein that plays a role in carcinogenesis through the inhibition of p53, and forms a complex with calgranulin A to prevent phosphorylation of various molecules necessary for normal transcription and translation [24]. Additionally, calgranulin B serves as a ligand that can bind to the receptor for advanced glycation end products (RAGE). This receptor–ligand complex may activate a cellular signaling cascade that influences cell division [28]. Calgranulin B was previously identified in both cystic ovarian carcinomas and in the serum of corresponding patients. This protein may have utility as a diagnostic biomarker to distinguish between malignant and benign ovarian tumors [29], and may have utility for the diagnosis of OEA and other forms of ovarian cancer.
Table 2.
Over-expressed proteins in low stage (stage 1) ovarian endometrioid tumors
| Protein name | Access no. | Protein MW/pI | Observed MW | Observed pH range | Protein fold-changes | Mowse score | Sequence coverage (%) |
|---|---|---|---|---|---|---|---|
| Calgranulin B | P06702 | 13 242/5.7 | 13 524 | 5.4–5.2 | 7.9 | 1.04E + 05 | 54 |
| Ras-related protein Rab-1A (YPT1-related protein) | P62820-3 | 13 744/5.4 | 13 795 | 5.2–5.0 | 2 | 7361 | 53 |
| E2F transcription factor 7 | Q96AV8 | 14 660/5.1 | 14 791 | 5.4–5.2 | 2.1 | 5642 | 36 |
| PP2A, catalytic subunit, alpha isoform | P67775 | 35 571/5.3 | 35 504 | 5.6–5.4 | 2.7 | 2.11E + 06 | 33 |
| Inorganic PPase 2, mitochondrial precursor (PPase 2) | Q9H2U2 | 37 963/7.1 | 38 065 | 5.4–5.2 | 2.56 | 2.29E + 04 | 41 |
| Ubiquitin ligase protein RNF8 | O76064 | 55 518/7.1 | 55 557 | 5.0–4.8 | 4.8 | 8.84E + 04 | 41 |
| RUFY1 | Q96T51 | 69 079/5.6 | 69 153 | 4.8–4.6 | 5.5 | 2.10E + 06 | 37 |
| Myotubularin-related protein 6 | Q9Y217 | 71 955/7.6 | 71 961 | 5.2–5.0 | 2 | 1.28E + 08 | 42 |
Protein phosphatase 2, catalytic subunit, alpha isoform (PP2A) has been intensely studied in recent years [30, 31]. We have demonstrated an over-expression of PP2A in the low stage OEAs. PP2A may regulate the Wnt signaling pathway at multiple levels [32]. It is plausible that over-expression of PP2A results as part of futile negative feedback in tumors with downstream mutations in the Wnt signaling pathway. Thus, the over-expression of PP2A proteins in low stage OEAs is not surprising, as five out of six low stage tumors used in the initial training set have a mutated CTNNB1 gene encoding β-catenin. Other proteins of interest in OEA include Ras-related protein Rab1A (RAB1A), RUN and FYVE domain containing protein 1 (RUFY1), and inorganic pyrophosphatase 2 (PPase 2, PPA2; Fig. 2). RAB1A is a member of an oncogene family, and plays a role in the regulation of vesicular transport from the ER to the Golgi complex [33]. In a study of alternative mRNA splicing in cancer, the Rab1A transcripts are only alternatively spliced variants [34], not with the regularly spliced variants found in normal tissues. The absence of regularly spliced isoforms may be associated with tumor-igenesis, although that study did not include analysis of ovarian cancer. Rab1A protein may be associated with tumor development. RUFY1 contains C-terminal RUN domain and N-terminal FYVE domain with two coiled-coil domains in between. RUFY1 protein is tyrosine-phosphorylated and interacts with Etk (epithelial and endothelial tyrosine kinase) through the SH3 and SH2 domains [35]. Although the role of RUFY1 proteins is unclear, interaction with Etk appears to be involved in the regulation of endocytosis. Inorganic PPase 2 is essential for mitochondrial function. According to previous studies [36, 37], inorganic PPase 2 participates in the regulation of cellular pH in the tumor, and is related to alkaline phosphatase, which regulates intracellular to extracellular movement of inorganic pyrophosphate.
Figure 2.

Identification of inorganic pyrophosphatase. QIT-TOF-MS spectra of the peak for m/z 1694.8.
Table 3 indicates the over-expressed proteins in the high stage OEAs, some of which were previously described in other types of malignancies. For example, ATP synthase D (Fig. 3) is over-expressed in high stage tumors in the pH 4.8–4.6 range, and has also been shown to be over-expressed in lung cancer [38]. It may play an important role in H+ transportation, which is an essential mechanism for tumor adaptation in a microenvironment. High-affinity cGMP-specific 3′,5′-cyclic phosphodiesterase 9A (cIAP1) has been studied in both lung [39] and cervical cancer [40]. cIAP1 is over-expressed in lung cancer, and functions as a mediator of tumor necrosis factor (TNF) receptor signaling. This protein has antiapoptotic activity [41] and protein expression is induced by hypoxia [42]. Tumor protein D53 is a member of tumor protein D52 family and its expression is elevated in breast cancer cells [43]. This protein shows over-expression at the G2-M transition and is a regulator of cell cycle progression.
Table 3.
Over-expressed proteins in high stage (stage 3/4) ovarian endometrioid tumors
| Protein name | Access no. | Protein MW/pI | Observed MW | Observed pH range | Protein fold-changes | Mowse score | Sequence coverage (%) |
|---|---|---|---|---|---|---|---|
| ATP synthase D chain, mitochondrial | O75947 | 18 479/5.21 | 18 594 | 5.4–5.2 | 2.39 | 6689 | 72 |
| Tumor protein D53 (hD53) (D52-like 1) | Q16890 | 22 449/5.5 | 22 464 | 5.4–5.2 | 2 | 2.13E + 05 | 47 |
| Ras-related protein Rab-14 | P61106 | 23 766/5.8 | 24 085 | 5.4–5.2 | 2.8 | 1.75E + 04 | 44 |
| Potassium channel tetramerization domain containing protein 4 | Q8WVF5 | 29 996/7.0 | 29 979 | 5.4–5.2 | 2.9 | 7037 | 40 |
| Alkaline phosphatase, tissue-nonspecific isozyme precursor | P05186 | 57 279/6.2 | 57 240 | 5.4–5.2 | 1.3 | 6.62E + 06 | 33 |
| T-complex protein 1, theta subunit (TCP-1-theta) | P50990 | 59 621/5.4 | 59 565 | 5.6–5.4 | 2 | 2.90E + 08 | 36 |
| Lamin A/C (70 kDa lamin) | P02545-2 | 65 134.8/6.4 | 65 145 | 4.8–4.6 | 1.8 | 2.93E + 11 | 48 |
| High-affinity cGMP-specific 3′,5′-cyclic phosphodiesterase 9A | O76083 | 68 493/5.9 | 68 468 | 5.4–5.2 | 7.4 | 2.58E + 06 | 33 |
| Baculoviral IAP repeat-containing protein 2 | Q13490 | 69 899.67/6.27 | 69 844 | 5.4–5.2 | 2.3 | 2.10E + 06 | 37 |
| Vesicle-fusing ATPase | P46459 | 82 655/6.4 | 82 717 | 5.2–5.0 | 2.1 | 9.86E + 05 | 29 |
Figure 3.

Identification of ATP synthase, synthase D chain, mitochondrial. QIT-TOF-MS spectra of peak m/z 1351.6.
Not all of the proteins identified in our study have obvious biological relevance in terms of OEA stage. Lamin A/C is involved in nuclear stability and chromatin structure, and has been primarily studied in lung cancer [44]. In lung cancer, the expression of Lamin A/C decreases along with the expression of other cytoskeletal proteins, including vimentin. However, a previous analysis of ovarian cancer cell lines demonstrated Lamin A/C over-expression. In the present study, we have demonstrated a 1.8-fold increase in Lamin A/C expression in the stage 3/4 tumors that were analyzed.
Interestingly, four out of the eight over-expressed proteins in low stage OEAs are metal binding proteins. In high stage OEAs, three out of nine over-expressed proteins are metal binding proteins. Most of the metal binding proteins are associated with protein structural changes, which may perturb protein functionality. Further, several ATP and GTP-binding proteins were over-expressed in the high stage OEAs. The increased expression of ATP and GTP-binding proteins in high stage OEAs may be associated with cancer progression.
In order to confirm the reproducibility of our findings, we repeated the assays for samples OE-24T and OE-28T. Thus, tumor OE-24T(R) was actually a second, independent sample of tumor OE-24T; tumor OE-28T(R) was actually a second, independent sample of tumor OE-28T. Both of the repeated tumor samples were processed in an identical manner to all the other tumor samples in our study, using the 2-D liquid-based separation/mass mapping methodology. Figure 4 displays the 2-D mass map comparing OE-24T(R) versus OE-24T at pH 5.0–4.8. Figure 5 displays the 2-D mass map comparing OE-28T(R) versus OE-28T at pH 5.4–5.2. In both cases, the protein bands of the tumor tissue from the second (independent) analysis matched well with the protein bands of the tumor tissue from the initial analysis. As expected, as both of the repeated tumors were high stage tumors, both tumors partitioned into the high stage tumors in the dendrogram (Fig. 6).
Figure 4.

Mass map showing comparison of protein expression between two individual assays from the ovarian endometrioid tumor. Shown is OE-24T (left) and on the right is a repeat analysis, using a lysate prepared from a different region of the same tumor.
Figure 5.

Mass map showing comparison of protein expression between two individual assays from the ovarian endometrioid tumor. Shown is OE-28T (right) and on the left is a repeat analysis, using a lysate prepared from a different region of the same tumor.
Figure 6.

Hierarchical clustering dendrogram of the OEAs utilized in this study. Included in the dendrogram are the two repeat sample analyses (OE-28T(R) and OE-24T(R)), corresponding to tumors OE-28T and OE-24T, respectively. Also included are the two tumors (OE-37T and OE-104T) whose stage and mutational status was not revealed to the investigators until after analysis was completed. White dot: low stage (stage 1). Black dot: high stage (stage 3/4).
To determine whether the protein signatures associated with high stage versus low stage tumors could correctly classify OEAs of unknown stage, we further analyzed two OEA (OE-37T and OE-104T) tumors whose staging and mutational status remained hidden to the investigators until after completion of experiments contained in this study, using the 2-D liquid-based separation/mass mapping methodology. Based upon protein identification and the mass mapping data described in this study, we have correctly assigned a clinical stage to both tumor samples. OE-37T partitioned into the other stage I OEAs in the HC dendrogram (Fig. 6). At pH 5.4–5.2, the protein bands from OE-37T matched well with a stage 1 sample, OE-47T (Fig. 7). OE-37T is a well-differentiated stage 1 OEA with mutant β-catenin. Figure 7 displays the 2-D mass map comparing OE-37T versus OE-47T at pH 5.4–5.2. The protein bands from the OE-37T tissue matched well with the protein bands in the OE-47T tumor tissue. OE-37T tissue partitioned into the other stage 1 tumors (Fig. 5), as OE-37T has features similar to those of other stage 1 cancer tissue samples having mutated CTNNB1 and nuclear β-catenin accumulation, indicating that tumors with similar mutations may show close relationships in the dendrogram. We also analyzed a second tumor sample, OE-104T, whose staging and mutational status remained hidden from the investigators until after analysis was completed. It clustered into the high stage OEA group in Fig. 6 and the protein bands at pH 5.2–5.0 matched well with the bands from OE-39T, which is a stage 3 OEA (Fig. 8). Indeed, OE-104T is a stage 3 OEA that has a p53 mutation. Figure 8 displays the 2-D mass map comparing OE-104T versus OE-39T at pH 5.2–5.0. These results suggest that clustering using proteomic data alone may help to reveal staging information about the tumors. Our study shows that it is possible to resolve low stage OEA from high stage OEA on a proteomic level.
Figure 7.

Mass map comparison of protein expression between OE-47T (right), a stage 1 ovarian endometrioid tumor and OE-37T (left), an OEA whose stage and mutational status was not revealed to the investigators until after analysis was completed.
Figure 8.

Mass map comparison of protein expression between OE-39T (right), a stage III ovarian endometrioid tumor and OE-104T (left), an OEA whose stage and mutational status was not revealed to the investigators until after analysis was completed.
Further, we explored whether we would be able to distinguish OEA tumor staging independent of tumor grade (degree of tumor cell differentiation). To this end, we reanalyzed and re-clustered our data, using only the high grade OEAs (either low or high stage) previously analyzed. We compared the three (out of six) independent high grade OEAs that were diagnosed at low stage with the six (out of seven) independent high grade OEAs that were diagnosed high stage. Interestingly, although we did not find perfect segregation of tumor stage in our clustering dendrogram, we did find that all three low stage OEAs tended to cluster together (Fig. 9). These results suggest that the altered protein expression was not solely dependent upon tumor cell differentiation.
Figure 9.
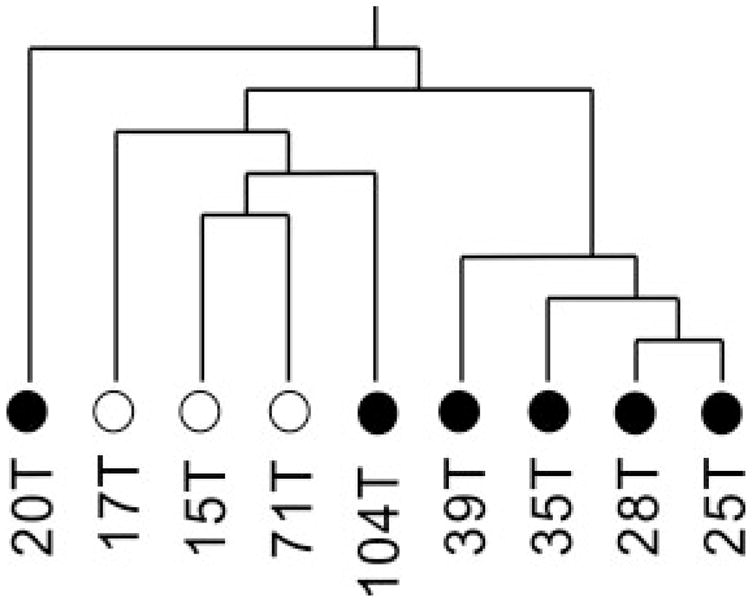
Hierarchical clustering dendrogram of only the high grade (2 and 3) OEAs utilized in this study. Grade 2: 17T, 71T, 20T, 39T; Grade 3: 15T, 25T, 28T, 35T, 104T. White dot: low stage (stage 1). Black dot: high stage (stage 3/4).
The proteomic maps produced in this work may have utility to classify OEA from other ovarian carcinomas. Gene expression data suggest that OEA is similar to clear ovarian cancer in advanced stages and to serous ovarian cancer in the early stages [45]. We have compared our proteomic data for endometrioid ovarian carcinomas obtained within to that of serous and clear cell proteomic data obtained previously [26]. Figure 10 shows the PCA of protein mass map data of three different subtypes (serous, endometrioid, clear) of ovarian cancer in the pI range of 5.4–5.2, which is the pI range from the first dimension separation with the highest abundance of proteins. It is possible to classify the different subtypes of ovarian cancer by analysis of proteomic data, thus suggesting that different subtypes of ovarian cancer may be discernable at the protein level (Fig. 6).
Figure 10.

PCA analysis of endometrioid, serous and clear cell ovarian cancer.
3.1 Immunohistochemical analysis of Lamin A/C and S100A9
To further confirm the stage-dependent protein identifications, Lamin A/C and S100A9 (calgranulin B) expression in ovarian endometrioid tumors was assessed by immunohistochemistry (Fig. 11), using mouse monoclonal anti-Lamin A/C and anti-S100A9 antibodies and the ovarian tumor tissue microarrays. Strong nuclear membrane immunoreactivity for Lamin A/C was documented (Figs. 11A and B) in the majority of the ovarian endometrioid tumors. There were no significant staining differences observed with regard to tumor stage, in apparent discordance with the findings from the mass mapping experiments. However, using immunohistochemistry to discern small differences in protein expression is difficult. We documented only a 1.8-fold difference in expression between early and late stage ovarian endometrioid tumors in the mass mapping experiments. This fold change in expression levels may not be apparent by immunohistochemistry. Diffuse and consistent cytosolic immunoreactivity for S100A9 was documented in early stage ovarian endometrioid tumors, whereas late stage tumors exhibited low levels of immunoreactivity (Figs. 11C and D). These findings were concordant with the findings from the mass mapping experiments.
Figure 11.

Immunohistochemical staining of Lamin A/C and S100A9 (calgranulin B). Both early stage (stage 1; A) and advanced stage (stage 3; B) ovarian endometrioid tumors stained for Lamin A/C immunoreactivity are shown, demonstrating predominantly nuclear membrane immunoreactivity in the neoplastic cells, with slightly higher immunoreactivity in the advanced stage tumor. Both early stage (stage 1; C) and advanced stage (stage 3; D) ovarian endometrioid tumors stained for S100A9 immunoreactivity are shown, demonstrating diffuse and consistent cytosolic immunoreactivity in the neoplastic cells of the early stage tumor (C), with inflammatory cells showing immunoreactivity in the advanced stage tumor (D).
4 Concluding remarks
Gene expression studies have yielded limited results in distinguishing endometrioid ovarian cancer from other types of ovarian cancer. We have demonstrated that the profiling of proteins in tumor samples, based on pI and molecular weight using on-line mass mapping, has facilitated the correct staging of OEA. Protein expression levels for two tumors whose staging and mutational status were not revealed to the investigators until after analysis was completed were predictive of correct tumor stage in mass mapping dendrograms. Further, we have demonstrated that endometrioid ovarian cancer has a unique protein signature, as compared to other subtypes of ovarian cancer. Protein profiling can facilitate stage-dependent ovarian tumor classification.
Acknowledgments
This work was supported, in part, by the National Cancer Institute under grant R01 CA100104 (D.M.L.) and the National Institutes of Health under grant R01 GM49500 (D.M.L.).
Abbreviations
- CF
chromatofocusing
- EB
elution buffer
- HC
hierarchical clustering
- NPS
nonporous silica
- OEA
ovarian endometrioid adenocarcinoma
- PPase 2
pyrophosphatase 2
- RUFY1
RUN and FYVE domain containing protein 1
- SB
start buffer
Footnotes
The authors have declared no conflict of interest.
References
- 1.Jemal A, Murray T, Ward E, Samuels A, et al. Cancer statistics. CA Cancer J Clin. 2006;55:10–30. doi: 10.3322/canjclin.55.1.10. [DOI] [PubMed] [Google Scholar]
- 2.Bell DA. Origins and molecular pathology of ovarian cancer. Mod Pathol. 2005;18:S19–S32. doi: 10.1038/modpathol.3800306. [DOI] [PubMed] [Google Scholar]
- 3.Ichikawa Y, Nishida M, Suzuki H, Yoshida S, et al. Mutation of K-ras protooncogene is associated with histological subtypes in human mucinous ovarian tumors. Cancer Res. 1994;54:33–35. [PubMed] [Google Scholar]
- 4.Cuatrecasas M, Villanueva A, Matias-Guiu X, Prat J. K-ras mutations in mucinous ovarian tumors: A clinicopathologic and molecular study of 95 cases. Cancer. 1997;79:1581–1586. doi: 10.1002/(sici)1097-0142(19970415)79:8<1581::aid-cncr21>3.0.co;2-t. [DOI] [PubMed] [Google Scholar]
- 5.Enomoto T, Weghorst CM, Inoue M, Tanizawa O, Rice JM. K-ras activation occurs frequently in mucinous adenocarcinomas and rarely in other common epithelial tumors of the human ovary. Am J Pathol. 1998;139:777–785. [PMC free article] [PubMed] [Google Scholar]
- 6.Gamallo C, Palacios J, Moreno G, Calvo de Mora J, et al. Beta-catenin expression pattern in stage I and II ovarian carcinomas: Relationship with beta-catenin gene mutations, clinicopathological features, and clinical outcome. Am J Pathol. 1999;155:527–536. doi: 10.1016/s0002-9440(10)65148-6. [DOI] [PMC free article] [PubMed] [Google Scholar]
- 7.Sagae S, Kobayashi K, Nishioka Y, Sugimura M, et al. Mutational analysis of beta-catenin gene in Japanese ovarian carcinomas: Frequent mutations in endometrioid carcinomas. Jpn J Cancer Res. 1999;90:510–515. doi: 10.1111/j.1349-7006.1999.tb00777.x. [DOI] [PMC free article] [PubMed] [Google Scholar]
- 8.Wright K, Wilson P, Morland S, Campbell I, et al. Beta-catenin mutation and expression analysis in ovarian cancer: Exon 3 mutations and nuclear translocation in 16% of endometrioid tumours. Int J Cancer. 1999;82:625–629. doi: 10.1002/(sici)1097-0215(19990827)82:5<625::aid-ijc1>3.0.co;2-2. [DOI] [PubMed] [Google Scholar]
- 9.Wu R, Zhai Y, Fearon ER, Cho KR. Diverse mechanisms of beta-catenin deregulation in ovarian endometrioid adenocarcinomas. Cancer Res. 2001;61:8247–8255. [PubMed] [Google Scholar]
- 10.Kildal W, Risberg B, Abeler VM, Kristensen GB, et al. Beta-catenin expression, DNA ploidy and clinicopathological features in ovarian cancer: A study in 253 patients. Eur J Cancer. 2005;41:1127–1134. doi: 10.1016/j.ejca.2005.01.022. [DOI] [PubMed] [Google Scholar]
- 11.Catasus L, Bussaglia E, Rodrguez I, Gallardo A, et al. Molecular genetic alterations in endometrioid carcinomas of the ovary: Similar frequency of beta-catenin abnormalities but lower rate of microsatellite instability and PTEN alterations than in uterine endometrioid carcinomas. Hum Pathol. 2004;35:1360–1368. doi: 10.1016/j.humpath.2004.07.019. [DOI] [PubMed] [Google Scholar]
- 12.Vogelstein B, Kinzler KW. Cancer genes and the pathways they control. Nat Med. 2004;10:789–799. doi: 10.1038/nm1087. [DOI] [PubMed] [Google Scholar]
- 13.Palacios J, Gamallo C. Mutations in the beta-catenin gene (CTNNB1) in endometrioid ovarian carcinomas. Cancer Res. 1998;58:1344–1347. [PubMed] [Google Scholar]
- 14.Zhai Y, Wu R, Schwartz DR, Darrah D, et al. Role of beta-catenin/T-cell factor-regulated genes in ovarian endometrioid adenocarcinomas. Am J Pathol. 2002;160:1229–1238. doi: 10.1016/s0002-9440(10)62550-3. [DOI] [PMC free article] [PubMed] [Google Scholar]
- 15.Schwartz DR, Wu R, Kardia SL, Levin AM, Huang CC. Novel candidate targets of beta-catenin/T-cell factor signaling identified by gene expression profiling of ovarian endometrioid adenocarcinomas. Cancer Res. 2003;63:2913–2922. [PubMed] [Google Scholar]
- 16.Tashiro H, Blaeze M, Wu R, Cho KR, et al. Mutations in PTEN are frequent in endometrial carcinoma but rare in other common gynecological malignancies. Cancer Res. 1997;57:3935–3940. [PubMed] [Google Scholar]
- 17.Obata K, Morland SJ, Watson RH, Hitchcock A, et al. Frequent PTEN/MMAC mutations in endometrioid but not serous or mucinous epithelial ovarian tumors. Cancer Res. 1998;58:2095–2097. [PubMed] [Google Scholar]
- 18.Oda K, Stokoe D, Taketani Y, McCormick F. High Frequency of coexistent mutations of PIK3CA and PTEN genes in endometrial carcinoma. Cancer Res. 2005;65:10669–10703. doi: 10.1158/0008-5472.CAN-05-2620. [DOI] [PubMed] [Google Scholar]
- 19.Wu R, Hendrix-Lucas N, Kuick R, Zhai Y, et al. Mouse model of human ovarian endometrioid adenocarcinoma based on somatic defects in the Wnt/beta-catenin and PI3K/Pten signaling pathways. Cancer Cell. 2007;11:321–333. doi: 10.1016/j.ccr.2007.02.016. [DOI] [PubMed] [Google Scholar]
- 20.Ahmed N, Oliva KT, Barker G, Hoffmann P, et al. Proteomic tracking of serum protein isoforms as screening bio-markers of ovarian cancer. Proteomics. 2005;5:4625–4636. doi: 10.1002/pmic.200401321. [DOI] [PubMed] [Google Scholar]
- 21.Jones MB, Krutzsh H, Shu H, Zhao Y, et al. Proteomic analysis and identification of new biomarkers and therapeutic targets for invasive ovarian cancer. Proteomics. 2002;2:76–84. [PubMed] [Google Scholar]
- 22.Petricoin EF, III, Ardekani AM, Hitt BA, Levine PJ, et al. Use of proteomic patterns in serum to identify ovarian cancer. Lancet. 1999;359:572–577. doi: 10.1016/S0140-6736(02)07746-2. [DOI] [PubMed] [Google Scholar]
- 23.Kachman MT, Wang H, Schwartz DR, Cho KR, Lubman DM. A 2-D liquid separation/mass mapping method for interlysate comparision of ovarian carcers. Anal Chem. 2002;74:1779–1791. doi: 10.1021/ac011159c. [DOI] [PubMed] [Google Scholar]
- 24.Wang J, Cai Y, Xu H, Zhao J, et al. Expression of MRP14 gene is frequently down-regulated in Chinese human esophageal cancer. Cancer Res. 2004;14:46–53. doi: 10.1038/sj.cr.7290201. [DOI] [PubMed] [Google Scholar]
- 25.Hamler RL, Zhu K, Buchannan NS, Kreunin P, et al. A two-dimensional liquid-phase method coupled with mass spectrometry for proteomic studies of breast cancer and biomarker identification. Proteomics. 2004;4:562–577. doi: 10.1002/pmic.200300606. [DOI] [PubMed] [Google Scholar]
- 26.Zhu Y, Wu R, Sangha N, Yoo C, et al. Classification of ovarian cancer tissues by proteomic patterns. Proteomics. 2006;6:5846–5856. doi: 10.1002/pmic.200600165. [DOI] [PubMed] [Google Scholar]
- 27.Kononen J, Bubendorf L, Kallioniemi A, Barlund M, et al. Tissue microarrays for high-throughput molecular profiling of tumor specimens. Nat Med. 1998;4:844–847. doi: 10.1038/nm0798-844. [DOI] [PubMed] [Google Scholar]
- 28.Fels LM, Buschmann T, Meuer J, Reymond MA, et al. Proteome analysis for the identification of tumor-associated biomarkers in gastrointestinal cancer. Dig Dis. 2003;21:292–298. doi: 10.1159/000075351. [DOI] [PubMed] [Google Scholar]
- 29.Ott HW, Lindner H, Sarg B, Mueller-Holzner E, et al. Calgranulins in cystic fluid and serum from patients with ovarian carcinomas. Cancer Res. 2003;63:7507–7514. [PubMed] [Google Scholar]
- 30.Chen W, Arroyo JD, Timmons JC, Possemato R, Hahn WC. Cancer-associated PP2A Aα subunits induce functional haploinsufficiency and tumorigenicity. Cancer Res. 2005;65:8183–8192. doi: 10.1158/0008-5472.CAN-05-1103. [DOI] [PubMed] [Google Scholar]
- 31.Polakis P. Wnt signaling and cancer. Genes Dev. 2000;14:1837–1851. [PubMed] [Google Scholar]
- 32.Radcliffe MJ, Itoh K, Sokol SY. A positive role for the PP2A catalytic subunit in Wnt signal transduction. J Biol Chem. 2000;275:35680–35683. doi: 10.1074/jbc.C000639200. [DOI] [PubMed] [Google Scholar]
- 33.Tisdale EJ, Bourne JR, Khosravi-Rar R, Der CJ, Balch WE. GTP-binding mutants of rab1 and rab2 are potent inhibitors of vesicular transport from the endoplasmic reticulum to the Golgi complex. J Cell Biol. 1992;119:749–761. doi: 10.1083/jcb.119.4.749. [DOI] [PMC free article] [PubMed] [Google Scholar]
- 34.Wang Z, Lo HS, Yang H, Gere S, et al. Computational analysis and experimental validation of tumor-associated alternative RNA splicing in human cancer. Cancer Res. 2003;63:655–657. [PubMed] [Google Scholar]
- 35.Yang J, Kim O, Wu J, Qiu Y. Interaction between tyro-sine kinase Etk and a RUN domain- and FYVE domain-containing protein RUFY1. A possible role of ETK in regulation of vesicle trafficking. J Biol Chem. 2002;277:30219–30226. doi: 10.1074/jbc.M111933200. [DOI] [PubMed] [Google Scholar]
- 36.Jahde E, Volk T, Atema A, Smets LA, et al. pH in human tumor xenografts and transplanted rat tumors: Effect of insulin, inorganic phosphate, and m-iodobenzylguanidine. Cancer Res. 1992;52:6209–6215. [PubMed] [Google Scholar]
- 37.Terkeltaub RA. Inorganic pyrophosphate generation and disposition in pathophysiology. Am J Physiol Cell Physiol. 2001;281:C1–C11. doi: 10.1152/ajpcell.2001.281.1.C1. [DOI] [PubMed] [Google Scholar]
- 38.Chen G, Gharib TG, Huang C, Thomas DG, et al. Proteomic analysis of lung adenocarcinoma: Identification of a highly expressed set of protein in tumors. Clin Cancer Res. 2002;8:2298–2305. [PubMed] [Google Scholar]
- 39.Dai Z, Zhu WG, Morrison CD, Brena RM, et al. A comprehensive search for DNA amplification in lung cancer identifies inhibitors of apoptosis cIAP1 and cIAP2 as candidate oncogenes. Exp Cell Res. 2004;298:535–548. doi: 10.1093/hmg/ddg083. [DOI] [PubMed] [Google Scholar]
- 40.Liu SS, Tsang BK, Cheung AN, Xue WC, et al. Anti-apoptotic proteins, apoptotic and proliferative parameters and their prognostic significance in cervical carcinoma. Eur J Cancer. 2001;37:1104–1110. doi: 10.1016/s0959-8049(01)00085-5. [DOI] [PubMed] [Google Scholar]
- 41.Clem RJ, Sheu TT, Richter BW, He WW, et al. c-IAP1 is cleaved by caspases to produce a proapoptotic C-terminal fragment. J Biol Chem. 2001;276:7602–7608. doi: 10.1074/jbc.M010259200. [DOI] [PubMed] [Google Scholar]
- 42.Dong Z, Venkatachalam MA, Wang J, Patel Y, et al. Up-regulation of apoptosis inhibitory protein IAP-2 by hypoxia. Hif-1-independent mechanisms. J Biol Chem. 2001;276:18702–18709. doi: 10.1074/jbc.M011774200. [DOI] [PMC free article] [PubMed] [Google Scholar]
- 43.Boutrous R, Bryne JA. D53 (TPD 52L1) is a cell cycle regulated protein maximally expressed at the G-M transition in the breast cancer cells. Exp Cell Res. 2005;310:152–165. doi: 10.1016/j.yexcr.2005.07.009. [DOI] [PubMed] [Google Scholar]
- 44.Waldburg N, Kahne T, Reisenauer A, Rocken C, et al. Clinical proteomics in lung disease. Pathol Res Pract. 2004;200:147–154. doi: 10.1016/j.prp.2004.02.006. [DOI] [PubMed] [Google Scholar]
- 45.Schwartz DR, Kardia SL, Shedden KA, Kuick R, et al. Gene expression in ovarian cancer reflects both morphology and biological behavior, distinguishing clear cell from other poor-prognosis ovarian carcinomas. Cancer Res. 2002;62:4722–4729. [PubMed] [Google Scholar]