

Abstract
Although the acute stroke literature indicates that cerebral blood flow (CBF) may commonly be disordered in stroke survivors, limited research has investigated whether CBF remains aberrant in the chronic phase of stroke. A directed study of CBF in stroke is needed because reduced CBF (hypoperfusion) may occur in neural regions that appear anatomically intact and may impact cognitive functioning in stroke survivors. Hypoperfusion in neurologically-involved individuals may also affect BOLD signal in FMRI studies, complicating its interpretation with this population. The current study measured CBF in three chronic stroke survivors with ischemic infarcts (greater than 1 year post-stroke) to localize regions of hypoperfusion, and most critically, examine the CBF inflow curve using a methodology that has never, to our knowledge, been reported in the chronic stroke literature. CBF data acquired with a Pulsed Arterial Spin Labeling (PASL) flow-sensitive alternating inversion recovery (FAIR) technique indicated both delayed CBF inflow curve and hypoperfusion in the stroke survivors as compared to younger and elderly control participants. Among the stroke survivors, we observed regional hypoperfusion in apparently anatomically intact neural regions that are involved in cognitive functioning. These results may have profound implications for the study of behavioral deficits in chronic stroke, and particularly for studies using neuroimaging methods that rely on CBF to draw conclusions about underlying neural activity.
Keywords: arterial spin labeling (ASL), cerebral blood flow (CBF), chronic stroke, ischemia, magnetic resonance imaging, perfusion
Introduction
While a great deal of research has investigated disruptions of neurophysiological systems in acute stroke (hours to days post-onset), very little work has examined how these systems may continue to be disordered in patients who are in the chronic stage of stroke (months to years post-onset). Research from the acute ischemic infarction literature indicates that cerebral blood flow (CBF) is typically disrupted in the neural regions that are directly infarcted as well as in proximal neural regions (i.e. Chalela et al., 2000; Detre, 2001). However, there has been scarce literature to date directly assessing the state of CBF in chronic stroke survivors. A focused investigation of CBF in chronic stroke is needed for several reasons; decreased CBF in neuroanatomically intact regions may contribute to cognitive deficits (e.g. Hillis et al., 2005; Love et al., 2002) and abnormal CBF may have an effect on the hemodynamic response, thus leading to difficulty interpreting neuroimaging results with this population (e.g. Bonakdarpour et al., 2007; Fridriksson et al., 2006). The following sections briefly review what is known regarding the nature of CBF in stroke survivors, and present evidence as to why a study of CBF in chronic stroke is of vital importance.
CBF refers to the amount of arterial blood arriving at, or perfusing, an area of neural tissue within a given time (Buxton, 2002). This concept differs from cerebral blood volume (CBV), which refers to all the blood that occupies a volume of neural tissue at any given time, including venous blood and arterial blood destined to arrive at a more distal neural region. There is an intricate relationship between CBF and neural activity, with increasing regional neurological demands closely followed by increasing blood flow to that region; however, the exact parameters of this relationship remain unclear (Buxton, 2002).
Evidence from the extant stroke literature suggests that CBF in stroke survivors may be deficient in two ways: 1) baseline CBF levels (measured in a resting state, in the absence of a cognitive task) may be abnormally low (e.g. Love et al., 2002), and 2) transit delays (the amount of time needed for arterial blood to reach and perfuse neural tissue) may be abnormally long (Fridriksson et al., 2006; Hillis, 2007; Hillis et al., 2005). When either of these disruptions occurs, regional baseline CBF levels may be adequate to sustain tissue viability, but may be inadequate to support efficient cognitive or neurological functioning (Astrup et al., 1977; Love et al., 2002; Ni et al., 1994; Sekhon et al., 1994). This condition of diminished but not abolished baseline CBF is termed hypoperfusion (see Hillis, 2007).
To date, research that has examined CBF in stroke survivors has primarily focused on acute and sub-acute stroke, studied within hours to weeks following stroke onset. This research strongly suggests that regionally specific hypoperfusion may impair cognitive and behavioral abilities supported by those regions. Hillis et al. (2001a) reported that sub-acute stroke survivors showed a correlation between reading impairments and hypoperfusion (measured as decreased regional baseline CBF and increased transit delay times) in the left angular gyrus and left posterior middle temporal gyrus; regions which are known to contribute reading performance (Price, 2004). An additional study by Hillis et al. (2001c) reported a strong correlation between hypoperfusion in the posterior superior temporal gyrus and impaired word comprehension abilities during acute stroke. With regards to the interplay between perfusion and visual attention, Hillis et al. (2005) demonstrated a correlation between hypoperfusion in the right superior temporal gyrus and right angular gyrus with the experience of visual-spatial neglect in acute stroke. A study by Okuda et al. (1999) supported a relationship between frontal cortical hypoperfusion and the development of dysarthria in sub-acute stroke (see also Hillis, 2002; Hillis et al., 2000; Hillis et al., 2004).
In addition to hypoperfusion in acute and sub-acute stroke, aberrant CBF may endure in chronic stroke patients and may contribute to cognitive deficits. Specifically, Love et al. (2002) correlated hypoperfusion in the region of the angular gyrus with slowed reading abilities in a chronic stroke survivor. Crucially, in each of the studies reported above, regardless of how much time had passed since stroke onset, hypoperfusion was found in regions that appeared anatomically intact, as measured by traditional neuroanatomical imaging (e.g., T1- or T2-weighted clinical MRI). That is, the affected regions retained structural integrity but did not receive adequate CBF to support optimal neural functioning. In the chronic stroke case, Love et al. (2002) termed the anomalous areas ‘functional lesions.’
As well as its importance for cognitive and behavioral function, CBF is also a crucial factor in neuroimaging studies. Many neuroimaging studies with stroke patients have utilized the blood oxygenation level dependent (BOLD) technique (Ogawa et al., 1990; Ogawa et al., 1992). BOLD is sensitive to changes in deoxygenated hemoglobin concentration following local changes in cerebral blood flow (CBF), cerebral blood volume (CBV), and cerebral metabolism, resulting from underlying changes in neural activity (see Buxton, 2002, for review). Interpretation of the BOLD signal is predicated upon a tight neurovascular coupling relationship, such that increasing regional neural activity is closely associated with increasing CBF in that region. Researchers using BOLD imaging typically assume consistent neurovascular coupling across patients and brain regions, and this assumption allows for conclusions to be drawn about underlying regional neural activity based on differences in BOLD signal amplitudes between subject populations or experimental conditions.
The assumption of tight neurovascular coupling may be appropriate for young and healthy individuals, but this assumption is questionable in other populations. For instance, reports indicate that neurovascular coupling may be altered with age, changing the amplitude and shape of the BOLD response, even in healthy aging (Brodtmann et al., 2003; D'Esposito et al., 2003; Huettel et al., 2001). Additionally, delayed or abnormal BOLD responses have been reported in cerebrovascular diseases such as stenosis (narrowing of blood vessels), gradual artery occlusion, and stroke (Bonakdarpour et al., 2007; Carusone et al., 2002; Fridriksson et al., 2006; Roc et al., 2006). Given this evidence, it is reasonable to suggest that assumptions about neurovascular coupling obtained from healthy populations may not be valid in stroke survivors, thus confounding the interpretation of BOLD imaging studies with stroke survivors. Indeed, it is possible that CBF disruptions in patients with cerebrovascular disease underlie an atypical BOLD signal in these participants. If CBF is disrupted in stroke patients, an increase in local neural activity may not be accompanied by a swift regional increase in CBF, thereby leading to the aberrant or delayed BOLD response that has been reported in previous patient studies (e.g. Bonakdarpour et al., 2007; Fridriksson et al., 2006). Thus, commonly held assumptions for BOLD imaging might lead to errant interpretations about the neural underpinnings of cognitive functions in stroke survivors.
In sum, the vital role of CBF in cognition/behavior and in functional neuroimaging studies demands that this neurophysiological factor be a target of study in both acute and chronic stroke survivors for several reasons. First, CBF must be quantified objectively, given evidence that it may be abnormally prolonged in stroke (e.g. Fridriksson et al., 2006; Hillis et al., 2001a; Hillis et al., 2001c). Second, baseline CBF levels must be calculated in standardized units, to both compare these values to healthy controls and to monitor hypoperfusion during stroke recovery (Hillis et al., 2001b). Third, qualitative and quantitative patterns of CBF in stroke survivors must be compared to those of healthy participants, so that neuroimaging studies which rely on CBF as an indirect indicator of neural activity may be mindful of potential confounds in studies of stroke survivors. The current study undertakes this essential investigation of the state of CBF in chronic stroke survivors.
Measuring Cerebral Blood Flow with Perfusion MRI
In order to investigate CBF in chronic stroke survivors, an appropriate methodology is needed. Early studies of CBF were conducted using Positron emission tomography (PET), but the use of radionuclide tracers limits the repeatability of this method due to safety concerns and cost (Chen et al., 2008). CBF has also been studied via dynamic contrast magnetic resonance perfusion-weighted imaging, a technique which measures the arrival rate and clearance of an injected intravenous contrast bolus (see Hillis, 2007); however, like PET, this method is also invasive. More recently, researchers developed new magnetic resonance imaging techniques that allow higher spatial resolution data acquisition and more widespread implementation than that available with previous imaging protocols. Arterial spin labeling (ASL) is an MR methodology for perfusion measurement, in which the blood flowing into the brain is magnetically labeled using a radiofrequency inversion pulse (for a more detailed discussion of ASL, the interested reader is referred to Liu and Brown, 2007). This ‘tagged’ blood serves as a bolus, which is then allowed to flow normally via arterial pathways into brain tissue. At a specified time after the inversion pulse, termed the inversion time (TI), an image is acquired (Figure 1a). A control image in which arterial blood is not ‘tagged,’ or inverted is also acquired in the same spatial location (Figure 1b). The tagged image is subtracted from the control image to remove signal from static tissue. This subtraction leaves an image of the tagged blood that has arrived during time TI, and is weighted both by the local CBF and transit delay values. The time taken by blood in the leading edge of the tagged bolus to reach the neural capillary bed is known as the transit delay. Thus transit delay is a crucial variable to consider in ASL imaging; transit delays should be long enough to allow the tagged arterial bolus to reach and perfuse the capillary bed of the imaging region in order to accurately assess CBF.
Figure 1.

Illustration of a pulsed arterial spin labeling (PASL) perfusion imaging sequence. A radiofrequency pulse inverts the magnetization of inflowing arterial blood (a). This tagged blood flows into the imaging slice over a period of seconds, and an image is acquired. To serve as a control (b), an image is then acquired in the same location, without the use of a tagging pulse to invert the magnetization of blood. Subtraction of control images from tagged images results in an image of only the inflowing tagged blood to the region of interest. Perfusion transit delays (signified by the upward arrows) indicate the amount of time that elapses between tagging inflowing blood and acquiring an image (Illustration courtesy of Patrick J. Lynch, medical illustrator; C. Carl Jaffe, MD, cardiologist).
Given evidence that transit delays may be protracted in the stroke (e.g. Hillis et al., 2001a), one of the aims of our study was to directly examine transit delays in chronic stroke. Transit delays can be measured by a variety of neuroimaging methods; in the current study, a pulsed ASL (PASL) technique called FAIR (flow-sensitive alternating inversion recovery; Kim, 1995; Kwong et al., 1995) was used, with the QUIPSS II modification (Wong et al., 1998) to minimize the transit delay sensitivity of the subtraction image. In this modification, a saturation pulse is applied to the tagging region at time TI1, effectively producing a well-defined bolus of tagged blood of temporal width TI1. The image of the brain region of interest is then acquired at time TI2, where TI2-TI1 should be sufficiently long so as to allow the delivery of the entire tagged bolus to the imaging slices, i.e. longer than the longest transit delay. CBF can then be quantified in neural regions of interest (for a discussion of quantifying CBF with ASL, see Liu and Brown, 2007; Wong, 2005; Wong et al., 1997; Wong et al., 1999).
As discussed above, long transit delays allow the tagged arterial bolus to perfuse the imaging region, yet transit delays should not be so long as to allow a significant loss of signal in the bolus. This can be challenging as typical transit delays in healthy participants (which have been measured to be on the order of 1000 milliseconds or less; (Wong, 2005) vary in different parts of the brain, depending on both the distance from the tagging region as well as vascular anatomy. This challenge becomes even more daunting when implementing perfusion imaging in participants who might have compromised cerebrovasculature, such as stroke survivors. In these cases, it is vital to consider whether these participants' transit delays might be longer than current standard perfusion protocols anticipate, due to altered vascular pathways and collateral perfusion pathways (Liebeskind, 2003). If the TI1 and TI2 values are set such that tagged blood is not allowed adequate time to reach its destination, perfusion imaging will underestimate the true CBF value.
In addition to affecting the accurate quantification of CBF, prolonged transit times may have strong implications for BOLD FMRI imaging, which assumes a tight temporal relationship between underlying neural activity and a rapid cerebrovascular response in a region. Prolonged transit times in chronic cerebrovascular disease may underlie aberrant hemodynamic responses to stimuli during neuroimaging studies if these long transit times lead to a slowed vascular response to neural activity. (e.g. Bonakdarpour et al., 2007; Carusone et al., 2002; Fridriksson et al., 2006; Prabhakaran et al., 2007). This means that neural regions that are recruited during a cognitive task may appear hypoactive in BOLD studies among individuals with cerebrovascular abnormalities, since the BOLD signal is heavily influenced by CBF. Given the influence of transit delay times in CBF quantification, and in BOLD imaging, it is therefore essential to assess transit delay times in chronic stroke survivors and to determine whether transit delays differ between stroke and unimpaired populations.
The aim of the current study was to employ non-invasive ASL-FAIR neuroimaging to determine CBF transit delays and to quantify CBF in chronic stroke survivors, as compared to healthy individuals. The experimental protocol used in this study is described below; Experiment A compared the transit time values in three chronic stroke survivors with varying lesion sizes to those of both young and older unimpaired controls. Experiment B quantified CBF in the same three stroke survivors from Experiment A and a separate group of unimpaired controls using information about transit delays from Experiment A.
Materials and Methods
Experiment A: Transit delay measurement in chronic stroke survivors
Participants
Participants in Experiment A included three stroke survivors (demographics shown in Table 1a), 10 elderly controls (8 female, mean age = 71.1 years, SD = 7.35), and 4 younger controls (2 female, mean age = 26.5 years, SD = 8.38) (control demographics shown in Table 1b). Both young and elderly control participants were recruited from San Diego State University (SDSU) and the University of California, San Diego (UCSD) under both universities' IRB protocols. All participants were deemed qualified to take part in this study if they had no history of prior head injury, were right-handed (handedness defined by 70% right-handed responses to Edinburgh handedness inventory; (Oldfield, 1971), had no reported history of neurological impairments (in the case of stroke survivors, prior to stroke) or significant drug/alcohol abuse and had normal or corrected-to-normal vision and hearing. Participants were compensated for their participation.
Table 1.
a) Demographics of three chronic stroke survivors with aphasia who participated in Experiments A and B: LHD1, LHD2, and LHD3, including clinical symptoms and description of each participant's lesion. b) Demographics of elderly and young control participants who participated in Experiment A and Experiment B.
| Table 1a: Stroke survivor participant demographics. | |||||||||
|---|---|---|---|---|---|---|---|---|---|
| Subject | Experiments in which Ss participated | Gender | Age at testing | Years post onset | Hemiparesis? | Clinical Symptoms | Education | Lesion | Lesion Volume (cc3) |
| LHD1 | A and B | F | 56 | 11 | R weakness | Reading, repetition, comprehension, and naming deficits, moderate oral apraxia and dysarthria, absent neglect or visual agnosia | 12 | L middle and posterior frontal lobe; anterior and middle superior temporal lobe | 112 |
| LHD2 | A and B | M | 45 | 5 | R weakness, leg brace and cane for walking | Word-finding difficulties, articulation and comprehension deficits, moderate oral apraxia without dysarthria, absent neglect or visual agnosia | 17 | L posterior frontal lobe; anterior and medial superior temporal lobe | 96 |
| LHD3 | A and B | M | 68 | 2 | R weakness | Word-finding difficulties, articulation deficit, absent oral apraxia and dysarthria, absent neglect or visual agnosia | 13 | L Inferior Frontal lobe | 57 |
| Table 1b: Healthy control participant demographics. | |||||||||
|---|---|---|---|---|---|---|---|---|---|
| Unimpaired Controls | |||||||||
| Subject | Experiments in which Ss participated | Gender | Age at testing | Education | |||||
| ECA1 | A | F | 71 | 20 | |||||
| ECA2 | A | M | 62 | 18 | |||||
| ECA3 | A | F | 66 | 12 | |||||
| ECA4 | A | F | 66 | 12 | |||||
| ECA5 | A | F | 84 | 16 | |||||
| ECA6 | A | M | 70 | 20 | |||||
| ECA7 | A | F | 62 | 18 | |||||
| ECA8 | A | F | 75 | 12 | |||||
| ECA9 | A | F | 76 | 18 | |||||
| ECA10 | A | F | 79 | 12 | |||||
| YCA1 | A | M | 23 | 16 | |||||
| YCA2 | A | F | 21 | 15 | |||||
| YCA3 | A | F | 23 | 17 | |||||
| YCA4 | A | M | 39 | 19 | |||||
| ECB1 | B | M | 78 | 20 | |||||
| ECB2 | B | M | 69 | 13 | |||||
| ECB3 | B | M | 57 | 16 | |||||
| ECB4 | B | F | 56 | 16 | |||||
| ECB5 | B | M | 61 | 18 | |||||
| ECB6 | B | F | 65 | 16 | |||||
| ECB7 | B | M | 51 | 16 | |||||
| ECB8 | B | M | 59 | 16 | |||||
| ECB9 | B | M | 71 | 18 | |||||
| ECB10 | B | M | 66 | 16 | |||||
| ECB11 | B | F | 69 | 16 | |||||
| ECB12 | B | F | 77 | 18 | |||||
| ECB13 | B | M | 65 | 18 | |||||
| YCB1 | B | F | 23 | 17 | |||||
| YCB2 | B | F | 22 | 16 | |||||
| YCB3 | B | M | 21 | 15 | |||||
| YCB4 | B | F | 23 | 16 | |||||
| YCB5 | B | F | 20 | 15 | |||||
| YCB6 | B | M | 20 | 15 | |||||
| YCB7 | B | F | 24 | 17 | |||||
Stroke survivors were participants in the Cognitive Neuroscience Laboratory (CNL) at SDSU. Stroke survivors were native English speakers with normal or corrected-to-normal auditory and visual acuity for age, negative history of both drug or alcohol dependence and psychiatric disorders (based on self or family report), and were right-handed prior to stroke (according to self or family report). All had left hemisphere damage with a single lesion site, predominantly in frontal lobe regions with some extension into temporal lobe regions (see detailed descriptions of lesion locations below and Table 1a). Stroke survivors each had been diagnosed with aphasia and were enrolled as ongoing participants at the CNL at the time of the current study. Aphasia diagnosis was based on the convergence of clinical consensus and the results of standardized aphasia examinations—the Boston Diagnostic Aphasia Examination (BDAE-version 2; Goodglass and Kaplan, 1972) and the Western Aphasia Battery1 (WAB; Kertesz, 1982). Diagnostic results were consistent with expressive aphasia in these three stroke survivors. LHD1, LHD2, and LHD3 presented to the CNL with clinical symptoms common to left hemisphere frontal lobe stroke; problems included word-finding, articulation, and less obvious comprehension deficits (as measured by the SOAP; Love and Oster, 2002). In addition to aphasic symptomotology, each patient presented with right-lateralized hemiparesis in the hand, arm, and leg. LHD1 and LHD3 were able to walk unaided by assistive devices, and LHD2 used a leg brace and cane for ambulation. LHD1 had moderate oral apraxia and dysarthria; LHD2 had moderate oral apraxia without dysarthria; LHD3 had no signs of oral apraxia or dysarthria. Based on standard assessments, all three stroke survivors were negative for visual agnosia or visual neglect. Clinical symptoms are summarized in Table 1a. While these three participants were commonly enrolled in studies at the CNL due to their aphasia, the purpose of this study was to investigate CBF in chronic stroke survivors. Thus, from this point forward, we do not focus on their aphasic symptoms in particular, nor do we specifically detail the relationship between aphasia and CBF. Rather, the current study aims to present data that addresses the neurophysiological status of CBF in chronic stroke, and we present data from these stroke survivors as representative samples from the chronic stroke population.
Each participant completed a neuroradiological exam during the course of his or her evaluation at the CNL. Anatomical scans were segmented into gray matter, white matter, and CSF for further analyses using FSL (Smith et al., 2004). Structural MRI (Spoiled Gradient Recalled [SPGR]) images demonstrating the main site of lesion for each patient are shown in Figure 2. LHD1's MRI indicated damage to anterior and medial portions of the left hemisphere, including portions of the middle and posterior frontal lobe and superior and middle temporal lobe, with sparing of parts of the posterior superior temporal lobe and most of the inferior temporal gyrus and anterior frontal lobe. LHD2's anatomical MRI indicated damage to the left anterior cortical hemisphere, extending throughout the posterior region of the frontal lobe and anterior and medial portions of the superior temporal lobe, with sparing of parts of the posterior superior temporal lobe and most of the inferior temporal gyrus and the majority of the anterior frontal lobe. LHD3's MRI showed more restricted damage to the left inferior frontal lobe with no temporal involvement. A time-of-flight MR angiogram is also shown for each participant in Figure 2. Each participant demonstrated occlusion in the Left Middle Cerebral Artery territory (indicated by arrow in top row). Lesion volume was calculated by defining the area of the lesion on each patient's structural MRI scan, which was converted to cc3 by multiplying the number of voxels encompassed by the patient's lesion by voxel size. As noted in Table 1a, the volume of these participants' lesions varied, but included large (LHD1), medium (LHD2), and smaller (LHD3) volumes. These patients were therefore included in the study as representatives of stroke survivors with varying lesion volumes.
Figure 2.

Neuroanatomical and Cerebral Blood Flow (CBF) images for each stroke survivor: Column A shows images from participant LHD1, Column B shows images from LHD2, and Column C shows images from LHD3. The top row shows a time-of-flight angiogram for each participant, with occlusion of the Middle Cerebral Artery territory indicated by the arrow in each participant's scan. The second and third rows show high-resolution (1mm isotropic voxels) Spoiled Gradient Recalled (SPGR) images from sagittal and axial viewpoints, respectively. Sagittal views show each participant's left hemisphere as affected by stroke. The bottom row shows whole-brain CBF for each participant (scale shown at bottom).
Procedures for Perfusion Transit Delay Data Acquisition
Neuroimaging data were collected with a General Electric Signa EXCITE 3T scanner (GE, Milwaukee, Wisconsin) fitted with an 8 channel receive-only head coil. A structural imaging scan (SPGR) was acquired with the following parameters: FOV = 25×25 cm, TE = 3.1 ms, T1 = 450 ms, TR = 8.0 ms, flip angle = 12°, voxel size = 1×1×1 mm, slices = 172. Perfusion data were acquired using a pulsed ASL sequence, ASL-FAIR, with scan parameters: TR=3700 ms, TE = 3.1 ms, 17 slices, each 6 mm thick (1 mm gap between slices), number of repetitions = 60, and FOV = 22 cm. Note that the QUIPSS II pulse was switched off for the transit delay data acquisition. For each subject, data were acquired at 8 different TI values: 300, 600, 1000, 1400, 1800, 2200, 2600, and 3000 ms, to allow fitting of the perfusion inflow curve on a voxel-wise basis. Data were fit to the following equations from (Buxton et al., 1998):
Where ΔM(t) is the measured perfusion signal (i.e. surround subtraction of the tag/control image series; Liu and Wong, 2005), M0b is the equilibrium magnetization of blood, α is the inversion efficiency (assumed to be 1), τ is the temporal width of the bolus, and T1b is the T1 of arterial blood, assumed to be 1.664 s (Lu et al., 2004). Data were fit for transit delay (TD) and bolus width (τ). Data processing was performed in MATLAB® using software written in-house.
Results: Experiment A
Healthy control participants
Results from transit delay imaging are shown in Table 2. Mean transit delay values for gray matter are significantly higher in the elderly (mean 809 ms) as compared to young control group (mean 567 ms) (t(12) = 2.85, p < .01). Importantly, there is no significant difference in variance between elderly (SD = 138 ms) and young controls (SD = 156ms) (F(9, 3) = .77, p > .05). These mean transit delay values are used to set appropriate QUIPSS II parameters for quantitative CBF measurement in Experiment B.
Table 2.
Transit delays for LHD1, LHD2, and LHD3, and for elderly and young control participants. Whole-brain transit delay means for gray matter and standard deviations are shown.
Transit delay means (standard deviation in parentheses).
| LHD1 | LHD2 | LHD3 | Young Controls | Elderly Controls | |
|---|---|---|---|---|---|
| Transit Delay mean (ms) | 749 | 1117 | 890 | 567 | 809 |
| Transit Delay Standard Deviation (ms) | 422 | 508 | 525 | 156 | 138 |
Stroke survivors
Results from transit delay imaging are shown in Table 2. LHD1's data indicated a mean transit delay of 749 ms with a standard deviation of 422ms in gray matter throughout the brain. A Crawford t-test (Crawford and Garthwaite, 2005) was used to compare data between each aphasic participant and each group of unimpaired control participants. The Crawford t-test of mean transit delays in gray matter demonstrated no significant differences between LHD1 and young controls (t(3) = 1.03, p > .05) or between LHD1 and elderly controls (t(9) = -.41, p > .05). Additionally, a t-test of the standard deviations of transit delays showed no differences between LHD1 and young controls (t(3) = 1.35, p > .05) or between LHD1 and elderly controls (t(9) = .46, p > .05). This second comparison of standard deviations was performed due to the markedly greater standard deviation in all our stroke survivors, as compared to both young and elderly controls.
By contrast, LHD2's data revealed that his transit delay mean was 1117 ms with a standard deviation of 508 ms in gray matter throughout the brain. A Crawford t-test of mean transit delays in gray matter revealed a significant difference between LHD2 and young controls (t(3) = 3.14, p < .05) and between LHD2 and elderly controls (t(9) = 2.13, p < .05). Additionally, a t-test of the standard deviations of transit delays showed differences between LHD2 and both young controls (t(3) = 2.33, p < .05) and between LHD2 and elderly controls (t(9) = 2.01, p < .05).
The mean transit delay of LHD3 was 890 ms with a standard deviation of 525 ms throughout gray matter. While a Crawford t-test of mean transit delays in gray matter revealed no significant difference between LHD3 and young controls (t(3) = 1.84, p > .05) or between LHD3 and elderly controls (t(9) = .55, p > .05), a t-test of the transit delay standard deviations did reveal significant differences between LHD3 and young controls (t(3) = 2.53, p = .05) and between LHD3 and elderly controls (t(9) = 2.32, p < .05). These findings crucially indicate that although LHD3's mean transit delays are comparable to both control groups, this stroke survivor shows a much greater amount of variability than his healthy peers, a result that is not particularly surprising in a chronic stroke survivor.
Experiment B uses the transit delay results to set appropriate scanning parameters for the acquisition of quantitative whole-brain perfusion data from healthy controls as well as the three stroke survivors, allowing the investigation of CBF levels globally and within regions of interest.
Experiment B: Perfusion Measurement
Given prior research suggesting that CBF levels may be related to cognitive and behavioral deficits in acute and chronic stroke survivors (Hillis et al., 2001c; Love et al., 2002), Experiment B sought to quantify CBF levels throughout the brains of stroke survivors with chronic aphasia in comparison to a set of healthy control subjects. As discussed earlier, for reliable perfusion imaging using a PASL sequence with the QUIPSS II modification, it is vital that the imaging parameters TI1 and TI2 are chosen appropriately such that the entire tagged bolus of blood is given time to arrive in the imaging slices before image acquisition (Wong, 2005). In our chronic stroke patients, the explicit measurement of transit delays in Experiment A enables appropriate setting of TI1 and TI2 acquisition parameters for each subject.
Participants
Experiment B enrolled the same three stroke survivor participants as Experiment A, as well as seven different young unimpaired controls (5 female, mean age = 22, SD = 1.5), and 13 elderly unimpaired controls (4 female, mean age = 64.9, SD = 8.03) (demographics shown in Table 1b).
Perfusion Data Acquisition with Optimal Scanning Parameters
In line with previous studies, TI1 was set to 600ms for all subjects (Wong et al., 1998), and TI2 values were then selected based on the transit delay measurements of Experiment A, with the aim of satisfying the criteria that [TI2-TI1] should ideally be longer than the longest transit delay. However, the selection of a TI2 value involves a compromise between ensuring sufficient time for inflow of the tagged blood into the imaging slices (favoring a long TI2), and avoiding extensive loss of the ‘tag’ by T1 decay (favoring a short TI2).
For the young and elderly control subjects, TI2 was set to 1600 ms, since the transit delay results indicated that 1000 ms is sufficient for the delivery of the entire bolus of tagged blood to the majority of voxels. This is in good agreement with earlier research (Wong et al., 1998).
Each of the three stroke survivors were considered individually. Given that LHD1's transit delays were not significantly different from those of either control group, the same TI2 was used with this participant as with the controls. By contrast, LHD2 demonstrated significantly longer transit delays and larger standard deviation than either control group, and LHD3 demonstrated transit delay means that did not differ significantly from either control group, but did show a significantly larger amount of variability in transit delay times than either control group. Thus, to select TI2 times for LHD2 and LHD3 that were long enough to appropriately accommodate their transit delay results, while still trying to keep TI2 as short as possible to avoid loss of the ‘tag’ due to T1 decay, TI2 times were set by adding the TI1 value (600 ms) to the sum of each participant's mean transit delay and standard deviation. This allowed us to incorporate information about how much transit delay means deviated from healthy populations, while also attempting to keep TI2 reasonably short. Bearing these issues in mind, the following TI2 values were selected for the FAIR-QUIPSS II experiment: for LHD1, TI2 = 1600ms, for LHD2, TI2 = 2300ms, and for LHD3, TI2 = 2000ms.
Data were acquired using the same scanner used to collect the transit delay data. A FAIR-QUIPSS II sequence was employed with the following parameters: TR=3000 ms, TE = 3.1 ms, TI1 (i.e. QUIPSS II saturation pulse) = 600 ms (following Wong et al., 1998), 18 slices, each 6 mm thick (1 mm gap between slices), and FOV = 22 cm. There were 40 repetitions for TI2 values of 1600ms, and 100 repetitions for TI2 values of 2000 and 2300 ms (due to lower SNR for these higher TI2 values).
Each participant also underwent a high-resolution anatomical scan with the same SPGR parameters as Experiment A. Anatomical scans were segmented into gray matter, white matter, and CSF using FSL (Smith et al., 2004). Perfusion data were analyzed within gray matter using MATLAB® and were overlaid onto each participant's anatomical scan using AFNI software (Cox, 1996). In addition, a cerebral spinal fluid (CSF) scan and a minimum contrast scan were acquired for use in CBF quantification (see below). The CSF scan consisted of a single scan acquired at full relaxation (no inversion or saturation pulses), using the same slice prescription as the ASL scan and TE=3.1 ms. The minimum contrast scan was acquired with TR=2 s, TE=11 ms to achieve little contrast between gray matter, white matter and CSF. Two 8-interleave scans were acquired using the same slice prescription as the CSF scan.
Quantification of CBF
The FAIR-QUIPSS II data were used to compute a perfusion map by first taking the surround subtraction of the tag/control image series (Liu and Wong, 2005) and then averaging these data over all time points (repetitions) for each voxel. These maps were then corrected for inhomogeneities in the coil sensitivity profiles using the smoothed minimum contrast images (Wang et al., 2005) and subsequently converted to absolute units (ml/100ml/min) using the signal from the lateral ventricles on the CSF image as a reference signal (Chalela et al., 2000).
During the quantification of CBF for the stroke survivors, data from any neural tissue deemed within the lesion boundaries was excluded from the whole brain analysis. CBF levels were quantified for each participant at the whole-brain level, and within left and right cortical hemispheres (again, not including lesion site among stroke survivors). We also were interested in exploring the cortical tissue bordering the lesion site, as numerous studies have implicated this region in (a) spontaneous recovery post stroke (Furlan et al., 1996), (b) the site with the potential for recovery via treatment thus rendering it the target for interventional therapy (Baron, 2001; Heiss, 2000) and (c) in some cases, spreading depression negatively affecting recovery (Selman et al., 2004). Given that studies from the acute stroke literature have noted that this region, referred to as the penumbra (see Fisher and Ginsberg, 2004; Hillis, et al., 2000), may be particularly susceptible to variations in blood flow, we present calculated CBF within each survivor's penumbra in addition to other regional measurements.
Definition of the penumbra in stroke survivors
To systematically define the penumbra, lesion borders were outlined for each patient using his or her anatomical MRI. Next, a 2 voxel mask was delineated around the borders of the lesion, to define a penumbra region. Voxel size was dictated by the CBF data from the ASL - scan parameters, and measured 3.44mm in the right-left direction, 3.44mm in the anterior-posterior direction, and 6.94mm in the inferior-superior direction. Thus each 2 voxel mask extended outwards from lesion boundaries by 6.88 mm in the right-left direction, 6.88 mm in the anterior posterior direction, and 13.88 mm in the inferior-superior direction (Figure 3a). Each patient's penumbra mask was copied and transposed to the right hemisphere (Figure 3b) to examine within-brain CBF relationships in these regions of interest.
Figure 3.
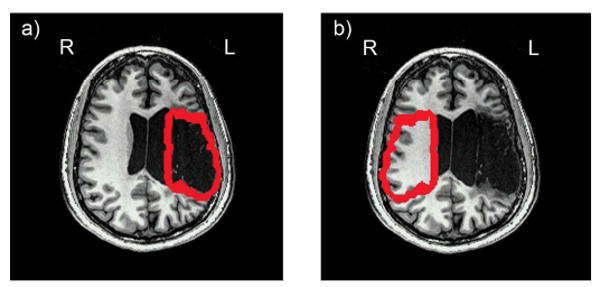
An example of the a) left and b) right hemisphere penumbra mask regions, illustrated with participant LHD2's data. Left hemisphere penumbra regions were defined by outlining the borders of each stroke survivor's lesion and creating a 2 voxel border around the lesion. Right hemisphere mask regions were created by copying the mask from the left hemisphere and transposing it into the homologous region of the right hemisphere. Penumbra masks were equivalent across participants for extent from the lesion (6.88 mm in the right-left direction, 6.88 mm in the anterior posterior direction, and 13.88 mm in the inferior-superior direction) and were equivalent within participants across hemispheres for anatomical location.
Results: Experiment B
Healthy control participants
Results from CBF quantification in young and elderly controls are shown in Table 3, including CBF means and standard deviations of each group. Mean CBF values for gray matter are significantly higher in the young vs. elderly control group at whole-brain (t(6) = 3.97, p < .005), left hemisphere (t(6) = 3.76, p < .01), and right hemisphere (t(6) = 4.02, p < .005). The literature indeed concurs with these findings; gray matter atrophy even in healthy aging has been associated with longer transit delays and lower levels of CBF (Asllani et al., 2009; Parkes et al., 2004).
Table 3.
CBF values (mL blood/ 100g tissue/ minute) for gray matter at whole-brain, hemispheric, and penumbra levels are shown for each stroke survivor participant. Data for young controls consists of mean CBF rates for whole-brain and hemispheric measurements. CBF ratios between left and right hemispheres (hemispheric CBF ratios) are shown for stroke survivors and young controls, and ratios between penumbra regions in the left hemisphere and a comparable region in the right hemisphere (penumbra CBF ratios) are shown for stroke survivors only. Paired t-tests are shown for within-brain comparisons of all stroke survivors between: left vs. right hemisphere, and the 2 voxel peri-lesional region vs. the homologous region in the right hemisphere.
CBF quantification results
| LHD1 | LHD2 | LHD3 | Young Controls | Elderly Controls | |
|---|---|---|---|---|---|
|
Global CBF Mean (SD) (ml/100ml/min) |
26.9 (32.1) | 43.6 (44.1) | 28.4 (41.4) | 71.1 (18.9) | 37.8 (6.1) |
|
Left Hemisphere CBF Mean (SD) |
23.5 (31.4) | 35.3 (44.4) | 25.6 (43.3) | 61.8 (47.4) | 39.1 (5.7) |
|
Right Hemisphere CBF Mean (SD) |
29.3 (32.4) | 46.3 (44.4) | 30.9 (39.4) | 56.9 (47.4) | 37.1 (6.4) |
|
T-test results: Left Hemisphere vs. Right Hemisphere CBF |
p < .0001 | p < .0001 | p < .0001 | p < .02 | p < .02 |
|
Left Hemisphere/Right Hemisphere CBF Ratio |
0.80 | 0.76 | 0.82 | 1.08 | 1.06 |
|
Left Hemisphere Penumbra CBF Mean |
12.7 (27.8) | 26.8 (44.9) | 22.8 (59.5) | -- | -- |
|
Right Hemisphere Penumbra CBF Mean |
22.3 (32.0) | 43.2 (45.5) | 33.9 (51.7) | -- | -- |
|
T-test results: Left Hemisphere Penumbra vs. Right Hemisphere Penumbra CBF |
p < .0001 | p < .0001 | p < .0001 | -- | -- |
|
Left Hemisphere Penumbra/Right Hemisphere Penumbra CBF Ratio |
0.57 | 0.61 | 0.67 | -- | -- |
Stroke survivors
CBF quantification results from stroke survivors are illustrated in Figure 2 (bottom row), which shows representative axial images of each patient's CBF maps, calculated from the FAIR-QUIPSS II data. Regions of relative hypoperfusion are visually evident throughout the left hemisphere, particularly within peri-lesional penumbra regions, as compared to each participant's CBF in the right hemisphere. Table 3 shows mean global (whole-brain), left hemisphere, and right hemisphere gray matter CBF values for all participants (inclusive of penumbra regions in stroke survivors), as well as CBF values within each stroke survivor's left hemisphere penumbra and right hemisphere homologous regions. Data for young controls consists of mean gray matter CBF rates for whole-brain and hemispheric measurements.
To examine trends of CBF levels in stroke survivors and unimpaired controls, CBF ratios were calculated and are shown in Table 3. As is commonly used in the acute stroke literature (similar to Fridriksson et al., 2002) perfusion ratios may be employed to compare CBF at an inter-hemispheric level in acute stroke. These ratios can help characterize the severity of hypoperfusion in the affected hemisphere, using the patient's undamaged cortical hemisphere as a within-participant control. CBF ratios clearly indicate that both young and elderly control participants show comparable levels of CBF in both hemispheres, with a slight left hemisphere bias (young controls' average ratio = 1.08, elderly controls' average ratio = 1.06), whereas the stroke survivors show moderate degrees of right hemisphere CBF bias: LHD1's ratio = .80, LHD2's ratio = .76, LHD3's ratio = .82 (Note, all hemispheric CBF values for stroke survivors include data from the penumbra region). These data indicate chronic left hemisphere hypoperfusion in each of these three participants, an expected finding given their cerebrovascular disorders.
Ratios of each stroke survivor's CBF levels within the 2-voxel lesion penumbra and within the homologous region in the contralateral hemisphere are also shown in Table 3. (LHD1's ratio = .57, LHD2's ratio = .61, LHD3's ratio = .67). It is noteworthy that the discrepancy in CBF between left and right hemisphere penumbra regions is more exaggerated than inter-hemispheric CBF differences in these stroke survivors. The fact that these ratios are lower than those of whole-hemisphere CBF levels indicates more pronounced hypoperfusion within the penumbra region of each stroke survivor.
T-tests were performed on each stroke survivor's data, examining differences in CBF between the left and right hemispheres, and between the left hemisphere peri-lesional region and the right hemisphere homologous region. Results for participant LHD1 indicated significantly greater right hemisphere CBF than left hemisphere CBF (t (4756) = 4.86, p < .0001) and significantly greater CBF within the right hemisphere peri-lesional homologue area as compared to the left hemisphere peri-lesional area (t (1784) = 9.61, p < .0001). Results for participant LHD2 indicated significantly greater right hemisphere CBF than left hemisphere CBF (t (6921) = 9.95, p < .0001) and significantly greater CBF within the right hemisphere peri-lesional homologue area as compared to the left hemisphere peri-lesional area (t (1813) = 16.44, p < .0001). Results for participant LHD3 indicated significantly greater right hemisphere CBF than left hemisphere CBF (t (8506) = 5.31, p < .0001) and significantly greater CBF within the right hemisphere peri-lesional homologue area as compared to the left hemisphere peri-lesional area (t (1558) = 11.18, p < .0001).2 Implications of this hypoperfusion will be discussed below.
Discussion
The application of arterial spin labeling methods in this experiment demonstrated several important and previously unreported findings in chronic stroke survivors. In Experiment A, we used ASL to investigate CBF transit delay times in three chronic stroke survivors and compared their results with two groups of unimpaired control participants - young and elderly. In examining the control groups, we note that elderly controls exhibited significantly longer transit delay times in gray matter than their younger counterparts, although variability between these control groups was not significantly different. The longer transit delays are likely related to the significantly lower mean gray matter CBF in the elderly vs. the young controls, a finding which probably reflects some level of gray matter atrophy in the elderly control group (Asllani et al., 2009; Vernooij et al., 2008). However most prior reports of arterial spin labeling perfusion MRI use TI1 and TI2 values that would minimize transit delay sensitivity for all control participants (Brown et al., 2007; Hendrikse et al., 2004; Wong, 2005).
When we compared our three chronic stroke survivors to each control group, the data revealed protracted transit delays in one of our stroke survivors and significantly greater transit delay variability in another stroke survivor. LHD2 and LHD3 showed transit delay patterns that were significantly different from the patterns of both control groups, likely related to these patients' compromised cerebrovascular systems. The differences we observed in transit delays between LHD2 and LHD3 as compared to older control participants demonstrated that longer transit delays and larger amounts of variability in transit delays among these stroke survivors are due to factors other than just increased age. Results from Experiment A therefore demonstrate the importance of determining individual transit delay times for participants with compromised cerebrovasculature before collecting CBF data for quantification or other purposes.
To our knowledge, the findings from Experiment A contribute the first quantitative report of baseline CBF transit delays using ASL-FAIR techniques with chronic stroke survivors. The general findings from Experiment A offer converging evidence with previous reports of slowed hemodynamic responses in participants with cerebrovascular diseases (Bonakdarpour et al., 2007; Carusone et al., 2002; Fridriksson et al., 2006; Roc et al., 2006). Bonakdarpour et al., Carusone et al., and Roc et al. present evidence of delayed BOLD responses in participants with compromised cerebrovascular systems; our results which indicate prolonged CBF transit delays suggest that baseline hemodynamic irregularities may at least partially account for these aberrant BOLD results.
Experiment B used the transit delay data from Experiment A to select appropriate, personalized scan parameters for quantitative CBF scans in our stroke survivor participants. Given data from Experiment A that indicated abnormally long mean transit delays and/or an abnormally large amount of transit delay variability for stroke survivors LHD2 and LHD3, we selected TI2 values, of 2300ms and 2000ms, respectively, for acquisition of whole-brain FAIR-QUIPSS II data for CBF quantification. LHD1's data from the first experiment suggested an optimal TI2 of 1600ms for CBF data collection in this participant, which was the value used for the unimpaired control participants.
Such personalization of transit delay times during CBF data acquisition was necessary to ensure that the bolus of tagged blood had adequate time to reach neural tissue, thereby allowing us to collect cerebral perfusion data while controlling for the potentially confounding factor of extended transit delays. Had whole-brain perfusion imaging been performed with LHD2 and LHD3 with a more typical (and shorter) 1600ms TI2 that is typically used for unimpaired participants, the data would have underestimated CBF. An underestimation of CBF in some neural regions might have led us to conclude that these participants exhibited hypoperfusion in neural areas that in fact had extended transit delays.
Crucially, despite the use of carefully chosen ASL scan parameters in Experiment B, quantified CBF levels in each stroke survivor still indicated hypoperfusion in structurally intact portions of the left hemisphere. We note that hypoperfusion was observed in areas throughout the left cerebral hemisphere of each stroke survivor, yet this hypoperfusion was most dramatic in peri-lesional regions. CBF ratios of the entire left hemisphere to the entire right hemisphere (‘hemispheric CBF ratios’) demonstrated lower CBF within the intact portions of the insulted left hemisphere as compared to the intact right hemisphere. These results sharply contrasted with hemispheric CBF ratios from a group of unimpaired young controls, who showed an average CBF ratio of approximately 1, with comparable CBF values in left and right hemispheres. This discrepancy in hemispheric CBF ratios between stroke survivors and young controls indicates chronic hypoperfusion throughout the structurally intact portions of the left hemisphere in each of the stroke survivors.
A particularly interesting finding in Experiment B concerns perfusion patterns in our chronic stroke participants within the peri-lesional region, known as the penumbra. The acute/sub-acute stroke literature frequently relies on CBF data from the penumbra region to assess whether this neural tissue will remain viable or progress to infarct in the hours following stroke onset (Fisher and Ginsberg, 2004; Schaefer et al., 2003). As a reminder, this region has been linked in the acute stroke population to spontaneous recovery, has been the site of targeted intervention therapies, and has also been cited as a source of spreading depression which has been linked to a failure in recovery (Baron, 2001; Furlan et al., 1996; Heiss, 2000; Selman et al., 2004) Here, we find that pronounced hypoperfusion remains in the penumbra, even in the chronic stage of stroke, in the years post-onset. The finding of chronic penumbra hypoperfusion leads to the conclusion that this region of neural tissue need not be re-perfused to healthy levels (i.e. levels found in the intact right hemisphere) to remain neuroanatomically intact. Indeed, CBF ratios between the left hemisphere penumbra and a homologous region in the unaffected right hemisphere (‘penumbra CBF ratios’) showed more profound levels of hypoperfusion than whole-hemisphere level CBF ratios. Thus, chronic hypoperfusion may occur to variable degrees within the damaged hemisphere of stroke survivors, and hypoperfusion may be more pronounced within the neural regions directly surrounding chronic infarct territory.
We note that hypoperfusion in our stroke survivors may be related to chronic occlusion of arterial pathways in the MCA territory and perfusion via collateral arterial channels (Derdeyn et al., 1999; Hendrikse et al., 2004; Liebeskind, 2003; Wityk et al., 2002). It is possible that stroke survivors who experience greater levels of recanalization of arterial occlusion may not demonstrate hypoperfusion to the same extent as was observed in the current study (Schellinger et al., 2000; Soares et al., 2009). The relationship between degree of arterial occlusion and recanalization and hypoperfusion should be further investigated in chronic stroke.
Hypoperfusion and Lesion Size
The relationship between a participant's lesion size and penumbra CBF ratio is particularly noteworthy. Participant LHD1 had the largest lesion among stroke survivors in this study and also showed the lowest penumbra CBF ratio, while participant LHD3 had the smallest lesion and showed the highest penumbra CBF ratio. We reiterate our analysis methods, which examined average CBF in the penumbra area and within-participant ratios of CBF between the lesion penumbra and each participant's intact hemisphere. None of our analyses depended on the absolute amount of intact cortical tissue in any participants. We therefore strongly feel that evidence for reduced perfusion in LHD1 as compared to LHD3 is not solely due to a smaller volume of intact left hemisphere cortical tissue in LHD1. We contend that data from these two participants appear to support an inverse relationship between lesion size and penumbra CBF ratio. Future research with a larger sample size is required to more thoroughly explore the nature of any relationship between lesion size and cerebral perfusion.
Hypoperfusion and Aphasia Severity
While the main purpose of the current study was not to examine brain-behavior relationships between CBF and cognitive deficits, we do wish to note a relationship between CBF and cognitive symptomotology in our chronic stroke survivors. All three of our stroke survivors were diagnosed with varying severity levels of expressive aphasia. The results from Experiment B indicated that all three stroke survivors, despite their varying language deficits, exhibited comparable hemispheric CBF ratios. By contrast, we see a trend towards an inverse relationship between penumbra CBF ratio and aphasia severity: LHD1, who showed the most severe aphasic profile also showed the lowest penumbra CBF ratio, while LHD3, who showed the least severe aphasic profile showed the highest penumbra CBF ratio. LHD2, who showed an aphasic profile with a severity level that fell between those of LHD1 and LHD3, also showed a penumbra CBF ratio that fell between these two participants. While we acknowledge that the use of global measurements of perfusion like hemispheric or penumbra CBF ratios cannot fully detail the neurophysiological markers that contribute to a focal disorder like aphasia, this finding is intriguing and the relationship between regional CBF and cognitive deficits in stroke should be explored further in future research. Greater detail about the nature of CBF in stroke survivors may be greatly beneficial to understanding the behavioral consequences of regional hypoperfusion, and such an investigation may elucidate some of the variability in this population.
Implications for Neuroimaging
Chronic hypoperfusion as demonstrated in Experiment B has strong implications for the ways in which contemporary neuroimaging protocols are structured. While the precise mechanisms underlying the BOLD signal are still under investigation (Buxton, 2002), the signal represents the combination of the vascular and metabolic responses to activation. It is therefore likely that both hypoperfusion and extended transit delays in intact neural tissue will affect the BOLD signal during FMRI studies with stroke survivors. Despite this, relatively little research has investigated the neurophysiological consequences of chronic stroke on the BOLD signal. A study by Krainik et al. (2005), however, found decreased BOLD signal amplitude in sensorimotor and supplementary motor cortices of the stroke-damaged hemispheres, as compared to the undamaged hemispheres, of chronic stroke survivors (approximately 1-7 years post-onset) during a manual task. Importantly, the authors note that these neural regions were structurally intact among stroke survivors. From the results presented in the current study, it can be postulated that hypoperfusion of the structurally intact sensorimotor and supplementary motor cortices of the stroke survivors in Krainik et al.'s paper might explain their findings of reduced BOLD signal in these areas relative to the contralateral hemisphere. Similarly, a study by Prabhakaran et al. (2007) demonstrated reduced BOLD signal in hypoperfused cortical regions of chronic stroke survivors during a verbal fluency task. Chronic hypoperfusion may therefore account for or contribute to variability in the functional neuroimaging literature of stroke survivors (Calautti and Baron, 2003; Cherney and Small, 2006; Heiss et al., 1999; Ward et al., 2003) given the reliance on the BOLD signal as an indicator of underlying neural activity. The present findings of hypoperfusion and prolonged transit delays in stroke survivors suggest that baseline CBF is compromised in these participants, thus potentially confounding BOLD studies that do not simultaneously measure CBF in this population.
While a good deal of research has investigated perfusion in acute and sub-acute stroke patients (e.g. Hillis et al.,, 2001a; Hillis et al.,, 2001c), the current study is one of very few studies to extend the study of CBF and hypoperfusion to chronic stroke. Our findings indicate that hypoperfusion may be an enduring, not naturally resolving feature of chronic stroke, the implications of which must be further studied. Future research with chronic stroke survivors should examine the correlations between behavioral/cognitive deficits and hypoperfusion, as has been done in the sub-acute and acute stroke literature. This is vital because we cannot assume that the relationship between hypoperfusion and cognition is the same in chronic vs. acute/sub-acute stroke survivors. It is well known that neural reorganization may occur following damage to neural tissue during stroke; therefore, a thorough investigation of the interplay between behavior/cognition, hypoperfusion, and neural reorganization in chronic stroke is needed. The present findings also extend the results from Love et al. (2002) who reported chronic hypoperfusion in a stroke survivor 16 years post-onset. However, the present study uses novel paradigms to measure transit delays and then incorporates these results to the parameters used for CBF data acquisition. These two components allow more precise and localized quantification of hypoperfusion in chronic stroke than previously employed methods.
Results from the current study call for additional investigation into the nature of the neurovascular system in populations with compromised cerebrovasculature. Increased CBF transit delay times and hypoperfusion in chronic stroke survivors may have consequences for both behavioral and neuroimaging research within this population. Researchers using neuroimaging protocols with participants who have cerebrovascular diseases may draw misleading conclusions about underlying neural activity unless the altered vascular dynamics are taken into account. As demonstrated in the current study, significant adjustment of scanning parameters can be required when patients with cerebrovascular abnormalities are studied. Further research into the nature of CBF and cognitive functioning in stroke survivors is therefore needed to elucidate the complex interplay between neural activity, cerebrovascular status, and cognition in this population. Future studies should also investigate how CBF contributes to variability in both behavioral and neuroimaging studies in order to better understand and conduct such studies across multiple populations.
Acknowledgments
We thank all participants and their families. We also thank Frances Cho and Mary Vertinski for their assistance with this project. This work was supported by the National Institutes of Health T3DC007361 (KPB), R01DC003681, R01DC009272 (TL), National Sleep Foundation Pickwick Fellowship (LA), and the Stein Institute for Research on Aging Junior Faculty Grant (LA).
Footnotes
Studies were conducted under the approval of local Institutional Review Boards (at San Diego State University and the University of California, San Diego), with full understanding and consent of each participant, in compliance with HIPAA mandates.
The WAB aphasia quotients and BDAE severity scores, respectively, were as follows: LHD1-59.1, 1; LHD2-72.7, 2; LHD3-75.3, 3.5. The WAB aphasia quotient uses a scale from 0-100, with higher numbers indicating less aphasic impairment; a score above 93.8 is considered normal. The BDAE severity level is based on a scale from 1-5, with higher numbers indicating less aphasic impairment; for example, a score of 5 denotes “minimal discernable speech handicaps” and “subjective difficulties” of the patient.
All t-test results for stroke survivors remained statistically significant (p<.05, uncorrected) when only voxels were considered which fulfilled the following criteria: TI2-TI1 > transit delay. For example, for participant LHD1, this calculation resulted in a CBF map of voxels whose transit delay values were equal to or less than 1000ms (calculated by subtracting the TI1 of 600ms from the TI2 of 1600ms).
Publisher's Disclaimer: This is a PDF file of an unedited manuscript that has been accepted for publication. As a service to our customers we are providing this early version of the manuscript. The manuscript will undergo copyediting, typesetting, and review of the resulting proof before it is published in its final citable form. Please note that during the production process errors may be discovered which could affect the content, and all legal disclaimers that apply to the journal pertain.
References
- Asllani I, Habeck C, Borogovac A, Brown TR, Brickman AM, Stern Y. Separating Function From Structure in Perfusion Imaging of the Aging Brain. Hum Brain Mapp. 2009;30:2927–2935. doi: 10.1002/hbm.20719. [DOI] [PMC free article] [PubMed] [Google Scholar]
- Astrup J, Symon L, Branston N, Lassen N. Cortical evoked potential and extracellular K+ and H+ at critical levels of brain ischemia. Stroke. 1977;8:51–57. doi: 10.1161/01.str.8.1.51. [DOI] [PubMed] [Google Scholar]
- Baron JC. Perfusion Thresholds in Human Cerebral Ischemia: Historical Perspective and Therapeutic Implications. Cerebrovasc Dis. 2001;11:2–8. doi: 10.1159/000049119. [DOI] [PubMed] [Google Scholar]
- Bonakdarpour B, Parrish TB, Thompson CK. Hemodynamic response function in patients with stroke-induced aphasia: Implications for FMRI data analysis. Neuroimage. 2007;36:322–331. doi: 10.1016/j.neuroimage.2007.02.035. [DOI] [PMC free article] [PubMed] [Google Scholar]
- Brodtmann A, Puce A, Syngeniotis A, Darby D, Donnan G. The functional magnetic resonance imaging hemodynamic response to faces remains stable until the ninth decade. Neuroimage. 2003;20:520–528. doi: 10.1016/s1053-8119(03)00237-4. [DOI] [PubMed] [Google Scholar]
- Brown GG, Clark C, Liu TT. Measurement of cerebral perfusion with arterial spin labeling: Part 2. Applications J Int Neuropsychol Soc. 2007;13:1–13. doi: 10.1017/S1355617707070634. [DOI] [PMC free article] [PubMed] [Google Scholar]
- Buxton R. Introduction to Functional Magnetic Resonance Imaging: Principles and Techniques. Cambridge University Press; Cambridge: 2002. [Google Scholar]
- Buxton RB, Frank Lawrence R, Wong EC, Siewert B, Warach S, Edelman RR. A general kinetic model for quantitative perfusion imaging with arterial spin labeling. Magnetic Resonance in Medicine. 1998;40:383–396. doi: 10.1002/mrm.1910400308. [DOI] [PubMed] [Google Scholar]
- Calautti C, Baron JC. Functional Neuroimaging Studies of Motor Recovery After Stroke in Adults: A Review. Stroke. 2003;34:1553–1566. doi: 10.1161/01.STR.0000071761.36075.A6. [DOI] [PubMed] [Google Scholar]
- Carusone LM, Srinivasan J, Gitelman DR, Mesulam MM, Parrish TB. Hemodynamic Response Changes in Cerebrovascular Disease: Implications for Functional MR Imaging. Am J Neuroradiol. 2002;23:1222–1228. [PMC free article] [PubMed] [Google Scholar]
- Chalela JA, Alsop DC, Gonzalez-Atavales JB, Maldjian JA, Kasner SE, Detre JA. Magnetic Resonance Perfusion Imaging in Acute Ischemic Stroke Using Continuous Arterial Spin Labeling. Stroke. 2000;31:680–687. doi: 10.1161/01.str.31.3.680. [DOI] [PubMed] [Google Scholar]
- Chen JJ, Wieckowska M, Meyer E, Pike GB. Cerebral Blood Flow Measurement Using fMRI and PET: A Cross-Validation Study. International Journal of Biomedical Imaging. 2008;2008:1–12. doi: 10.1155/2008/516359. [DOI] [PMC free article] [PubMed] [Google Scholar]
- Cherney LR, Small SL. Task-dependent changes in brain activation following therapy for nonfluent aphasia: Discussion of two individual cases. J Int Neuropsychol Soc. 2006;12:828–842. doi: 10.1017/S1355617706061017. [DOI] [PubMed] [Google Scholar]
- Cox RW. AFNI: Software for analysis and visualization of functional magnetic resonance neuroimages. Computers and Biomedical Research. 1996;29:162–173. doi: 10.1006/cbmr.1996.0014. [DOI] [PubMed] [Google Scholar]
- Crawford J, Garthwaite P. Testing for suspected impairments and dissociations in single-case studies in neuropsychology: Evaluation of alternatives using Monte Carlo simulations and revised tests for dissociations. Neuropsychology. 2005;19:318–331. doi: 10.1037/0894-4105.19.3.318. [DOI] [PubMed] [Google Scholar]
- D'Esposito M, Deouell LY, Gazzaley A. Alterations in the bold fMRI signal with ageing and disease: A challenge. Nat Rev Neurosci. 2003;4:863–872. doi: 10.1038/nrn1246. [DOI] [PubMed] [Google Scholar]
- Derdeyn CP, Videen TO, Fritsch SM, Carpenter DA, Grubb RL, Powers WJ. Compensatory Mechanisms for Chronic Cerebral Hypoperfusion in Patients With Carotid Occlusion. Stroke. 1999;30:1019–1024. doi: 10.1161/01.str.30.5.1019. [DOI] [PubMed] [Google Scholar]
- Detre JA. MR Perfusion Imaging of Hyperacute Stroke. Am J Neuroradiol. 2001;22:806–807. [PMC free article] [PubMed] [Google Scholar]
- Fisher M, Ginsberg M. Current Concepts of the Ischemic Penumbra: Introduction. Stroke. 2004;35:2657–2658. [Google Scholar]
- Fridriksson J, Holland AL, Coull BM, Plante E, Trouard TP, Beeson P. Aphasia severity: Association with cerebral perfusion and diffusion. Aphasiology. 2002;16:859–871. doi: 10.1080/02687030244000347. [DOI] [PMC free article] [PubMed] [Google Scholar]
- Fridriksson J, Rorden C, Morgan PS, Morrow KL, Baylis GC. Measuring the Hemodynamic Response in Chronic Hypoperfusion. Neurocase. 2006;12:146–150. doi: 10.1080/13554790600598816. [DOI] [PubMed] [Google Scholar]
- Furlan MM, Gilles Viader F, Derlon JM, Baron JC. Spontaneous Neurological Recovery after Stroke and the Fate of the Ischemic Penumbra. Ann Neurol. 1996;40:216–226. doi: 10.1002/ana.410400213. [DOI] [PubMed] [Google Scholar]
- Goodglass H, Kaplan E. Boston diagnostic aphasia examination. Lea & Febiger; Philadelphia: 1972. [Google Scholar]
- Heiss WD. Ischemic Penumbra: Evidence From Functional Imaging in Man. J Cereb Blood Flow Metab. 2000;20:1276–1293. doi: 10.1097/00004647-200009000-00002. [DOI] [PubMed] [Google Scholar]
- Heiss W, Kessler J, Thiel A, Ghaemi M, Karbe H. Differential capacity of left and right hemispheric areas for compensation of posstroke aphasia. Ann Neurol. 1999;45:430–438. doi: 10.1002/1531-8249(199904)45:4<430::aid-ana3>3.0.co;2-p. [DOI] [PubMed] [Google Scholar]
- Hendrikse J, van Osch MJP, Rutgers DR, Bakker CJG, Kappelle LJ, Golay X, van der Grond J. Internal Carotid Artery Occlusion Assessed at Pulsed Arterial Spin-labeling Perfusion MR Imaging at Multiple Delay Times. Radiology. 2004;233:899–904. doi: 10.1148/radiol.2333031276. [DOI] [PubMed] [Google Scholar]
- Hillis AE. Preface to Special Issue: New techniques for identifying the neural substrates of language and language impairments. Aphasiology. 2002;16:855–857. [Google Scholar]
- Hillis AE. Magnetic resonance perfusion imaging in the study of language. Brain Lang. 2007;2007:165–175. doi: 10.1016/j.bandl.2006.04.016. [DOI] [PMC free article] [PubMed] [Google Scholar]
- Hillis AE, Barker PB, Beauchamp NJ, Gordon B, Wityk RJ. MR perfusion imaging reveals regions of hypoperfusion associated with aphasia and neglect. Neurology. 2000;55:782–788. doi: 10.1212/wnl.55.6.782. [DOI] [PubMed] [Google Scholar]
- Hillis AE, Barker PB, Wityk RJ, Aldrich EM, Restrepo L, Breese EL, Work M. Variability in subcortical aphasia is due to variable sites of cortical hypoperfusion. Brain Lang. 2004;89:524–530. doi: 10.1016/j.bandl.2004.01.007. [DOI] [PubMed] [Google Scholar]
- Hillis AE, Kane A, Barker P, Beauchamp N, Gordon B, Wityk R. Neural substrates of the cognitive processes underlying reading: Evidence from magnetic resonance perfusion imaging in hyperacute stroke. Aphasiology. 2001a;15:919–931. [Google Scholar]
- Hillis AE, Kane A, Tuffiash E, Ulatowski JA, Barker PB, Beauchamp NJ, Wityk RJ. Reperfusion of specific brain regions by raising blood pressure restores selective language functions in subacute stroke. Brain Lang. 2001b;79:495–510. doi: 10.1006/brln.2001.2563. [DOI] [PubMed] [Google Scholar]
- Hillis AE, Newhart M, Heidler J, Barker PB, Herskovits EH, Degaonkar M. Anatomy of Spatial Attention: Insights from Perfusion Imaging and Hemispatial Neglect in Acute Stroke. The Journal of Neuroscience. 2005;25:3161–3167. doi: 10.1523/JNEUROSCI.4468-04.2005. [DOI] [PMC free article] [PubMed] [Google Scholar]
- Hillis AE, Wityk RJ, Tuffiash E, Beauchamp NJ, Jacobs MA, Barker PB, Selnes OA. Hypoperfusion of Wernicke's Area Predicts Severity of Semantic Deficit in Acute Stroke. Ann Neurol. 2001c;50:561–566. doi: 10.1002/ana.1265. [DOI] [PubMed] [Google Scholar]
- Huettel SA, Singerman JD, McCarthy G. The Effects of Aging upon the Hemodynamic Response Measured by Functional MRI. Neuroimage. 2001;13:161–175. doi: 10.1006/nimg.2000.0675. [DOI] [PubMed] [Google Scholar]
- Kertesz A. Western Aphasia Battery. Grune and Stratton; New York: 1982. [Google Scholar]
- Kim SG. Quantification of relative cerebral blood flow change by flow-sensitive alternating inversion recovery (FAIR) technique: Application to functional mapping. Magn Reson Med. 1995;34:293–301. doi: 10.1002/mrm.1910340303. [DOI] [PubMed] [Google Scholar]
- Krainik A, Hund-Georgiadis M, Zysset S, von Cramon Y. Regional Impairment of Cerebrovascular Reactivity and BOLD Signal in Adults After Stroke. Stroke. 2005;36:1146–1152. doi: 10.1161/01.STR.0000166178.40973.a7. [DOI] [PubMed] [Google Scholar]
- Kwong KK, Chesler DA, Weisskoff RM, Donahue KM, Davis TL, Ostergaard LC, Terrence A, Rosen BR. MR perfusion studies with T1-weighted echo planar imaging. Magn Reson Med. 1995;34:878–887. doi: 10.1002/mrm.1910340613. [DOI] [PubMed] [Google Scholar]
- Liebeskind DS. Collateral Circulation. Stroke. 2003;34:2279–2284. doi: 10.1161/01.STR.0000086465.41263.06. [DOI] [PubMed] [Google Scholar]
- Liu TT, Brown GG. Measurement of cerebral perfusion with arterial spin labeling: Part 1. Methods J Int Neuropsychol Soc. 2007;13:1–9. doi: 10.1017/S1355617707070646. [DOI] [PubMed] [Google Scholar]
- Liu TT, Wong EC. A signal processing model for arterial spin labeling functional. MRI Neuroimage. 2005;24:207–215. doi: 10.1016/j.neuroimage.2004.09.047. [DOI] [PubMed] [Google Scholar]
- Love T, Oster E. On the categorization of Aphasic typologies: The S.O.A.P., A test of syntactic complexity. J Psycholinguist Res. 2002;31:503–529. doi: 10.1023/a:1021208903394. [DOI] [PubMed] [Google Scholar]
- Love T, Swinney D, Wong E, Buxton R. Perfusion imaging and stroke: A more sensitive measure of the brain bases of cognitive deficits. Aphasiology. 2002;16:873–883. doi: 10.1080/02687030244000356. [DOI] [PMC free article] [PubMed] [Google Scholar]
- Lu H, Clingman C, Golay X, van Zijl PCM. Determining the longitudinal relaxation time (T1) of blood at 3.0 Tesla. Magn Reson Med. 2004;52:679–682. doi: 10.1002/mrm.20178. [DOI] [PubMed] [Google Scholar]
- Ni Jw, Ohta H, Matsumoto K, Watanabe H. Progressive cognitive impairment following chronic cerebral hypoperfusion induced by permanent occlusion of bilateral carotid arteries in rats. Brain Res. 1994;653:231–236. doi: 10.1016/0006-8993(94)90394-8. [DOI] [PubMed] [Google Scholar]
- Ogawa S, Lee TM, Kay AR, Tank DW. Brain magnetic resonance imaging with contrast dependent on blood oxygenation. Proc Natl Acad Sci USA. 1990;87:9868–9872. doi: 10.1073/pnas.87.24.9868. [DOI] [PMC free article] [PubMed] [Google Scholar]
- Ogawa S, Tank D, Menon R, Ellerman J, Kim S, Merkle H, Ugurbil K. Intrinsic signal changes accompanying sensory stimulation: functional brain mapping with magnetic resonance imaging. Proc Natl Acad Sci USA. 1992;89:5951–5955. doi: 10.1073/pnas.89.13.5951. [DOI] [PMC free article] [PubMed] [Google Scholar]
- Okuda B, Kawabata K, Tachibana H, Sugita M. Cerebral Blood Flow in Pure Dysarthria : Role of Frontal Cortical Hypoperfusion. Stroke. 1999;30:109–113. doi: 10.1161/01.str.30.1.109. [DOI] [PubMed] [Google Scholar]
- Oldfield RC. The assessment and analysis of handedness: The Edinburgh inventory. Neuropsychologia. 1971;9:97–113. doi: 10.1016/0028-3932(71)90067-4. [DOI] [PubMed] [Google Scholar]
- Parkes LM, Rashid W, Chard DT, Tofts PS. Normal Cerebral Perfusion Measurements Using Arterial Spin Labeling: Reproducibility, Stability, and Age and Gender Effects. Magn Reson Med. 2004;51:736–743. doi: 10.1002/mrm.20023. [DOI] [PubMed] [Google Scholar]
- Prabhakaran V, Raman SP, Grunwald MR, Mahadevia A, Hussain N, Lu H, Van zijl PCM, Hillis AE. Neural substrates of word generation during stroke recovery: The influence of cortical hypoperfusion. Behav Neurol. 2007;18:45–52. doi: 10.1155/2007/430402. [DOI] [PMC free article] [PubMed] [Google Scholar]
- Price CJ. The Functional Anatomy of Reading. In: Frackowiak RSJ, editor. Human Brain Function. Academic Press; San Diego, CA: 2004. pp. 547–562. [Google Scholar]
- Roc AC, Wang J, Ances BM, Liebeskind DS, Kasner SE, Detre JA. Altered Hemodynamics and Regional Cerebral Blood Flow in Patients With Hemodynamically Significant Stenoses. Stroke. 2006;37:382–387. doi: 10.1161/01.STR.0000198807.31299.43. [DOI] [PubMed] [Google Scholar]
- Schaefer PW, Ozsunar Y, He J, Hamberg LM, Hunter GJ, Sorensen AG, Koroshetz WJ, Gonzalez RG. Assessing Tissue Viability with MR Diffusion and Perfusion Imaging. American Journal of Neuroradiology. 2003;24:436–443. [PMC free article] [PubMed] [Google Scholar]
- Schellinger PD, Jansen O, Fiebach JB, Heiland S, Steiner T, Schwab S, Pohlers O, Ryssel H, Sartor K, Hacke W. Monitoring Intravenous Recombinant Tissue Plasminogen Activator Thrombolysis for Acute Ischemic Stroke With Diffusion and Perfusion MRI. Stroke. 2000;31:1318–1328. doi: 10.1161/01.str.31.6.1318. [DOI] [PubMed] [Google Scholar]
- Sekhon LHS, Morgan MK, Spence I, Weber NC. Chronic Cerebral Hypoperfusion and Impaired Neuronal Function in Rats. Stroke. 1994;25:1022–1027. doi: 10.1161/01.str.25.5.1022. [DOI] [PubMed] [Google Scholar]
- Selman WR, Lust WD, Pundik S, Zhou Y, Ratcheson RA. Compromised metabolic recovery following spontaneous spreading depression in the penumbra. Brain Res. 2004;999:167–174. doi: 10.1016/j.brainres.2003.11.016. [DOI] [PubMed] [Google Scholar]
- Smith SM, Jenkinson M, Woolrich MW, Beckmann CF, Behrens TEJ, Johansen-Berg H, Bannister PR, De Luca M, Drobnjak I, Flitney DE, Niazy RK, Saunders J, Vickers J, Zhang Y, De Stefano N, Brady JM, Matthews PM. Advances in functional and structural MR image analysis and implementation as FSL. Neuroimage. 2004;23:S208–S219. doi: 10.1016/j.neuroimage.2004.07.051. [DOI] [PubMed] [Google Scholar]
- Soares BP, Chien JD, Wintermark M. MR and CT Monitoring of Recanalization, Reperfusion, and Penumbra Salvage: Everything That Recanalizes Does Not Necessarily Reperfuse! Stroke. 2009;40:S24–S27. doi: 10.1161/STROKEAHA.108.526814. [DOI] [PubMed] [Google Scholar]
- Vernooij MW, van der Lugt A, Ikram MA, Wielopolski PA, Vrooman HA, Hofman A, Krestin GP, Breteler MM. Total cerebral blood flow and total brain perfusion in the general population: The Rotterdam Scan Study. J Cereb Blood Flow Metab. 2008;28:412–419. doi: 10.1038/sj.jcbfm.9600526. [DOI] [PubMed] [Google Scholar]
- Wang J, Qiu M, Constable RT. In Vivo Method for Correcting Transmit/Receive Nonuniformities with Phased Array Coils. Magn Reson Med. 2005;53:666–674. doi: 10.1002/mrm.20377. [DOI] [PubMed] [Google Scholar]
- Ward NS, Brown MM, Thompson AJ, Frackowiak RSJ. Neural correlates of outcome after stroke:a cross-sectional fMRI study. Brain. 2003;126:1430–1448. doi: 10.1093/brain/awg145. [DOI] [PMC free article] [PubMed] [Google Scholar]
- Wityk RJ, Hillis A, Beauchamp N, Barker PB, Rigamonti D. Perfusion-weighted Magnetic Resonance Imaging in Adult Moyamoya Syndrome: Characteristic Patterns and Change after Surgical Intervention: Case Report. Neurosurgery. 2002;51:1499–1506. [PubMed] [Google Scholar]
- Wong EC. Quantifying CBF With Pulsed ASL: Technical and Pulse Sequence Factors. J Magn Reson Imaging. 2005;22:727–731. doi: 10.1002/jmri.20459. [DOI] [PubMed] [Google Scholar]
- Wong EC, Buxton RB, Frank LR. Implementation of quantitative perfusion imaging techniques for functional brain mapping using pulsed arterial. NMR Biomed. 1997;10:237–249. doi: 10.1002/(sici)1099-1492(199706/08)10:4/5<237::aid-nbm475>3.0.co;2-x. [DOI] [PubMed] [Google Scholar]
- Wong EC, Buxton RB, Frank LR. Quantitative imaging of perfusion using a single subtraction (QUIPSS and QUIPSS II) Magn Reson Med. 1998;39:702–708. doi: 10.1002/mrm.1910390506. [DOI] [PubMed] [Google Scholar]
- Wong EC, Buxton RB, Frank LR. Quantitative Perfusion Imaging using Arterial Spin Labeling. Neuroimaging Clin N Am. 1999;9:333–342. [PubMed] [Google Scholar]