

Abstract
The rational design of interventions is critical to controlling communicable diseases, especially in urban environments. In the case of the Chagas disease vector Triatoma infestans, successful control is stymied by the return of the insect after the effectiveness of the insecticide wanes. Here, we adapt a genetic algorithm, originally developed for the travelling salesman problem, to improve the spatio-temporal design of insecticide campaigns against T. infestans, in a complex urban environment. We find a strategy that reduces the expected instances of vector return 34-fold compared with the current strategy of sequential insecticide application to spatially contiguous communities. The relative success of alternative control strategies depends upon the duration of the effectiveness of the insecticide, and it shows chaotic fluctuations in response to unforeseen delays in a control campaign. We use simplified models to analyse the outcomes of qualitatively different spatio-temporal strategies. Our results provide a detailed procedure to improve control efforts for an urban Chagas disease vector, as well as general guidelines for improving the design of interventions against other disease agents in complex environments.
Keywords: disease ecology, vector-borne disease, control theory, Chagas disease, Triatoma infestans, urban
1. Introduction
Interventions intended to control infectious diseases are often ephemeral and fail to provide long-lasting protection. Even transient interventions, however, can significantly reduce disease transmission if employed in a rational manner. The problem of optimizing the design of control efforts in time and space is difficult because the number of possible designs can be astronomical. A similar difficulty arises in the ‘travelling salesman problem’, which consists of minimizing the distance of a route taken by a salesman visiting numerous locations. A rich library of algorithms has been developed to address the travelling salesman problem (Reinelt 1994; Larranaga et al. 1999; Gutin & Punnen 2002; Applegate 2007), but such algorithms are yet to be adapted to the control of important infectious diseases, such as Chagas disease.
Chagas disease kills more people in the Americas than any other parasitic disease (World Health Organization 2003); recent estimates of the number of individuals infected with Trypanosoma cruzi, the etiologic agent of the disease, fall between 8 and 10 million individuals (Organizacion Panamericana de la Salud 2006; Remme et al. 2006). Triatoma infestans, the principal insect vector of Chagas disease in South America, is the target of an elimination programme known as the Southern Cone Initiative. This initiative has been remarkably successful, eliminating T. infestans from affected areas across southern South America through the household application of insecticide. As a result of the initiative, three countries, Chile (Lorca et al. 2001), Brazil (Silveira & Vinhaes 1999) and Uruguay (World Health Organization 1994), have been declared free of Chagas disease transmission by T. infestans. Triatoma infestans control campaigns are currently ongoing in southern Peru, where, in contrast to other areas (Dias et al. 2002), the vector has become an urban problem (Levy et al. 2006, 2007).
Even in rural areas, T. infestans readily re-infests treated households after the residual effect of the insecticide has waned (Cecere et al. 2004; Dohna et al. 2007). Each instance of vector re-infestation incurs significant expense to a control campaign because field teams must revisit and retreat re-infested households. Vectors may re-infest a treated community from unnoticed or under-treated sites within the community, through passive transport by humans or animals, or by active dispersal from untreated communities (Cecere et al. 2006; Gurtler et al. 2007). In a city, where communities are very close to one another and vector dispersal rates are high (Levy et al. 2008), a large proportion of the instances of re-infestation are likely due to active dispersal by the insect.
A campaign to control T. infestans in the city of Arequipa, Peru, is currently ongoing. Resource constraints limit the rate of advance of this campaign; thus not all infested communities can be treated simultaneously. An optimal design for this campaign must balance the dual and conflicting aims of maximizing control of the vector and minimizing costs (Forster & Gilligan 2007; Rowthorn et al. 2009). The campaign, like many urban vector control campaigns, follows a hub-and-spoke model (Davis 1999) in which control personnel begin and end each day in a central location, where they receive insecticide, and are then transported to the community in which they will be intervening. Changing the order of treatment of affected communities, therefore, does not incur any additional cost to the programme and may help decrease the risk that untreated communities pose to those under insecticide control.
The ordering of the application of insecticide in T. infestans control campaigns is currently guided by the rule of continuity (in time) and contiguity (in space). This rule is considered the best practice to prevent vectors from returning to treated areas from untreated areas (World Health Organization 2002). Here, we develop a mathematical model that calculates the expected number of instances of vector re-infestation owing to active dispersal. We use this model to evaluate vector control strategies based on the rule of continuity and contiguity. We then show that existing, best-practice strategies can be significantly improved by a genetic algorithm originally developed for the travelling salesman problem. We study the properties of 1000 algorithm-generated control strategies and analyse the conditions under which tactics present in these strategies improve control in simplified systems. Unexpected delays in campaigns to control disease agents are a constant in low-resource settings with multiple public health priorities. We consider how the timing of such delays affects the relative success of alternative control strategies. Our results help to elucidate general principles for the successful control of disease agents and other unwanted organisms in complex environments.
2. Material and methods
2.1. Example study area
The district of Socabaya in the city of Arequipa has grown dramatically owing to recent immigration. Population influx has resulted in clusters of pueblos jovenes (new communities) separated from each other by titled land. In preparation for the Chagas disease insecticide control campaign, trained specialists visited Socabaya and surveyed 30 per cent of households in the 53 communities in the district (figure 1) to estimate the prevalence of T. infestans infestation (IID, following local notation). Surveys were ‘rapid assessments’, lasting approximately 20 min per household. Control personnel also produced detailed maps of community borders, defined by the predominant political unit of the city, the ‘localidad’, carefully eliminating uninhabited areas. There were 13 699 households in the district, arranged on rectangular city blocks. We were unable to collect geographical coordinates on all houses; therefore, we produced a grid within each community, with the number of nodes of the grid equal to the number of houses in the community. Our calculations were done on the household level; we used the nodes of the grid to represent the position of each household. Triatomines infected with Trypanosoma cruzi, the etiologic agent of Chagas disease, had been repeatedly reported in a community at the northern end of the district of Socabaya. This community was given preference by the Ministry of Health in the control campaign and, therefore, we set it in the first position in all the alternative spray orderings we considered.
Figure 1.

Map of the 53 communities of the district of Socabaya, Arequipa, Peru. Inset shows the outline of the metropolitan area of the city. Shading indicates the prevalence of T. infestans infested households. Infestation prevalence: light pink, 0–0.2; light red, 0.2–0.4; dark red, 0.4–0.6; brown, 0.6–0.8; dotted line, river. Scale bar, 1 km.
2.2. Vector dispersal model
Our model of vector dispersal is compartmental and similar to models of infectious disease transmission—specifically, our model is an infectious–recovered–susceptible (IRS) model, a variant on the well-described susceptible–infected–recovered (SIR) model (Anderson & May 1991). Prior to vector control, a community is considered infested and ‘infectious’—meaning it can serve as a source of dispersing insects. The community becomes uninfested and uninfectious upon completion of treatment with insecticide, and it is ‘immune’ to re-infestation for the duration of the insecticide's residual effect. The community then becomes ‘susceptible’ to vector re-infestation and remains susceptible for the remainder of the control campaign.
The period of time, measured in days, during which houses in each community are infectious, immune and susceptible is determined by the ordering of communities in the vector control campaign, Φ. We translate the ordering of communities into a schedule of days, ti, at which the spraying of half of the houses in each community i is completed:
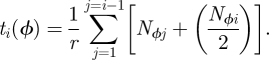 |
Here, Nϕj denotes the number of households in community j under the ordering Φ, and r is the rate of insecticide application (number of houses treated per day). No community is left partially treated; once spraying begins in a community, it is completed before the campaign can advance to the next community.
We use a Cauchy function derived from experimental trapping data (Levy et al. 2008) to model the rate of vector dispersal, given the Euclidean distance between source and destination houses, dab. The function has two parameters. The first parameter, α, determines the shape of the curve; we estimated that α = 28 through trapping experiments in urban Arequipa (Levy et al. 2008). The second parameter, β, represents the intrinsic rate of vector movement. The expected number of instances of vector return scales linearly with β, and this term cancels out when comparing alternative strategies in the optimization routine. The complete function
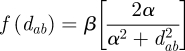 |
is graphed in figure S1 in the electronic supplementary material.
The probability of vector dispersal to a given destination house is decreased in the presence of alternative destination houses. We model the probability that a vector initiates dispersal to a given house, rather than any other house, as the rate of dispersal to that house proportional to dispersal rates to all possible destination houses:
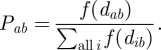 |
We calculate the expected number of instances of vector return per day from community j to community i as the product of the summed rate of dispersal between all houses in the two communities and the probability that each house in the source community is infested as estimated from entomologic surveys (IIDj):
Given an ordering of communities in a control campaign, Φ, the total expected number of instances of vector re-infestation events owing to active dispersal is the sum of the expected number of insects returning to each community i from each source community j during the period of time, denoted by Tij, that a house in i remains susceptible and a house in j infectious:
Here, Tij, measured in days, depends on the average of the times at which spraying is completed in houses in communities i and j:
where L denotes the duration of insecticide effectiveness, which we set at 100 days based loosely on a study from Arequipa (Palomino et al. 2008). When more than one spray brigade is available, Tij can be decreased through concurrent treatment of successive communities in the spray ordering. We calculated Tij for the T. infestans control campaign in Socabaya for two spray brigades of five individuals. From our experience in previous campaigns, each brigade treats an average of 18 households per day. Following practice in field situations, brigades work in parallel in two different communities at all times in the model.
2.3. Alternative vector control strategies
We considered five alternative codified strategies by which to apply insecticide to the district of Socabaya. We first generated an ordering for the control campaign for Socabaya following the rule of contiguity (the contiguous strategy). The ordering was specified by eye, without the aid of a computer, in the manner in which spray campaigns are routinely planned in Peru and elsewhere (figure 2a). To counter the subjectivity of our analysis, we also formalized two versions of the rule of contiguity. In the first version, the spray campaign proceeds from each treated community to its nearest geographical neighbour (the nearest-neighbour strategy, figure 2c). In the second version, the campaign proceeds to the untreated community that is nearest, on average, to all treated communities (the average distance strategy, figure 2d).
Figure 2.

Alternative spatio-temporal designs for the vector control campaign. Six alternative orderings of insecticide application are shown: (a) the contiguous strategy; (b) the best route of 1000 generated by a genetic algorithm; (c) the nearest-neighbour strategy; (d) the average distance strategy; (e) the concentric circle strategy; (f) the greedy algorithm strategy. The progress of control campaigns following these orderings, and the expected instances of vector re-infestation for each, is shown in movies in the electronic supplementary material.
We next considered two alternative strategies that were not based on the rule of contiguity. In the first alternative, the campaign moves outwards in concentric circles, spraying communities in order of their distance from the first community (the concentric circle strategy, figure 2e). In the second alternative, we used the vector data and dispersal model to define a spray ordering in which the campaign always proceeds to the untreated community that is the greatest source of redispersing insects to all treated communities (the greedy algorithm (Cormen & Cormen 2001) strategy, figure 2f).
2.4. Optimization algorithm
We used a genetic algorithm to minimize the expected number of re-infestation events of treated communities owing to active dispersal from untreated communities. We initiated the algorithm with 80 replicates of the contiguous strategy in order to study how the algorithm might alter the current best-practice design. The expected number of instances of the return of T. infestans from untreated areas within the district was calculated for each ordering as described above. The reciprocal of this number was the ‘fitness’ of the ordering, and served as the objective function maximized by the algorithm. In successive iterations, 80 pairs of parental ordering were selected from the population by tournament. In each tournament, five individuals (spray orders) were selected at random from the population. The individual with the highest fitness among the five was selected as the maternal ordering. The process was repeated, excluding the maternal ordering from the population, and a second ordering was selected as the paternal ordering (Patel et al. 2005). The maternal and paternal ordering were then ‘mated’ in a process mimicking biological reproduction. The process of mating retained aspects of each parental order while creating diversity in the specific ‘offspring’ arrangement (Patel et al. 2005). We used two functions to introduce diversity in the mating process, crossover and mutation, which are described in figure S2 in the electronic supplementary material. We produced a library of 1000 algorithm-generated orderings of insecticide application. We show the best algorithm-generated ordering in figure 2b. In each realization, we ran the algorithm until 1000 successive generations occurred without an improvement in the fitness of the most-fit order in the population. The algorithm was written in the R statistical package (R 2.6; www.r-project.org).
2.5. Sensitivity analysis
We evaluated the sensitivity of the relative effect of the five orderings generated from codified best-practice strategies, and 1000 orderings generated by the genetic algorithm. We tested the sensitivity to parameters describing the duration of insecticide effectiveness, L (figure 3), and the shape of the function relating vector dispersal to distance, α. We recalculated the expected number of instances of re-infestation for all strategies varying L from 0 to 200 days, and varying α from 0 to 100. We also tested the sensitivity of the alternative strategies to unforeseen delays in the spray campaign. We considered the effects of 30-day delays and varied the timing of these delays from the beginning to the end of the control campaign.
Figure 3.

Sensitivity of the relative success of alternative strategies to model parameters. The ranked fitness of alternative orderings of the control campaign over a range of parameter values for the duration of insecticide activity (a) and in the presence of 30-day delays beginning at different points in the control campaign (b). Shown are: the 1000 algorithm-generated control strategies (shades of grey), the contiguous strategy (A, red), the best algorithm-generated strategy (B, blue), the greedy algorithm strategy (C, magenta), the concentric circle strategy (D, green), the average distance strategy (E, brown), the nearest-neighbour strategy (F, orange) and the most robust algorithm-generated strategy (G, yellow, in (a) only). The effects of 30-day delays beginning after the 200th day of the spray campaign were minimal and are not shown.
2.6. Simplified model systems
In order to better understand the behaviour of alternative control strategies in the IRS system and vector diffusion model described above, we considered two simplified model systems. We asked under which conditions treating distal communities prior to more proximate ones is beneficial to vector control. We first considered three aligned communities of sizes N1, N2 and N3, the first of which has already received insecticide treatment (treated; figure 4a). We fixed the distance between the treated and the proximate communities (d1) at 100 m, and we allowed the distance between the treated and the distal communities (d2) to vary. We compared the number of expected instances of vector return within the system for the two possible spray orders, sequential (treated–proximate–distal) and non-sequential (treated–distal–proximate). We added one simplification to the model by assuming equal prevalence of infestation in all communities. We also assumed that vector dispersal from a community was proportional to the number of houses in the community. Otherwise, parameter values and methods were as described above. We then examined the effects of geography, keeping the size of communities constant at 2000 houses in a four-community system (figure 5a). Finally, we applied successful tactics to a seven-community subset of the district of Socabaya (figure 6).
Figure 4.

A simplified, three-community system. (a) Schematic of the system. The largest community, of size N1, is treated first. (b) Conditions under which treating a distal community prior to a proximate community is beneficial (filled areas), detrimental and neutral to vector control. The size of the treated community (N1) is set at 1000 households. The distance between the treated and proximate communities (d1) is set at 100 m. The size of the proximate community (N2) is set at three example levels: 50 (black), 100 (dark grey) and 150 (light grey). The duration of the insecticide is 100 days.
Figure 5.

A simplified four-community system. (a) Schematic of the system. Community A is always treated first, and community D is always treated last. The size of each community is set at 2000 households. The positions of communities A, B and D are set (filled squares), while the position of community C is varied across every point in a 200 × 200 grid. (b) The positions of community C which favour treating in the order of (A–B–C–D) are shown in black; the positions of community C which favour treating in the order of (A–C–B–D) are in grey.
Figure 6.

Alternative tactics for ordering insecticide application to a seven-community subset of Socabaya. The route of insecticide application is shown by dotted lines; each community is shaded in proportion to the expected number of instances of vector return. (a) The contiguous strategy, (b) the concentric circle strategy, (c) a route employing the tactic of postponing treatment of a community contiguous to multiple communities and (d) a route employing the same tactic as well as spraying a larger, highly infested, community earlier.
3. Results
3.1. Vector surveys
Vector infestation rates varied greatly (0–83%) across communities in the district of Socabaya. Communities near the centre of the district generally had higher infestation rates than those at the northern and southern extremes (figure 1). Entomologic data were not available at the community level for 19 of the 53 communities; we assumed that the prevalence of infestation in these communities was equal to the district mean.
3.2. Comparison of alternative vector control strategies
Strategies to apply insecticide to Socabaya following formalized rules of contiguity performed more poorly than the contiguous ordering generated by eye. Under our model, the nearest-neighbour strategy would lead to an 18.8-fold increase in the number of returning insects compared with the contiguous strategy, and the average distance strategy would lead to a 3.5-fold increase (table 1). The concentric circle strategy performed better than the contiguous strategy: spraying Socabaya by this strategy would lead to an expected 3.9-fold decrease in the number of expected instances of re-infestation. The greedy algorithm strategy, however, would lead to a 4.5-fold increase in returning insects.
Table 1.
The relative number of instances of vector re-infestation owing to vector redispersal for alternative control strategies.
| control strategy | instances of re-infestation (relative to contiguous strategy) |
|---|---|
| A. contiguous | 1 |
| B. algorithm-generated | 0.10 (range 0.03–0.24) |
| C. nearest neighbour | 4.47 |
| D. average distance | 3.50 |
| E. concentric circle | 0.26 |
| F. greedy algorithm | 18.8 |
Each of the 1000 algorithm-generated strategies was better than all the codified strategies. On average, the algorithm-generated ordering had a 12-fold decrease in the number of instances of active re-infestation compared with the contiguous strategy (5th and 95th percentiles: 5.9 and 19.6). The best of the algorithm-generated ordering (figure 2b) had 34-times fewer expected instances of vector return. Movies showing the progress and expected outcomes for the contiguous and best algorithm-generated strategies are shown in figures S4–S9 in the electronic supplementary material.
Any application of the rule of contiguity ‘by eye’ is bound to be imperfect and leave room for improvement. However, rather than merely identifying better contiguous routes by which to spray Socabaya, the genetic algorithm produced solutions that deviated from sequential treatment of geographically proximate communities. We tabulated the frequency at which each community occurred at each position in the 1000 algorithm-generated spray orders; these are shown in the two-dimensional histogram in figure 7. The position of communities near the centre of the district deviated most often from the contiguous route. These communities were particularly susceptible to vector return when Socabaya was treated following the contiguous strategy (figure 2a). The histogram was more peaked for communities that were very infectious, or highly susceptible to vector re-infestation, reinforcing the importance of careful placement of these communities in the ordering of an intervention campaign. The histogram was flatter for less susceptible and less infectious communities, suggesting that the algorithm could more freely shuffle the position of these communities in order to improve the overall outcome of the spray order.
Figure 7.

Frequency of position of communities in 1000 algorithm-generated strategies for the vector control campaign. (a) Communities are ordered by their position in the contiguous strategy used to initiate the algorithm (dotted line). (b) Communities are aligned to show deviation from their original position in the contiguous strategy, and ordered by their susceptibility to re-infestation owing to vectors returning from all other communities and (c) their infectiousness to all other communities. Communities in the five initial and ultimate positions in the contiguous ordering are not included in (b,c), so that the trends in positioning of the remaining communities are more visible.
3.3. Sensitivity analysis
The relative effect of alternative control strategies was sensitive to the duration of effectiveness of the insecticide, L, especially as this parameter was decreased from the value used in the optimization routine (100 days). The contiguous strategies fared better when the duration of insecticide was low; for L < 50 days, the best algorithm-generated ordering was surpassed by the contiguous strategy. Some algorithm-generated orderings, however, were more robust to changes in the duration of the effectiveness of the insecticide. The most robust ordering, which had the highest average ranking across the range of parameter values considered, remained superior to the contiguous strategy for all values of L over 20 days. This most robust strategy, however, was not robust to changes of other model parameters.
The ranking of alternative ordering was only minimally sensitive to the parameter describing the relationship between vector dispersal rate and distance, α (figure S3 in the electronic supplementary material). Most of the sensitivity to the dispersal parameter was focused at the very low end of the range considered; in all cases each algorithm-generated ordering was superior to all of the ordering derived from the current best-practice strategy.
We observed chaotic behaviour in the performance of alternative control strategies in response to the timing of unforeseen delays. A strong dependency of the rankings of alternative strategies on the precise start point of the delay is visible as vertical striations in the plot in figure 3. In general, sensitivity to delays was greater when the delays occurred at, or slightly before, the midpoint of the intervention campaign.
3.4. Simplified model systems
In a three-community system, there were a limited set of parameter regimes that conferred a premium on treating communities out of geographical order (figure 4). Two conditions were necessary for the premium: (i) the distal community must be much larger than the proximate community and (ii) the combined size of the proximate and distal communities must exceed the number of households that can be sprayed during the immune period of the first treated community, but not by too much (figure 4). The first condition reflects the advantage conferred by depleting a larger source of vectors early. This advantage is countered by the second condition, which limits the amount of time that a smaller, closer, source of vectors can be allowed to threaten a treated community. These competing conditions define the region in which deviating from geographical order is beneficial—when the benefit of the first condition exceeds the cost of the second.
Analysis of a four-community system revealed a very important tactic for vector control: when a proximate community is susceptible to two distal communities, it can be advantageous to postpone its treatment until the vector population in at least one of the distal communities is controlled (figure 5).
The seven-community subset of the district of Socabaya we considered (figure 6) exhibited many instances of re-infestation under the contiguous strategy. These communities were repeatedly treated out of geographical order by the algorithm-generated strategies. In this subset of Socabaya, postponing the treatment of a community contiguous to two others decreased the expected number of instances of vector return (figure 6c). Employing this tactic in conjunction with treating a large, highly infested, community earlier further reduced the return of vectors (figure 6d).
4. Discussion
The design of interventions against infectious diseases can determine whether or not transmission is eventually controlled. Reintroduction of disease agents following intervention can be disastrous to a control campaign and has frustrated efforts to control the Chagas disease vector, T. infestans, in particular. The World Health Organization (2002) currently recommends applying insecticide to communities affected by T. infestans following the ‘rule of contiguity’ in order to prevent redispersal by the insect. In a complex urban environment, this rule cannot always effectively be translated into practice. We show here that a genetic algorithm, originally developed for the travelling salesman problem, can improve the ordering of blanket vector control campaigns and diminish the risk of return of vectors to areas under insecticide control.
Strategies based on the rule of contiguity, and several codified alternatives, all shared a limitation: they were short-sighted and overextended the control campaign. The contiguous strategy left untreated communities by the wayside, allowing a path of treated communities to become increasingly exposed along its flank. Other codified strategies treated some communities prematurely and allowed them to remain surrounded by untreated communities long after the effectiveness of the insecticide had waned. Although these strategies were successful early, as the campaigns progressed the areas at risk accumulated, eventually making the protection of all treated communities an intractable problem.
In contrast to the rule of contiguity and alternative codified rules, the genetic algorithm explored many more potential solutions, allowing it to overcome the short-sightedness of the fixed strategies. The control campaigns generated by the algorithm often treated communities that were not faced with an immediate re-infestation threat but which would have faced a threat later in the campaign. Even in simplified systems of three or four communities, there were some advantageous tactics that improved control by treating communities out of strict geographical order. These included clearing a path for the campaign by treating large distal communities prior to smaller proximate communities, and postponing the treatment of a proximate community if it was highly susceptible to multiple distal communities until one or more of the distal communities were treated. In more complex systems, such as the district of Socabaya, there are likely many more tactics that would decrease the risk of vector return by treating communities out of geographical order. The flexibility of the optimization algorithm allowed it to take advantage of different tactics at different points in the control campaign, and thereby better tailor the campaign to the particular geography and vector prevalence of the intervention area.
The duration of the effectiveness of an intervention was a key factor in the success of a control campaign. When an intervention had little or no residual effect, contiguous strategies worked well; however, even a minimal lasting effect of insecticide created conditions that favoured non-contiguous strategies. In other words, the contiguous strategy was the best option when the intervention was poorly effective. The outcome of algorithm-generated spray ordering was more sensitive to an overestimation of the duration of the effectiveness of the insecticide than to an underestimation. Conservative estimates of the duration of the residual effect of insecticide against T. infestans will provide more robust designs for a control campaign.
Unexpected delays in campaigns to control disease agents are to be expected. The success of a treatment schedule against T. infestans depended strongly on the unforeseeable timing of such delays. The dependence was chaotic—in some cases, the outcome of a control campaign was minimally affected by a delay in insecticide application if the delay began on a certain day, but greatly decreased if the delay began a day later. No design was robust to all unforeseen delays. The contiguous strategy did not perform better in the face of the uncertainty created by unforeseen delays. The unpredictable detrimental effects of a delay are best countered by rerunning the optimization algorithm, following the interruption of insecticide application, to find an optimal route by which to treat the remaining communities.
In practice, the design of control campaigns must be guided by economic considerations (Forster & Gilligan 2007; Rowthorn et al. 2009). While urban vector control campaigns follow a hub-and-spoke model, with the advantage of a central location for storage of insecticide and biosafety equipment, rural campaigns often follow a point-to-point model (Davis 1999) in which control personnel must travel directly from one community to the next. Treating communities out of geographical order may incur additional travel costs in such rural campaigns. To adapt the methods presented here to rural campaigns, a utility function (McPake et al. 2002) that weighs the benefit of decreasing the number of instances of vector re-infestation against the cost of increasing the distance travelled by a control team can be maximized by the genetic algorithm.
Our analysis was limited in a number of ways and included simplifications. We did not have accurate information on the prevalence of vector infestation in 19 communities. Our prevalence data were taken at the level of the community, while the process of vector dispersal occurs on a household scale, leaving our results prone to errors owing to the modifiable unit problem (Openshaw 1983). Our estimates of vector dispersal came from a single study; improved estimates of dispersal rates over different distances, and in different environments, would help quantify the trade-off between increased operational expenses and improved vector control (Gurevitz et al. 2006; Marcet et al. 2008). We also could not take into account vector return from parts of the city outside of the district of Socabaya. Vector dispersal rate and insecticide activity are also affected by temperature and rainfall (Vazquez-Prokopec et al. 2006). While in Arequipa seasonal changes are relatively minor given the high desert environment, incorporating seasonal weather fluctuations into the redispersal risk model may allow for further improvement of the spatio-temporal ordering of insecticide application, especially in other areas with greater yearly weather fluctuation. We limited our focus to improving an existing vector control campaign based on blanket application of insecticide. Alternative methods of vector control, especially those complementing insecticide application with greater community involvement, may be more optimal and cost-effective strategies (Vazquez-Prokopec et al. 2009).
Many control measures against infectious diseases, including drug treatments, vaccines and behavioural interventions, are impermanent and depend on careful implementation for their success. The present work addresses the spatio-temporal ordering for the control of an existing problem; adapting these, or other, travelling salesman algorithms for more traditional SIR (Anderson & May 1991) models may provide a valuable tool to curb the emergence of new disease transmission cycles. The problems related to controlling dengue and other urban vector-borne infections are the most directly analogous to those of controlling Chagas vectors. In addition, the methods presented here may also be useful in controlling directly transmitted infections.
Acknowledgements
We thank Robert Gilman, Caryn Bern, Eleazar Cordova, Cesar Naquira, Hector Garcia, Lance Waller, Scott Duke-Sylvester, David Smith, Natalie Bowman, Cecile Viboud, Rajan Patel, Megan Christenson, Nicole Salemno, the croquisistas and all who helped on the ground in Arequipa, and members of the Plotkin lab. Funding for this study came from NIH K01 AI079162-02, NIH P50 AI074285-03 and NIH-NIDDK-08-007. J.B.P. also acknowledges funding from the Burroughs Wellcome Fund, the James S. McDonnell Foundation, the Alfred P. Sloan Foundation and the David and Lucile Packard Foundation.
References
- Anderson R. M., May R. M. 1991. Infectious diseases of humans: dynamics and control. Oxford, UK: Oxford University Press. [Google Scholar]
- Applegate D. L. 2007. The traveling salesman problem: a computational study. Princeton, NJ: Princeton University Press. [Google Scholar]
- Cecere M. C., Vazquez-Prokopec G. M., Gurtler R. E., Kitron U. 2004. Spatio-temporal analysis of reinfestation by Triatoma infestans (Hemiptera: Reduviidae) following insecticide spraying in a rural community in northwestern Argentina. Am. J. Trop. Med. Hyg. 71, 803–810. [PMC free article] [PubMed] [Google Scholar]
- Cecere M. C., Vasquez-Prokopec G. M., Gurtler R. E., Kitron U. 2006. Reinfestation sources for Chagas disease vector, Triatoma infestans, Argentina. Emerg. Infect. Dis. 12, 1096–1102. [DOI] [PMC free article] [PubMed] [Google Scholar]
- Cormen T. H., Cormen T. H. 2001. Introduction to algorithms. Cambridge, MA: MIT Press. [Google Scholar]
- Davis G. B. 1999. The Blackwell encyclopedic dictionary of management information systems. Malden, MA: Blackwell Business. [Google Scholar]
- Dias J. C., Silveira A. C., Schofield C. J. 2002. The impact of Chagas disease control in Latin America: a review. Mem. Inst. Oswaldo Cruz 97, 603–612. ( 10.1590/S0074-02762002000500002) [DOI] [PubMed] [Google Scholar]
- Dohna H. Z., Cecere M. C., Gurtler R. E., Kitron U., Cohen J. E. 2007. Re-establishment of local populations of vectors of Chagas disease after insecticide spraying. J. Appl. Ecol. 44, 220–227. ( 10.1111/j.1365-2664.2006.01243.x) [DOI] [PMC free article] [PubMed] [Google Scholar]
- Forster G. A., Gilligan C. A. 2007. Optimizing the control of disease infestations at the landscape scale. Proc. Natl Acad. Sci. USA 104, 4984–4989. ( 10.1073/pnas.0607900104) [DOI] [PMC free article] [PubMed] [Google Scholar]
- Gurevitz J. M., Ceballos L. A., Kitron U., Gurtler R. E. 2006. Flight initiation of Triatoma infestans (Hemiptera: Reduviidae) under natural climatic conditions. J. Med. Entomol. 43, 143–150. ( 10.1603/0022-2585(2006)043[0143:FIOTIH]2.0.CO;2) [DOI] [PMC free article] [PubMed] [Google Scholar]
- Gurtler R. E., Kitron U., Cecere M. C., Segura E. L., Cohen J. E. 2007. Sustainable vector control and management of Chagas disease in the Gran Chaco, Argentina. Proc. Natl Acad. Sci. USA 104, 16 194–16 199. ( 10.1073/pnas.0700863104) [DOI] [PMC free article] [PubMed] [Google Scholar]
- Gutin G., Punnen A. P. 2002. The traveling salesman problem and its variations. Dordrecht, The Netherlands: Kluwer Academic Publishers. [Google Scholar]
- Larranaga P., Kuijpers C. M. H., Murga R. H., Inza I., Dizdarevic S. 1999. Genetic algorithms for the travelling salesman problem: a review of representations and operators. Artif. Intell. Rev. 13, 129–170. ( 10.1023/A:1006529012972) [DOI] [Google Scholar]
- Levy M. Z., Bowman N. M., Kawai V., Waller L. A., Cornejo del Carpio J. G., Cordova Benzaquen E., Gilman R. H., Bern C. 2006. Periurban Trypanosoma cruzi-infected Triatoma infestans, Arequipa, Peru. Emerg. Infect. Dis. 12, 1345–1352. [DOI] [PMC free article] [PubMed] [Google Scholar]
- Levy M. Z., et al. 2007. Targeted screening strategies to detect Trypanosoma cruzi infection in children. PLoS Negl. Trop. Dis. 1, e103 ( 10.1371/journal.pntd.0000103) [DOI] [PMC free article] [PubMed] [Google Scholar]
- Levy M. Z., et al. 2008. Impregnated netting slows infestation by Triatoma infestans. Am. J. Trop. Med. Hyg. 79, 528–534. [PMC free article] [PubMed] [Google Scholar]
- Lorca M., Garcia A., Contreras M. C., Schenone H., Rojas A. 2001. Evaluation of a Triatoma infestans elimination program by the decrease of Trypanosoma cruzi infection frequency in children younger than 10 years, Chile, 1991–1998. Am. J. Trop. Med. Hyg. 65, 861–864. [DOI] [PubMed] [Google Scholar]
- Marcet P. L., Mora M. S., Cutrera A. P., Jones L., Gurtler R. E., Kitron U., Dotson E. M. 2008. Genetic structure of Triatoma infestans populations in rural communities of Santiago del Estero, northern Argentina. Infect. Genet. Evol. 8, 835–846. ( 10.1016/j.meegid.2008.08.002) [DOI] [PMC free article] [PubMed] [Google Scholar]
- McPake B., Kumaranayake L., Normand C. E. M. 2002. Health economics: an international perspective. London, UK: Routledge. [Google Scholar]
- Openshaw S. 1983. The modifiable areal unit problem. Norwich, UK: Geo Books. [Google Scholar]
- Organizacion Panamericana de la Salud. 2006. Estimacion cuantitativa de la enfermedad de Chagas en las Americas. Montevideo, Uruguay: Organizacion Panamericana de la Salud; OPS/HDM/CD/425-06. [Google Scholar]
- Palomino M., Villaseca P., Cárdenas F., Ancca J., Pinto M. 2008. Eficacia y residualidad de dos insecticidas piretroides contra Triatoma infestans en tres tipos de viviendas. Evaluacion de campo en Arequipa, Perú. Rev. Peru Med. Exp. Salud Publica 25, 9–16. [Google Scholar]
- Patel R., Longini I. M., Jr, Halloran M. E. 2005. Finding optimal vaccination strategies for pandemic influenza using genetic algorithms. J. Theor. Biol. 234, 201–212. ( 10.1016/j.jtbi.2004.11.032) [DOI] [PubMed] [Google Scholar]
- Reinelt G. 1994. The traveling salesman: computational solutions for TSP applications. Berlin, Germany: Springer-Verlag. [Google Scholar]
- Remme J. H. F., et al. 2006. Tropical diseases targeted for elimination: Chagas disease, lymphatic filariasis, onchocerciasis, and leprosy. In Disease control priorities in developing countries (eds Jamison D. T., Breman J. G., Measham A. R., Alleyne G., Claeson M., Evans D. B., Jha P., Mills A., Musgrove P.), pp. 433–449. New York, NY: The World Bank and Oxford University Press. [PubMed] [Google Scholar]
- Rowthorn R. E., Laxminarayan R., Gilligan C. A. 2009. Optimal control of epidemics in metapopulations. J. R. Soc. Interface 6, 1135–1144. ( 10.1098/rsif.2008.0402) [DOI] [PMC free article] [PubMed] [Google Scholar]
- Silveira A., Vinhaes M. 1999. Elimination of vector-borne transmission of Chagas disease. Mem. Inst. Oswaldo Cruz 94(Suppl. 1), 405–411. ( 10.1590/S0074-02761999000700080) [DOI] [PubMed] [Google Scholar]
- Vazquez-Prokopec G. M., Ceballos L. A., Marcet P. L., Cecere M. C., Cardinal M. V., Kitron U., Gürtler R. E. 2006. Seasonal variations in active dispersal of natural populations of Triatoma infestans in rural north-western Argentina. Med. Vet. Entomol. 20, 273–279. ( 10.1111/j.1365-2915.2006.00637.x) [DOI] [PMC free article] [PubMed] [Google Scholar]
- Vazquez-Prokopec G. M., Spillmann C., Zaidenberg M., Kitron U., Gurtler R. E. 2009. Cost-effectiveness of Chagas disease vector control strategies in northwestern Argentina. PLoS Negl. Trop. Dis. 3, e363 ( 10.1371/journal.pntd.0000363) [DOI] [PMC free article] [PubMed] [Google Scholar]
- World Health Organization. 1994. Chagas disease: elimination of transmission. Wkly Epidemiol. Rec. 69, 38–40. [PubMed] [Google Scholar]
- World Health Organization. 2002. Control of Chagas disease: second report of the WHO expert committee. Geneva, Switzerland: World Health Organization. [Google Scholar]
- World Health Organization. 2003. Annex 2, Deaths by cause, sex and mortality stratum in WHO regions, estimates for 2002 In The world health report 2003. Geneva, Switzerland: World Health Organization. [Google Scholar]