Abstract
Dental healthcare workers (DHCWs) are at high risk of occupational exposure to droplets and aerosol particles emitted from patients' mouths during treatment. We evaluated the effectiveness of an air cleaner in reducing droplet and aerosol contamination by positioning the device in four different locations in an actual dental clinic. We applied computational fluid dynamics (CFD) methods to solve the governing equations of airflow, energy and dispersion of different-sized airborne droplets/aerosol particles. In a dental clinic, we measured the supply air velocity and temperature of the ventilation system, the airflow rate and the particle removal efficiency of the air cleaner to determine the boundary conditions for the CFD simulations. Our results indicate that use of an air cleaner in a dental clinic may be an effective method for reducing DHCWs' exposure to airborne droplets and aerosol particles. Further, we found that the probability of droplet/aerosol particle removal and the direction of airflow from the cleaner are both important control measures for droplet and aerosol contamination in a dental clinic. Thus, the distance between the air cleaner and droplet/aerosol particle source as well as the relative location of the air cleaner to both the source and the DHCW are important considerations for reducing DHCWs' exposure to droplets/aerosol particles emitted from the patient's mouth during treatments.
Keywords: indoor environment, computational fluid dynamics, droplets, aerosol particles, dental clinic, air cleaner
1. Introduction
Dental healthcare workers (DHCWs) are at a high risk of cross-infection due to frequent exposure to micro-organisms living in patients' blood, droplets of saliva and instruments contaminated with blood, saliva and tissue debris. These micro-organisms include pathogenic bacteria, viruses and fungi (Beltrami et al. 2000) and, in some instances, may be responsible for direct transmission of highly infectious diseases including Mycobacterium tuberculosis (TB), hepatitis B and C, staphylococci, herpes simplex virus 1 and 2 and the human immunodeficiency virus (HIV; Centers for Disease Control and Prevention 1993; Anders et al. 1998; Araujo & Andreana 2002). In addition, exposure to viruses that cause upper respiratory infections such as mumps, influenza and rubella also poses a considerable health risk to DHCWs (Beltrami et al. 2000; Araujo & Andreana 2002).
Transmission of infection during dental treatment or surgery can occur through several routes: direct contact with blood, saliva or tissue debris; indirect contact with contaminated instruments or surfaces that have been improperly sterilized; or contact with infective agents present in either the droplets or aerosol particles from saliva and respiratory fluids (Centers for Disease Control and Prevention 1993). During dental treatments, saliva may become aerosolized and micro-organisms from the oral cavity will contribute to the spread of infection (Askarian et al. 2005). Dental drills and ultrasonic scalers, both of which are combined with a water spray, generate a mass of droplets/aerosol particles containing body fluids (e.g. saliva, blood and dental plaque) and microbes (Centers for Disease Control and Prevention 1993; Legnani et al. 1994; Bennett et al. 2000; Cellini et al. 2001). These contaminated droplets/aerosol particles may transfer from the patient's mouth to the breathing zone or body surface of DHCWs, thereby contributing to the spread of infections (Centers for Disease Control and Prevention 1993; Beltrami et al. 2000; Araujo & Andreana 2002). Thus, measures that control the dispersion of droplets and aerosol particles emitted from patients' mouths may minimize the risk of cross-infection in dental clinics.
Ventilation systems may be one effective method for controlling the transmission of airborne infectious diseases in indoor environments. Previous research indicates that the airflow pattern plays an important role in preventing and controlling airborne infectious disease outbreaks in hospitals (Li et al. 2005, 2007). As a room's airflow pattern is largely determined by ventilation strategy, it is reasonable to suggest that the use of a proper ventilation system is an effective method for controlling the risk of cross-infection in hospitals. Downward ventilation systems are widely used in airborne infection isolation rooms and have been recommended by both the American Society of Heating, Refrigerating and Air-Conditioning Engineers (ASHRAE 2003) and the Centers for Disease Control and Prevention (2003).
Though dental clinics pose similar cross-infection risks for patients and DHCWs, there is a lack of guidelines for the design of ventilation systems in these settings. As central air conditioning systems are the predominant systems used in dental clinics, cross-infection between occupants in different rooms may occur through the mixing of return air. Use of an air cleaner may be one approach for controlling droplet/aerosol particle dispersion in dental clinics.
The specific placement of the air cleaner is an important factor influencing its controlling effect on droplet/aerosol particle dispersion. Offermann et al. (1985) found that the location of an air cleaner in a room as well as the level of air mixing resulted in statistically significant changes in performance of air cleaner. Novoselac & Siegel (2009) investigated the impact of portable air cleaner placement in multi-zone residential areas. To our knowledge, however, this is the first study to investigate the effectiveness of an air cleaner in controlling the dispersion of droplets/aerosol particles emitted from patient's mouth inside a dental clinic. Specifically, we evaluate the impact of the air cleaner's placement in the dental clinic room on droplet/aerosol particle dispersion.
Determining the probability that particles emitted from a patient's mouth will contact a DHCW is an important step in understanding the potential risk of cross-infection for DHCWs in dental clinics. Our study therefore aims to quantify the number of airborne particles emitted from a patient's mouth that will enter the breathing zone or reach the body surface of a DHCW in a real dental clinic. We further aim to determine the most effective positioning of an air cleaner inside a dental clinic for reducing DHCWs’ exposure to airborne contaminants.
We conducted our particle measurements in a Beijing dental clinic. Previous studies indicate that engineering simulations using computational fluid dynamics (CFD) are a valid method for investigating airflow behaviour, temperature distribution and contaminant dispersion in hospital rooms using different ventilation systems (Chow & Yang 2005; Cheong & Phua 2006; Kao & Yang 2006; Qian et al. 2006; Beggs et al. 2008; Chao et al. 2008; Richmond-Bryant 2009). We therefore used CFD methods to analyse the dispersion of different sized airborne droplets/aerosol particles emitted from the patient's mouth during dental treatments. Qian et al. (2006) investigated the dispersion of exhaled droplet nuclei in a two-bed hospital ward using different ventilation systems to identify ventilation methods that best minimize the risk of cross-infection. Chow & Yang (2005) examined the effectiveness of the ‘laminar’ flow released from an ultra-clean ventilation system in protecting both surgeons and patients in hospital operating rooms. To better protect healthcare workers during patient care, Cheong & Phua (2006) analysed the airflow and pollutant distribution patterns in a ‘negative pressure’ isolation room using three different ventilation strategies. However, few studies have investigated contaminant dispersion in the specific indoor environment of dental clinics despite the large number of droplets/aerosol particles generated during dental treatments. Air cleaners may be an alternative and easily implemented approach for controlling droplet/aerosol particle dispersion in dental clinics. The present study uses measurements conducted in an actual dental clinic together with numerical simulation by CFD to examine the control of droplet/aerosol particle dispersion by an air cleaner.
To determine the boundary conditions for the CFD simulations, we measured the supply air velocity and temperature of the ventilation system, the airflow rate and, finally, the particle removal efficiency of the air cleaner inside the dental clinic. We compared the calculated results of five cases (one with the air cleaner turned off and four with the air cleaner placed in different locations in the clinic) to determine the most effective positioning of the air cleaner for minimizing DHCWs’ occupational exposure to airborne contaminants.
2. Numerical methods
2.1. Airflow model
It is important to accurately simulate the airflow field because particle motion is determined by various forces exerted by airflow and gravity. We adopted the renormalization group (RNG) k–ϵ turbulence model (Choudhury 1993) to simulate average turbulent indoor airflow based on results from Chen (1995) suggesting that it is suitable for indoor airflow simulation, We used the Fluent program to solve the governing equations for fluid flow (Fluent Inc. 2005). A grid independence test was conducted by repeatedly calculating the same mode with finer grids until the calculated results varied little by grid during the simulation. The tested grid densities and their relative errors in all the studied cases are shown in table 1. We calculated the grid convergence index (GCI) to determine the relative error of the grid independence test using a method based on the Richardson extrapolation method (Richardson 1910) and suggested by Roache (1994)
| 2.1 |
where Fs = 3, p = 2; r is the ratio of fine to coarse grid; εrms is defined as
 |
2.2 |
where εi,u is defined as
| 2.3 |
where u is the velocity magnitude. The solutions of u at 64 points which are uniformly distributed in the spatial space are selected in both the coarse and fine grid cases. The values of GCI(u) are all less than 5.2 per cent, indicating that the grids are sufficiently fine. The simulation results presented in the following section are based on the grids (2) listed in table 1.
Table 1.
Grid covergence index (GCI) and particle number test.
| no. | grid independence tests | GCI (u), % | droplet/aerosol particle size | number of tested droplets/aerosol particles | relative error, % (0.3 µm) | relative error, % (0.5 µm) | relative error, % (1 µm) | relative error, % (2 µm) | relative error, % (10 µm) | relative error, % (20 µm) |
|---|---|---|---|---|---|---|---|---|---|---|
| case 0 | amount of grids (1): 99 123 amount of grids (2): 208 493 | 3.1 | 0.3, 0.5, 1, 2, 10 and 20 µm | 40 000; 80 000; 120 000 | 0.30 | 0.18 | 0.06 | 0.24 | 0.10 | 0.04 |
| amount of grids (2): 208 493 amount of grids (3): 320 930 | 3.0 | |||||||||
| case 1 | amount of grids (1): 102 525 amount of grids (2): 208 493 | 4.7 | 0.08 | 0.14 | 0.08 | 0.11 | 0.04 | 0.09 | ||
| amount of grids (2): 208 493 amount of grids (3): 301 616 | 5.2 | |||||||||
| case 2 | amount of grids (1): 97 016 amount of grids (2): 191 823 | 4.2 | 0.20 | 0.44 | 0.58 | 0.09 | 0.11 | 0.03 | ||
| amount of grids (2): 191 823 amount of grids (3): 311 229 | 4.3 | |||||||||
| case 3 | amount of grids (1): 98 050 amount of grids (2): 203 158 | 5.0 | 0.14 | 0.12 | 0.05 | 0.05 | 0.02 | 0.02 | ||
| amount of grids (2): 203 158 amount of grids (3): 320 973 | 4.2 | |||||||||
| case 4 | amount of grids (1): 101 592 amount of grids (2): 209 666 | 3.3 | 0.26 | 0.31 | 0.07 | 0.18 | 0.16 | 0.11 | ||
| amount of grids (2): 209 666 amount of grids (3): 301 783 | 5.2 |
2.2. Particle dispersion model
Recent studies validate the successful application of both Eulerian and Lagrangian approaches in simulating airborne particle transport in similar indoor environments (Lai & Cheng 2007; Zhang & Chen 2007; Gao et al. 2008; Lai et al. 2008; Zhao et al. 2008). We used the Lagrangian approach which tracks the particle trajectory (Chao et al. 2008; Gao et al. 2008) and is more appropriate for the aims of our study.
We treated the droplets as droplet nuclei (i.e. evaporated droplets). Droplets less than 100 µm in diameter will evaporate within a very short time period after being emitted from a patient's mouth (Wells 1934). Chen & Zhao (in press) determined that the impact of evaporation on droplet dispersion in this diameter range in an indoor environment was inconsequential. The size distribution of the human-exhaled droplets was reported in a number of studies and reviews (Nicas et al. 2005; Morawska 2006). While several studies found that the majority of droplets generated by human expiratory activities fall within the super-micrometre size range (Wells 1934; Jennison 1942; Duguid 1945; Loudon & Roberts 1967), a recent study by Chao et al. (2009) reported that expiratory droplets that are in close proximity to subjects’ mouths also fall into the super-micrometre size range. A recent study by Yang et al. (2007) reports that the droplet size ranges from 0.6 to 16 µm, with an average size of 8.35 µm during coughing. Still other studies indicate that the majority of human-exhaled droplets fall within sub-micrometre size range (Papineni & Rosenthal 1997; Morawska et al. 2009). This discrepancy is attributable to differences in instrument and measurement methodologies used in these studies. In particular, the size of droplets/aerosol particles generated during dental treatments is reported in several existing publications. Prospero et al. (2003) indicate that most particles generated during dental treatments have diameters of less than 5 µm. Rudolph et al. (1969) suggested that bacterial aerosol particles generated during dental treatments range from 0.5 to 10 µm. Dimmick (1969) found that aerosol particles generated during dental treatments are in the range 0.5–20 µm. Thus, it is reasonable to treat the droplets as droplet nuclei in this study. The trajectory of each particle can be calculated using the momentum equation based on Newton's law
 |
2.4 |
where  is the velocity vector of the particle;
  is the velocity vector of air;
  is the drag force per unit of particle mass; ρp and ρa are the particle and air density, respectively;
  is the gravitational acceleration vector, and
  stands for additional force per unit of mass.
The drag force can be calculated by
 |
2.5 |
where μa is fluid viscosity, dp is particle diameter, Re is the Reynolds number and CD is the drag coefficient. The mathematical expression of the drag coefficient CD can be found in the Fluent manual (Fluent Inc. 2005).
Results from Zhao et al. (2004) indicate that forces such as the Basset history, pressure gradient and virtual mass are negligible when compared with the drag force for fine indoor particles. In contrast, the Saffman lift and Brownian forces may be relatively large and were therefore included in our analysis. The mathematical expressions of the two forces can be found in the Fluent manual (Fluent Inc. 2005).
A stochastic discrete-particle approach was used to model the turbulent dispersion of particles. The trajectory equations for individual particles were predicted by integrating the trajectory equations with the instantaneous fluid velocity,  . The time-averaged velocity of the air
  is computed by solving the Reynolds averaged Navier–Stokes (RANS) equation with the RNG k–ϵ turbulence model. A discrete random walk (DRW) model was applied to determine the instantaneous velocity (
 ). The DRW model assumes that the fluctuating velocities follow a Gaussian probability distribution. The fluctuating velocity components,
  , are in the following equation:
 |
2.6 |
where k is the turbulent kinetic energy and ζ the normally distributed random number.
The fine particles in our study behave stochastically indoors due to turbulence fluctuation. As mentioned above, we used the DRW model to incorporate the stochastic characteristics of fine particles. For each simulation, we increased the number of emitted particle trajectories until the results yielded only small changes during simulations. The tests of tracked particle numbers for all cases are listed in table 1. The relative errors of these tests εp are calculated by
 |
2.7 |
where pi is the percentage of escaped/trapped particles during each particle number test, which is defined as
| 2.8 |
and
| 2.9 |
where Ntrapped,i, Nescaped,i and Nemitted,i are the number of droplets/aerosol particles reaching the surface, escaping from the inlets/outlets and emitted from the patient, respectively.
We tested three different particle numbers, so n is equal to 3.  is the average percentage of escaped particles, which is calculated by
| 2.10 |
We found that the relative errors between different tested particle numbers were less than 0.58 per cent. The calculated results shown in the following section are the statistically averaged values based on the different tested particle numbers since we used a stochastic approach.
The droplets/aerosol particles in the dental clinic containing pathogenic micro-organisms are potentially hazardous to DHCWs. Thus, the probability of particles reaching the body surface or entering the breathing zone of the DHCW is a critical metric for understanding DHCWs' exposure and, ultimately, quantifying the risk of disease attributable to droplets/aerosol particles under these conditions. To do this, we observe the dispersion characteristics of particles from a different viewpoint, by using ‘the percentage of droplets/aerosol particles reaching the body surface of the DHCW’ to evaluate the probability of particles from an ‘emitter’ (the patient) reaching the body surface and breathing zone of the ‘receptor’ (the DHCW).
2.3. Boundary conditions
For airflow simulation, all variables including air velocity, temperature and turbulent kinetic energy and its dissipation rate were defined at the supply inlet of the ventilation system as well as at the air cleaner. Outlet boundary conditions were set as the Neumann boundary condition; that is, mass flow boundaries were specified to ensure that the mass flow rate out of the flow domain corresponded with the mass flow rate into the domain. Standard logarithmic law wall functions (Launder & Spalding 1974) were adopted to show the connection of the solution variables at the near-wall cells and the corresponding quantities on the wall. The walls were stationary and adiabatic since the dental clinic we studied is situated in the inner zone of a building. We measured the supply inlet velocity and temperature and recorded the heat flux from lights and the air cleaner from their nameplates to determine the values of the corresponding boundary conditions.
For particle dispersion simulation, the particles' trajectories were terminated when they exited the clinic. Airborne particles typically attach to flat, rigid surfaces (Hinds 1982). Thus, we assumed that particles contacting the DHCW or patient will attach to his or her body surface, corresponding with the ‘trap’ boundary condition for particles contacting a wall.
To determine the boundary conditions, we measured both the airflow rate through the air cleaner and the air cleaner's particle removal efficiency in the dental clinic. These measurements are described in greater detail in the following section. A user-defined function was integrated into the model to correlate the particle numbers at the inlet of the air cleaner with those at the outlet, and thus determine the droplets/aerosol particles removal efficiency using Fluent (Fluent Inc. 2005).
The geometrical and particle sizes used in all the cases as well as the measured boundary conditions for air supply velocity and temperature, the flow rate through the air cleaner, and the particle removal efficiency of air cleaner are listed in table 2.
Table 2.
Cases studied.
| no. | dimensions of the simulated patient and DHCWb | size of the simulated dental clinica | size of the supply opening and exhausta | supply air velocity and temperaturea | size of openings of air cleanera | inlet velocity and temperature of the air cleanera | airflow rate of the air cleanera | removal efficiency of the air cleanera | wall heat fluxb | heat sources | location of the air cleaner |
|---|---|---|---|---|---|---|---|---|---|---|---|
| case 0 | total height: 1.73 m; body width: 0.3 m; body depth: 0.2 m; head fraction: 0.18; body fraction: 0.4 (exclusion of legs) | length (X): 4.0 m; width (Z): 3.0 m; height (Y): 2.7 m | supply opening: length (X): 0.3 m; width (Z): 0.3 m; exhaust: length (X): 0.5 m; width (Z): 0.3 m | velocity: 1.4 ± 0.1 m s−1; temperature: 20.0 ± 0.3°C | air supply opening: width (Z): 0.35 m; height (X): 0.25 m; air return opening: width (Z): 0.25 m; height (X): 0.6 m | n.a. | 0.35 ± 0.02 m3 s−1 | 0.3 µm: 52 ± 2%, 0.5 µm: 58 ± 2%, 1.0 µm: 59 ± 2%, 2.0 µm: 63 ± 2%, 10 µm: 100%, 20 µm: 100% | adiabatic: 0 W m−2 | patient/ DHCWb: 75 W per person; lightsc: 60 W per light, total 4 lights; air cleanerc: 135 W | 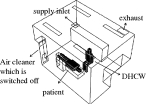 |
| case 1 | velocity: 4.0 ± 0.1 m s−1; temperature: 23.1 ± 0.3°C | 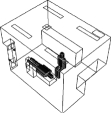 |
|||||||||
| case 2 | 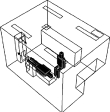 |
||||||||||
| case 3 | 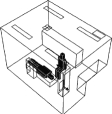 |
||||||||||
| case 4 | 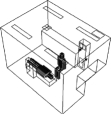 |
aMeasured.
bAssumed.
cRecorded from nameplates.
2.4. Measurement of the boundary conditions in the dental clinic
We performed measurements to determine the boundary conditions for precisely simulating the indoor environment and droplets/aerosol particles dispersion in the dental clinic. The hospital regulations for the dental clinic prohibit velocity and particle concentration measurements during patient treatment. Thus, we were limited to measurements in the late evening and only for boundary conditions. We measured the supply air velocity and temperature, aerosol particle sizes at different locations in the clinic, and the airflow rate of the air cleaner. The measurement results are shown in table 2.
We measured the air velocity and temperature of the dental clinic's supply inlet and the supply opening of the air cleaner using hot-sphere anemometers (RHAT-301). The anemometers can measure velocities within a range 0.05–5.00 m s−1 with a precision of 0.1 m s−1 or ±3 per cent, when velocity is faster than 0.1 m s−1. However, they are less precise when velocity falls below 0.1 m s−1. The accuracy of the temperature gauge is 0.3°C of the reading.
Two Fluke 983 optical particle counters (Fluke Inc. 2005) were used to measure the droplet/aerosol particle concentrations. The Fluke 983 simultaneously measures and records six channels of particle sizes (0.3–0.5, 0.5–10, 1, 2, 5–10 µm and more than or equal to 10 µm). The counter has a coincidence loss of 5 per cent when the particle concentration is 2 000 000 particles per cubic inch and a 100 per cent counting efficiency when the measured particle diameter is larger than 0.45 µm (Fluke Inc. 2005). We measured aerosol particle concentrations at both the supply opening and return opening of the air cleaner to determine the droplet/aerosol particle removal efficiency. We conducted these measurements at two locations in the clinic, initially at the centre of the room (X = 2 m, Y = 1.7 m, Z = 1.5 m) and then at a location closer to the wall (X = 3.5 m, Y = 1.7 m, Z = 2 m). We conducted measurements at four locations (including the supply opening and return opening of the air cleaner) in the clinic room, which we believe is sufficient for assessing the sizes of droplets/aerosol particles present in this environment.
Based on our measurements conducted in the late evening, the droplets/aerosol particles are less than 2 µm in diameter. Larger droplets/aerosol particles may have been generated during the dental treatments but deposited more quickly. Therefore, these larger droplets/aerosol particles were not detected in the late evening several hours after dental treatments had finished. Also, it is difficult to determine the fraction of the detected particles produced by the dental work as we were unable to conduct measurements during patient treatment. Fortunately, the size of droplets/aerosol particles typically generated during dental treatments is previously reported in the literature as mentioned in Prospero et al. (2003), less than 5 µm; Rudolph et al. (1969), 0.5–10 µm; Dimmick (1969), 0.5–20 µm. Based on these results, we chose to study six groups of particle sizes: 0.3, 0.5, 1, 2, 10 and 20 µm.
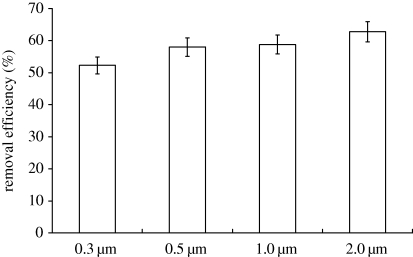
The air cleaner (SOTO-AE/COD601F) used in the dental clinic is an upright air cleaner. An antibiotic per-filter, a two-stage electrostatic precipitator and a P-activated carbon filter are installed in sequence into the air cleaner in order to capture droplets/aerosol particles. The results for particle removal efficiency show that the droplet/aerosol particle removal efficiencies for different particle diameters (0.3, 0.5, 1 and 2 µm) fall within the range 50–65% (figure 1). Riley et al. (2002) indicated that, when the particle diameter is greater than 10 µm, the particle removal efficiency of this kind of air cleaner (i.e. an air cleaner with a filter efficiency higher than that of an ASHRAE 40% filter) is 100 per cent. The corresponding clean air delivery rates (CADR) are 659 m3 h−1 (0.3 µm), 731 m3 h−1 (0.5 µm), 741 m3 h−1 (1 µm), 791 m3 h−1 (2 µm), 1260 m3 h−1 (10 µm) and 1260 m3 h−1 (20 µm).
Figure 1.
Measured data of the air cleaner's removal efficiency.
2.5. Validation of the numerical model
As noted above, clinical regulations limited our ability to perform long-term, detailed measurements in the dental clinic. Thus, we were unable to validate the numerical model in the clinic and we could only collect data for the boundary conditions of numerical simulation. However, the numerical model used in this study has been validated against measurements in several previous studies. For instance, Zhao et al. (2009) carried out full-scale measurements in a protective environment to validate the numerical model and found that the simulated results were in agreement with the measurements; Zhao et al. (2008) indicated that the simulated particle concentration with the numerical model was in agreement with the experimental data in a ventilation chamber found in previously published literature; Chen & Zhao (in press) further validated the model using previously published data on measured droplet dispersion in indoor environments, finding satisfactory agreement. The dispersion characteristics of droplets/aerosol particles strongly depend on the effect of indoor airflow. Thus, a key feature of the model validation is the droplet/aerosol particle dispersion in indoor airflow, which has been previously validated in the three studies. Based on the measured boundary conditions, we are confident that the numerical model is appropriate for analysing the five cases described in the following section.
3. Case analyses
3.1. Case descriptions
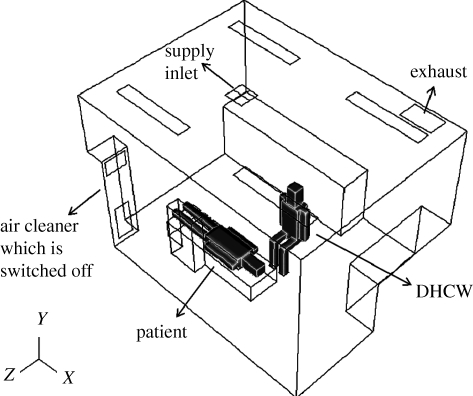
Based on interviews with DHCWs and dental clinic-based observations, we ascertained that the DHCW is typically sitting next to a reclined patient during dental treatments. The base DHCW–patient interaction case (case 0) in the dental clinic is where the air cleaner is switched off (figure 2). The size of the actual dental clinic is length (X) × width (Z) × height (Y) =4.0 × 3.0 × 2.7 m. The ventilation mode is ceiling supply and ceiling return and is integrated into the building's central air conditioning system. The dimensions of the simulated DHCW, patient, supply inlet, exhaust and air cleaner are provided in table 2.
Figure 2.
Schematic of the dentist office in case 0.
We placed the air cleaner in four different locations in the clinic. The exact placement is depicted in table 2.
— Case 1: on the wall in the corner of the clinic. This case corresponds with the measurements performed in the dental clinic. We learned from discussions with DHCWs that placement of air cleaners in this location is typically for convenience and conserving space rather than for reducing the risk of airborne infection.
— Case 2: near the patient's feet. The airflow supplied by air cleaner flows in X direction.
— Case 3: near the patient's head. The air cleaner is closest to the droplet/aerosol particle source (i.e. the patient's mouth) in this case.
— Case 4: behind the DHCW. Unlike the other cases, the air emitted from the air cleaner flows in Z direction.
There are two primary routes of airborne infection in dental clinics. The first is respiratory infection via droplet/aerosol particle inhalation and the second is contact infection via droplets/aerosol particles adhering to the DHCW's body. We calculated the probability that a droplet/aerosol particle will enter the breathing zone or reach the body surface of the DHCW based on the droplet/aerosol particle's dispersion trajectory using the Lagrangian model.
The breathing zone in this study refers to the roughly 10 cm area around the DHCW's face. Richmond-Bryant (2009) found that particle velocity is reduced to 5 per cent of inhaled velocity within this area. We assumed that airborne droplets/aerosol particles were continuously emitted from the patient's mouth. We also assumed that the droplets/aerosol particles were spherical as the ‘dynamic shape factor’ enables us to incorporate the dynamic characteristic of non-spherical particles into the model (Hinds 1982). Thus, particle density can be regarded as aerodynamic with a density of 1000 kg m−3.
The rotational speed of dental drills used in this clinic is 30 000 r.p.m. and the vibration frequency of ultrasonic scalers is 30 000 Hz, both of which fall within the standard ranges. The initial velocity of droplets/aerosol particles emitted from the patient's mouth during dental treatments v0 can be estimated as under 30 m s−1 based on the rotational speed and vibration frequency. The stopping distance S, which reflects the impact of initial velocity of droplets/aerosol particles during airborne transport, is calculated by (Hinds 1982)
| 3.1 |
where τp is the relaxation time of a droplet/aerosol particle, which is calculated by (Hinds 1982)
 |
3.2 |
where CC is the Cunningham slip correction factor.
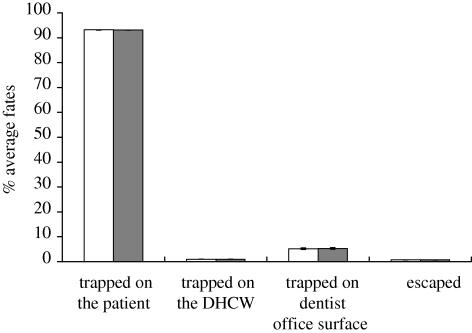
The calculated stopping distances for the modelled droplets/aerosol particles are listed in table 3. The stopping distances are less than 4 cm (a lower initial velocity will result in a shorter stopping distance). The fate of 20 µm droplets/aerosol particles calculated with an initial velocity of 1 m s−1 is quite similar to those calculated with an initial velocity of 30 m s−1 in case 0 (figure 3). Elaborating further, ‘trapped on the patient’ in figure 3 means that the percentage of emitted particles either depositing on the patient's body surface or his/her face. The aerosol particles in other cases have similar characteristics which are not repeated here due to length limitations. Thus, the impact of the initial velocity of droplets/aerosol particles on particle dispersion within this range is negligible. We used 30 m s−1 as the initial velocity for the following analysis.
Table 3.
Stopping distances.
| droplet/aerosol particle diameter (μm) | relaxation time (s) | initial velocity (m s−1) | stopping distance (cm) |
|---|---|---|---|
| 20 | 1.24E−03 | 30 | 3.720 |
| 10 | 3.12E−04 | 30 | 0.936 |
| 2 | 1.42E−05 | 30 | 0.043 |
| 1 | 3.84E−06 | 30 | 0.012 |
| 0.5 | 1.11E−06 | 30 | 0.003 |
| 0.3 | 4.72E−07 | 30 | 0.001 |
Figure 3.
Comparison of average fates of droplets/aerosol particles calculated with an initial velocity of 1 m s−1 (white bars) and 30 m s−1 (black bars; 20 µm in case 0).
3.2. Analysis and results
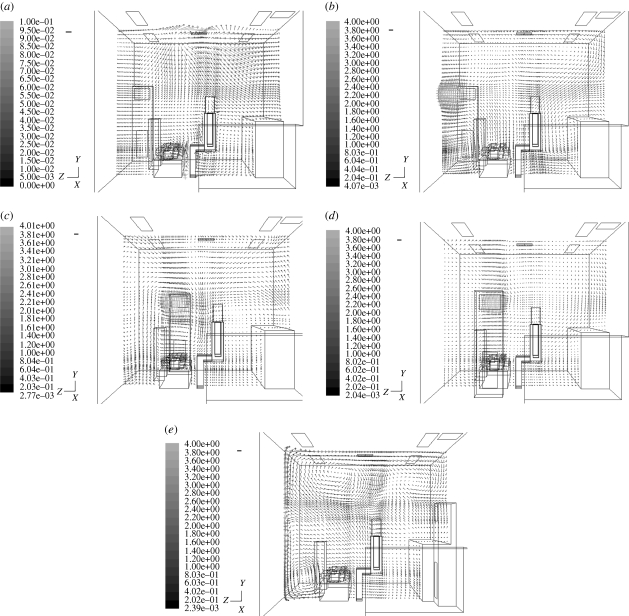
Since droplet/aerosol particle motion is largely determined by airflow, we first analysed the velocity distribution in the dental clinic. The velocity in case 0 (the air cleaner is turned off) is much smaller than in other cases (figure 4a). The operation of an air cleaner results in faster indoor air velocity and enhances the mixing and convection in the clinic. Further, we found that the positioning of the air cleaner affects velocity distributions and that placement of the air cleaner in different locations may result in different droplet/aerosol particle dispersion in the indoor environment (figure 4b–e).
Figure 4.
Velocity distribution for each case at X = 2.2 m. (a) Case 0, (b) case 1, (c) case 2, (d) case 3 and (e) case 4. Scale bar, (a) 0.1 m s−1; (b–e) 0.5 m s−1.
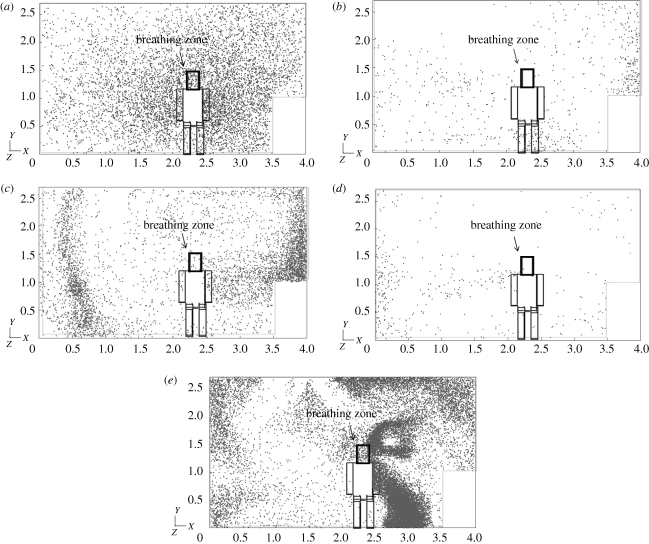
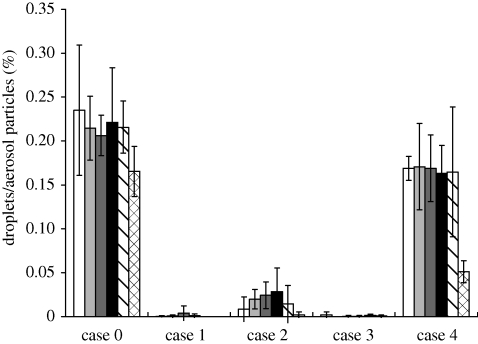
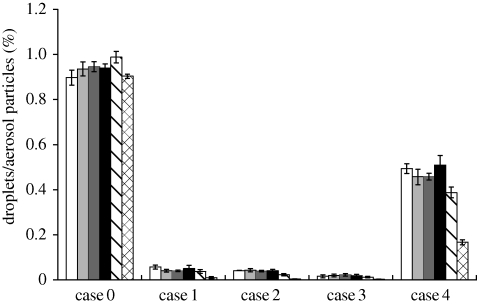
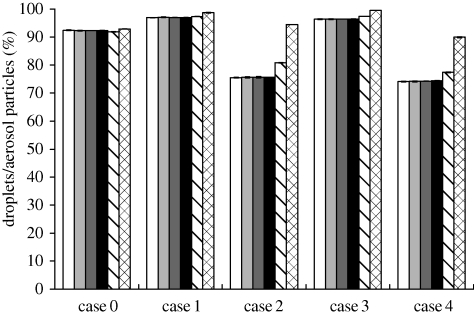
Figure 5 shows the simulated droplet/aerosol particle distribution near the DHCW's breathing zone after being emitted from the patient's mouth. Since there was little difference between the results of different particle sizes less than 2 µm, we present the results for only one particle size (0.3 µm) for each case (we plotted the fates in figures 6–9 without showing the distribution of all studied particle sizes for the purpose of shortening the article length). Figures 6 and 7 show the percentage of droplets/aerosol particles entering the breathing zone and reaching the body surface of the DHCW in each case. We performed DRW simulation of droplet/aerosol particle trajectories that incorporated the effect of turbulent fluctuating velocity on droplet/aerosol particle dispersion. Thus, these percentages can be regarded as the probability of a droplet/aerosol particle entering the breathing zone or reaching the body surface of the DHCW.
Figure 5.
Droplet/aerosol particle dispersion near the breathing zone of the DHCW (0.3 µm). (a) Case 0, (b) case 1, (c) case 2, (d) case 3 and (e) case 4.
Figure 6.
Percentage of droplets/aerosol particles entering the breathing zone of the DHCW. White bar, 0.3 μm; light grey bar, 0.5 μm; dark grey bar, 1 μm; black bar, 2 μm; striped bar, 10 μm; checked bar, 20 μm.
Figure 7.
Percentage of droplets/aerosol particles reaching the body surface of the DHCW. White bar, 0.3 μm; light grey bar, 0.5 μm; dark grey bar, 1 μm; black bar, 2 μm; striped bar, 10 μm; checked bar, 20 μm.
Figure 8.
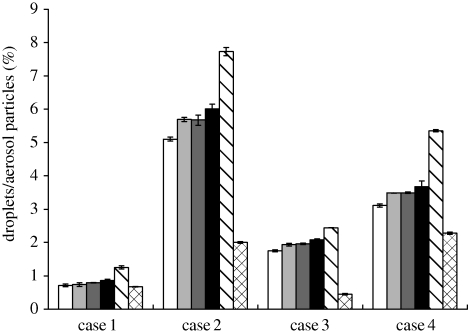
Percentage of droplets/aerosol particles removed by the air cleaner. White bar, 0.3 μm; light grey bar, 0.5 μm; dark grey bar, 1 μm; black bar, 2 μm; striped bar, 10 μm; checked bar, 20 μm.
Figure 9.
Percentage of droplets/aerosol particles trapped by the patient (either the body surface or the face). White bar, 0.3 μm; light grey bar, 0.5 μm; dark grey bar, 1 μm; black bar, 2 μm; striped bar, 10 μm; checked bar, 20 μm.
The results show that the fate of droplets/aerosol particles generated from the patient's mouth is size-dependent. When particle diameter is less than 2 µm, the results for droplets/aerosol particles of different sizes are similar. However, for particles with diameters of 10 and 20 µm, the results are quite different from the fine particles. Over 90 per cent of particles 20 µm in diameter are trapped by either the body surface or face of the patient in all the cases (figure 9). Therefore, the probability of a particle with a diameter of 20 µm entering the DHCW's breathing zone or reaching the body surface or removal by the air cleaner is relatively small in all the cases. For particles with a diameter of 10 µm, the probability of removal by the air cleaner is higher than that of particles of other sizes (figure 8). Although the percentage of 10 µm particles entering the air cleaner is less than that of fine particles, the removal efficiency of 10 µm particles is much higher, resulting in a higher probability of removal by the air cleaner.
The results indicate that the percentage of droplets/aerosol particles entering the breathing zone or reaching the body surfaces of the DHCW is much higher when the air cleaner is switched off (figures 5–7). Thus, use of an air cleaner may be an effective method for reducing occupational exposure to airborne droplets/aerosol particles in the indoor environment of dental clinics. In addition, figures 5–7 indicate that the placement of the air cleaner will also affect droplet/aerosol particle dispersion. Case 3 is most effective in controlling droplet/aerosol particle dispersion, potentially because the air cleaner is close to the droplet/aerosol particle source and the relative position of the air cleaner, source and DHCW is suitable in this case. The airflow pattern in this case is more effective in removing the droplets/aerosol particles and, thus, preventing them from entering the DHCW's breathing zone. Case 4 is the least effective in controlling droplet/aerosol particle dispersion. A notably higher percentage of droplets/aerosol particles enter the breathing zone or reach the body surface of the DHCW in case 4 than in cases 1–3. Unlike the other cases, the air emitted from the air cleaner in case 4 flows in the Z direction and directs the airflow towards the DHCW's body. Therefore, the droplets/aerosol particles have a greater probability of entering the DHCW's breathing zone.
It should be noted that placement of the air cleaner closer to the source will not always result in a lower risk of cross-contamination. For instance, in this study, the air cleaner in case 2 (near the patient's feet) is placed closer to the source (patient's mouth) than that in case 1 (on the clinic's corner wall). However, figure 6 shows that the probability of droplets/aerosol particles entering the DHCW's breathing zone is greater in case 2 than in case 1. This is because that the air cleaner outlet in case 1 is furthest from the DHCW, causing air to flow away from him. Thus, the relative position of the air cleaner, source and DHCW is another key consideration on this issue. The risk of spreading the droplets to the DHCW not only depends on the distance between the air cleaner and source, but also on the relative position of the air cleaner, source and DHCW.
On the other hand, there are potentially negative implications of placing the air cleaner too close to either the patient or DHCW if airflow is directed towards the dental operation zone. For instance, the air cleaner in case 3 is closest to the source and is also the most effective in controlling droplet/aerosol particle dispersion of all cases. However, the air velocity in the dental operation zone is approximately 0.7 m s−1, which could interfere with dental procedures as well as decrease human body comfort. Therefore, placing the air cleaner too close to the dental operation zone is not a practical solution in this setting.
Figure 8 indicates that the probability of droplet/aerosol particle removal is highest in case 2, although case 3 best prevents droplets/aerosol particles from reaching the DHCW's breathing zone or body surface. This implies that the probability of droplet/aerosol particle removal by the air cleaner does not entirely characterize its effectiveness in controlling droplets/aerosol particle exposure. Figure 9 illustrates the fate of droplets/aerosol particles trapped by the patient (either the body surface or the face). The probability of droplets/aerosol particles being trapped by the patient is highest in case 3 where the outlet of the air cleaner is located below the patient. The airflow pushes most of the droplets/aerosol particles downward and they eventually become trapped on the patient's head. As a result, the probability of droplet/aerosol particle removal by the air cleaner is smaller during case 3 than during case 2; however, the control effect is better in case 3 as many of the droplet/aerosol particles are trapped by the patient. The main goal of controlling aerosol particle dispersion is to reduce occupational cross-infection. The probability of droplet/aerosol particle removal by the air cleaner is smaller in case 3 than in case 2. However, as the airflow pattern in case 3 is the most effective in reducing exposure to airborne droplets/aerosol particles, case 3 is the most effective in reducing occupational health risks for DHCWs. Our results show that both the probability of droplet/aerosol particle removal by the air cleaner as well as the impact of airflow should to be integrated into future analyses on the effectiveness of air cleaners in reducing risk of airborne contaminant exposure in dental clinics.
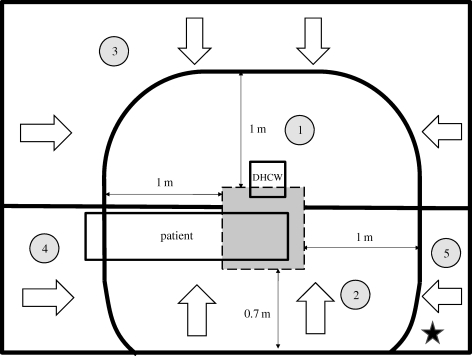
To give DHCWs a general idea on the suitability of the position of an air cleaner, we made a simple zoning map for guiding the position of an air cleaner in dental clinics (figure 10). According to the DHCWs’ experience, the distance from the air cleaner to the dental operation zone should be larger than 1 m for preventing the airflow influencing the dental operation process. Based on the above analysis, areas  and
and  are the zones where the air cleaner will influence the dental operation process. The suitable position of the air cleaner will make the airflow pass the DHCW first and then pass the source and finally go back to the air cleaner. It will better prevent droplets/aerosol particles from reaching the DHCW's breathing zone or body surface. According to this assertion, the areas
  ,
,  and
and  are the zones where the air cleaner will better control the dispersion of droplets/aerosol particles. Combining these two suggestions, the pentagram in figure 10 represents the general best position of the air cleaner in this case. This zoning map for guiding air cleaner placement in dental clinics provides general recommendations for safety procedures in dental clinics. More complicated scenarios could be analysed in a similar way with the assistance of a numerical modelling approach. However, as the studied DHCW–patient interaction scenario represents the most commonly observed case in real dental clinics, the guidance may be extended for actual application.
Figure 10.
General zoning map for guiding the position of an air cleaner in dental clinics. The grey square represents the dental operation zone. Arrows indicates the direction of airflow from the cleaner. Pentagram represents the general best position of the air cleaner in this case.  Influence of the dental operation process; poor droplet/aerosol particle controlling effect;
  influence of the dental operation process; good droplet/aerosol particle controlling effect;
  do not influence the dental operation process; poor droplet/aerosol particle controlling effect;
  do not influence the dental operation process; good droplet/aerosol particle controlling effect;
  do not influence the dental operation process; good droplet/aerosol particle controlling effect.
4. Discussion
We chose to model the cases with a DHCW sitting next to a reclined patient based on results from a survey of DHCWs as well as observational studies conducted in dental clinics during treatments. The results as well as the guiding map obtained in this study may be extended to the indoor environments of most dental clinics. However, we can extend the methods described here to analyse the effectiveness of air cleaners in controlling droplet/aerosol particle dispersion during other types of DHCW–patient interaction scenarios. As the DHCW is the concerned objective in this study, the change in the positioning of the DHCW will affect the conclusions due to the spatial dispersion of the aerosol/particles. It is hard to say how much the change in the position will affect the conclusions without more case studies. It is worth further investigations. Nevertheless, it is much easier to perform more cases in a similar way in this study.
The shape of the human body in these cases is not an exact replica of an actual human body. According to the study by Nielsen (2004), the influence of the shape of a human body on indoor airflow can be neglected except in studies focusing on local airflow around human bodies. Still, the potential effect of human body shape on droplet/aerosol particle dispersion near or around the body may be a topic for further study.
Particle measurements during dental treatments are prohibited by clinical regulations; therefore, the size distribution of the droplets/aerosol particles generated during the treatment is difficult to measure. This study aims to quantify the fate of droplets/aerosol particles through which we can better understand the dispersion characteristics and controlling effect of different sized particles. We chose the size range 0.3–20 µm based on previous dental treatment studies. After obtaining the size distribution of the droplets/aerosol particles, the exact size-dependent numbers of the droplets/aerosol particles entering the DHCW's breathing zone can be determined.
The size-dependent particle removal efficiency and the airflow rate of the air cleaner were measured in the dental clinic. CADR is the product of the particle removal efficiency and the airflow rate of the air cleaner, and the measured CADR was used for the numerical simulation in this real case. However, the impact of CADR on the droplet/aerosol particle dispersion control is also an important issue, which needs to be further studied in the future.
Besides, the droplets/aerosol particles deposited on the patient's face or body surface may resuspend into the air and then enter into the DHCW's breathing zone. This means that resuspension of contaminated droplets/aerosol particles may enhance the risk of cross-infection for DHCWs in dental clinics. Therefore, the effect of particle resuspension is an interesting topic which needs to be further studied.
This study is an important first step in understanding how use of an air cleaner can prevent airborne droplets/particles from contacting DHCWs in an occupational setting. In particular, this study provides a fundamental understanding of the effect of an air cleaner in reducing DHCWs' exposure to droplets/aerosol particles emitted from patient's mouth in a dental clinic. Combining this information with health studies on the probability of infection from droplets/aerosol particles entering DHCWs' breathing zone or contacting their body surface would enable analysis of the effect of an air cleaner on DHCWs' health.
5. Conclusions
This study used the numerical method to analyse the control of droplet/aerosol particle dispersion in dental clinics with use of an air cleaner. The following conclusions can be drawn from this research.
— Use of an air cleaner may be an effective method for reducing DHCWs' exposure to airborne droplets/aerosol particles in the indoor environment of dental clinics.
— The positioning of an air cleaner in the dental clinic is a particularly important consideration for controlling droplet/aerosol particle dispersion in dental clinics. Combining the placement of the air cleaner near the droplet/aerosol particle source and the suitable relative position of the air cleaner, source and DHCW is a particularly effective method for reducing DHCWs' exposure to droplets/aerosol particles emitted from a patient's mouth in a dental clinic.
— Consideration of only the probability of droplet/aerosol particle removal by the air cleaner does not sufficiently characterize the controlling effect of an air cleaner in dental clinics. The direction of airflow from the air cleaner is also important and both of these factors should be integrated into future analyses on this topic.
Acknowledgements
This study was supported by the National Natural Science Foundation of China (grant no. 50908127) and a grant from the National Key Technology Research and Development Program of China (project no. 2006BAJ02A10). The comments and edits made by Jill Baumgartner are highly appreciated.
References
- Anders P. L., Drinnan A. J., Thines T. J. 1998. Infectious diseases and the dental office. NY State Dental J. 64, 29–34. [PubMed] [Google Scholar]
- Araujo M. W. B., Andreana S. 2002. Risk and prevention of infectious diseases in dentistry. Quintessence Int. 33, 376–394. [PubMed] [Google Scholar]
- ASHRAE 2003. HVAC design manual for hospitals and clinics. Atlanta, GA: American Society of Heating Refrigerating and Air-Conditioning Engineers Inc. [Google Scholar]
- Askarian M., Mirraei K., Honarvar B., Etminan M., Araujo M. W. B. 2005. Knowledge, attitude and practice towards droplet and airborne isolation precautions among dental health care professionals in Shiraz, Iran. J. Public Health Dentistry 65, 43–47. ( 10.1111/j.1752-7325.2005.tb02785.x) [DOI] [PubMed] [Google Scholar]
- Beggs C. B., Kerr K. G., Noakes C. J., Hathway E. A., Sleigh P. A. 2008. The ventilation of multiple-bed hospital wards: review and analysis. Am. J. Infect. Control 36, 250–259. ( 10.1016/j.ajic.2007.07.012) [DOI] [PubMed] [Google Scholar]
- Beltrami E. M., Williams I. T., Shapiro C. N., Chamberland M. E. 2000. Risk and management of blood-born infections in health care workers. Clin. Microbiol. Rev. 13, 385–407. ( 10.1128/CMR.13.3.385-407.2000) [DOI] [PMC free article] [PubMed] [Google Scholar]
- Bennett A. M., Fulford M. R., Walker J. T., Bradshaw D. J., Martin M. V., Marsh P. D. 2000. Microbial aerosols in general dental practice. Br. Dental J. 189, 664–667. ( 10.1038/sj.bdj.4800859a) [DOI] [PubMed] [Google Scholar]
- Cellini L., Di Campli E., Di Candia M., Chiavaroli G. 2001. Quantitative microbial monitoring in a dental office. Public Health 115, 301–305. ( 10.1016/S0033-3506(01)00464-4) [DOI] [PubMed] [Google Scholar]
- Centers for Disease Control and Prevention 1993. Recommended infection control practices for dentistry. Morb. Mortal. Wkly Rep. Recomm. Rep. 42, 1–12. [PubMed] [Google Scholar]
- Centers for Disease Control and Prevention 2003. Guidelines for environmental infection control in health-care facilities. Atlanta, GA: US Department of Health and Human Services, Public Health Service, Centers for Disease Control and Prevention. [Google Scholar]
- Chao C. Y. H., Wan M. P., Sze To G. N. 2008. Transport and removal of expiratory droplets in hospital ward environment. Aerosol Sci. Technol. 42, 377–394. [Google Scholar]
- Chao C. Y. H., et al. 2009. Characterization of expiration air jets and droplet size distributions immediately at the mouth opening. J. Aerosol Sci. 40, 122–133. ( 10.1016/j.jaerosci.2008.10.003) [DOI] [PMC free article] [PubMed] [Google Scholar]
- Chen Q. 1995. Comparison of different k–ε models for indoor airflow computations. Numer. Heat Transfer Part B Fundamentals 28, 353–369. ( 10.1080/10407799508928838) [DOI] [Google Scholar]
- Chen C., Zhao B. In press Some questions on dispersion of human exhaled droplets in ventilation room: answers from numerical investigation. Indoor Air. ( 10.1111/j.1600-0668.2009.00626.x) [DOI] [PubMed] [Google Scholar]
- Cheong K. W. D., Phua S. Y. 2006. Development of ventilation design strategy for effective removal of pollutant in the isolation room of a hospital. Build. Environ. 41, 1161–1170. ( 10.1016/j.buildenv.2005.05.007) [DOI] [Google Scholar]
- Choudhury D. 1993. Introduction to the renormalization group method and turbulence modeling. Technical Memorandum no. TM-107. Fluent Inc., Lebanon, NH.
- Chow T. T., Yang X. Y. 2005. Ventilation performance in the operating theatre against airborne infection: numerical study on an ultra-clean system. J. Hosp. Infect. 59, 138–147. ( 10.1016/j.jhin.2004.09.006) [DOI] [PubMed] [Google Scholar]
- Dimmick R. L. 1969. Mechanics of aerosols in. In An introduction to experimental aerobiology (eds Dimmick R. L., Akers A. L.), p. 3 New York, NY: Wiley-Interscience. [Google Scholar]
- Duguid J. F. 1945. The numbers and the sites of origin of the droplets expelled during expiratory activities. Edin. Med. J. 52, 335–340. [PMC free article] [PubMed] [Google Scholar]
- Fluent Inc. 2005. Fluent 6.2 user's guide. Lebanon, NH: Fluent Inc. [Google Scholar]
- Fluke Inc. 2005. Manual for Fluke 983 optical particle counter. Everett, WA: Fluke Inc. [Google Scholar]
- Gao N. P., Niu J. L., Morawska L. 2008. Distribution of respiratory droplets in enclosed environments under different air distribution methods. Build. Simul. Int. J. 1, 326–335. ( 10.1007/s12273-008-8328-0) [DOI] [Google Scholar]
- Hinds W. C. 1982. Aerosol technology: properties, behavior, and measurement of airborne particles. New York, NY: Wiley. [Google Scholar]
- Jennison M. W. 1942. Aerobiology, p. 106 Washington, DC: American Association of Advanced Science. [Google Scholar]
- Kao P. H., Yang R. J. 2006. Virus diffusion in isolation rooms. J. Hosp. Infect. 62, 338–345. ( 10.1016/j.jhin.2005.07.019) [DOI] [PMC free article] [PubMed] [Google Scholar]
- Lai A. C. K., Cheng Y. C. 2007. Study of expiratory droplet dispersion and transport using a new Eulerian modeling approach. Atmos. Environ. 41, 7473–7484. ( 10.1016/j.atmosenv.2007.05.045) [DOI] [PMC free article] [PubMed] [Google Scholar]
- Lai A. C. K., Wang K., Chen F. 2008. Experimental and numerical study on particle distribution in a two-zone chamber. Atmos. Environ. 42, 1717–1172. ( 10.1016/j.atmosenv.2007.11.030) [DOI] [PMC free article] [PubMed] [Google Scholar]
- Launder B. E., Spalding D. B. 1974. The numerical computation of turbulent flows. Comput. Meth. Appl. Mech. Eng. 3, 269–289. ( 10.1016/0045-7825(74)90029-2) [DOI] [Google Scholar]
- Legnani P., Checci L., Pelliccioni G. A., D'Achille C. 1994. Atmospheric contamination during dental procedures. Quintessence Int. 25, 435–439. [PubMed] [Google Scholar]
- Li Y., Huang X., Yu I. T. S., Wong T. W., Qian H. 2005. Role of air distribution in SARS transmission during the largest nosocomial outbreak in Hong Kong. Indoor Air 15, 83–95. ( 10.1111/j.1600-0668.2004.00317.x) [DOI] [PubMed] [Google Scholar]
- Li Y. G., et al. 2007. Role of ventilation in airborne transmission of infectious agents in the built environment—a multidisciplinary systematic review. Indoor Air 17, 2–18. ( 10.1111/j.1600-0668.2006.00445.x) [DOI] [PubMed] [Google Scholar]
- Loudon R. G., Roberts R. M. 1967. Relation between the airborne diameter of respiratory droplets and the diameter of the stains left after recovery. Nature 213, 95–96. ( 10.1038/213095a0) [DOI] [Google Scholar]
- Morawska L. 2006. Droplet fate in indoor environments, or can we prevent the spread of infection? Indoor Air 16, 335–347. ( 10.1111/j.1600-0668.2006.00432.x) [DOI] [PubMed] [Google Scholar]
- Morawska L., Johnson G. R., Ristovski Z. D., Hargreaves M., Mengersen K., Corbett S., Chao C. Y. H., Li Y., Katoshevski D. 2009. Size distribution and sites of origin of droplets expelled from the human respiratory tract during expiratory activities. J. Aerosol Sci. 40, 256–269. ( 10.1016/j.jaerosci.2008.11.002) [DOI] [PMC free article] [PubMed] [Google Scholar]
- Nicas M., Nazaroff W. W., Hubbard A. 2005. Toward understanding the risk of secondary airborne infection: emission of respirable pathogens. J. Occup. Environ. Hygiene 2, 143–154. ( 10.1080/15459620590918466) [DOI] [PMC free article] [PubMed] [Google Scholar]
- Nielsen P. V. 2004. Computational fluid dynamics and room air movement. Indoor Air 14, 134–143. ( 10.1111/j.1600-0668.2004.00282.x) [DOI] [PubMed] [Google Scholar]
- Novoselac A., Siegel J. A. 2009. Impact of placement of portable air cleaning devices in multizone residential environments. Build. Environ. 44, 2348–2356. ( 10.1016/j.buildenv.2009.03.023) [DOI] [Google Scholar]
- Offermann F. J., Sextro R. G., Fisk W. J., Grimsrud D. T., Nazaroff W. W., Nero A. V. 1985. Control of respirable particles in indoor air with portable air cleaners. Atmos. Environ. 19, 1761–1771. [Google Scholar]
- Papineni R. S., Rosenthal F. S. 1997. The size distribution of droplets in the exhaled breath of healthy human subjects. J. Aerosol Med. 10, 105–116. ( 10.1089/jam.1997.10.105) [DOI] [PubMed] [Google Scholar]
- Prospero E., Savini S., Annino I. 2003. Microbial aerosol contamination of dental healthcare workers' face and other surfaces in dental practice. Infect. Control Hosp. Epidemiol. 24, 139–141. ( 10.1086/502172) [DOI] [PubMed] [Google Scholar]
- Qian H., Li Y., Nielsen P. V., Hyldgaard C. E., Wong T. W., Chwang A. T. Y. 2006. Dispersion of exhaled droplet nuclei in a two-bed hospital ward with three different ventilation systems. Indoor Air 16, 111–128. ( 10.1111/j.1600-0668.2005.00407.x) [DOI] [PubMed] [Google Scholar]
- Richardson L. F. 1910. The approximate arithmetical solution by finite differences of physical problems involving differential equations, with an application to the stresses in a masonry dam. Phil. Trans. R. Soc. Lond. A 210, 307–357. ( 10.1098/rsta.1911.0009) [DOI] [Google Scholar]
- Richmond-Bryant J. 2009. Transport of exhaled particulate matter in airborne infection isolation rooms. Build. Environ. 44, 44–55. [DOI] [PMC free article] [PubMed] [Google Scholar]
- Riley W. J., McKone T. E., Lai A. C. K., Nazaroff W. W. 2002. Indoor particulate matter of outdoor origin: importance of size dependent removal mechanisms. Environ. Sci. Technol. 36, 200–207. ( 10.1021/es010723y) [DOI] [PubMed] [Google Scholar]
- Roache P. J. 1994. Perspective: a method for uniform reporting of grid refinement studies. ASME J. Fluids Eng. 116, 405–413. ( 10.1115/1.2910291) [DOI] [Google Scholar]
- Rudolph E. M., Robert L. M., Maurice A. M., Gunnar R. 1969. Studies on dental aerobiology. I. Bacterial aerosols generated during dental procedures. J. Dental Res. 48, 49–56. [DOI] [PubMed] [Google Scholar]
- Wells W. F. 1934. On air-borne infection. Study II. Droplets and droplet nuclei. Am. J. Hygiene 20, 611–618. [Google Scholar]
- Yang S., Lee G. W. M., Chen C. M., Wu C. C., Yu K. P. 2007. The size and concentration of droplets generated by coughing in human subjects. J. Aerosol Med. 20, 484–494. ( 10.1089/jam.2007.0610) [DOI] [PubMed] [Google Scholar]
- Zhang Z., Chen Q. 2007. Comparison of the Eulerian and Lagrangian methods for predicting particle transport in enclosed spaces. Atmos. Environ. 41, 5236–5248. ( 10.1016/j.atmosenv.2006.05.086) [DOI] [Google Scholar]
- Zhao B., Zhang Y., Li X., Yang X., Huang D. 2004. Comparison of indoor aerosol particle concentration and deposition in different ventilated rooms by numerical method. Build. Environ. 39, 1–8. ( 10.1016/j.buildenv.2003.08.002) [DOI] [Google Scholar]
- Zhao B., Yang C., Yang X., Liu S. 2008. Particle dispersion and deposition in ventilated rooms: testing and evaluation of different Eulerian and Lagrangian models. Build. Environ. 43, 388–397. ( 10.1016/j.buildenv.2007.01.005) [DOI] [Google Scholar]
- Zhao B., Yang C., Chen C., Feng C., Yang X., Sun L., Gong W., Yu L. 2009. How many airborne particles emitted from a nurse will reach the breathing zone/body surface of the patient in ISO Class-5 single-bed hospital protective environments? A numerical analysis. Aerosol Sci. Technol. 43, 990–1005. ( 10.1080/02786820903107925) [DOI] [Google Scholar]


