Phytochromes are a family of photoreceptors found in plants, bacteria, and fungi that act as light-activated biological switches. They utilize covalently bound bilin chromophores that interconvert between two spectrally distinct conformers, a red (Pr) and far-red (Pfr) light-absorbing form,1 to drive signal transduction that ultimately controls growth and development.2 The phototransformation is both rapid and reversible, and is driven by a Z-to-E isomerization about the C15=C16 methine bridge between the C and D rings of the linear tetrapyrrole chromophore (see Figure 1).1,3 However, the molecular structural evolution along the Pr-to-Pfr reaction coordinate is not yet fully understood.
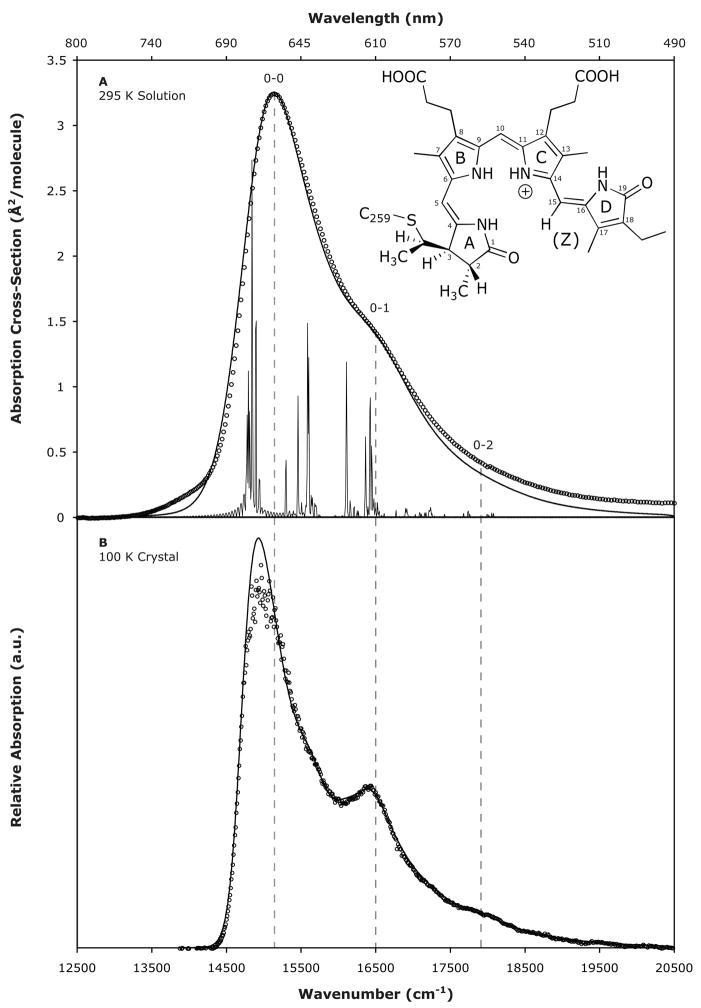
Figure 1.
Ultrafast transient absorption measurements on the cyanobacterial phytochrome Cph1, the plant phytochrome phyA, and the bacteriophytochrome Agp1 have been used to characterize the electronic changes in the Pr-to-Pfr transition.4–7 These studies revealed two excited-state lifetimes characterized by a short (5–16 ps) and a long (25–40 ps) time constant, indicating at least two Pr excited states, but it is unknown whether these multiple states originate from a heterogeneous ground-state population or multiple reaction intermediates formed from a single initial conformer. The shape of the absorption band (λmax = 660 nm), which features a distinct shoulder on the blue edge at ~620 nm (see Figure 1), has also attracted attention and has been interpreted by many as evidence for conformational heterogeneity of the ground state bilin chromophore population.8–10 Resolution of the ground-state bilin conformer population is of fundamental importance in elucidating the excited-state reaction pathway and ultimately the cause of the low 15% photoisomerization quantum yield.11
Here we investigate the Pr ground state of the cyanobacterial phytochrome Cph1 chromophore using resonance Raman intensity analysis to calculate the vibronic absorption profile. Measured resonance Raman intensities can be used to quantify the individual vibronic displacements that make up the Franck-Condon vibronic absorption spectrum. In this paper, we show that the absorption band profile including the prominent blue shoulder is due simply to vibronic transitions resulting from the absorption of a single Pr conformer of Cph1.
Recombinant Cph1 phytochrome (N514) was expressed and purified as described previously.12 Prior to spectroscopic studies, samples were dialyzed against 1 L buffer (25 mM TES-KOH, pH 8.0, 25 mM KCl, 10% glycerol) and then concentrated to 10.6 OD660/cm. For absolute Raman cross-section calibration, a standard solution of NaNO3 (250 mM) was used. The protein sample for measurement contained 1.25 × 10⁻⁴ M Cph1 in glycerol-containing TES buffer. The stimulated Raman spectrum was obtained using the experimental setup described by McCamant et al.14 (see Supporting Information (SI)).
The absolute Raman cross-sections of Cph1 were determined as described previously.15 Briefly, the differential cross sections of the Cph1 bands were calculated using the 1049 cm−1 glycerol C–OH stretch mode as an internal standard. The absolute Raman cross-sections were determined from Equation 1:
| (1) |
where the depolarization ratios, ρ, for all Cph1 bands were measured and found to be ~1/3.
Raman excitation profiles (REPs) were calculated using the time-dependent wavepacket formalism of resonance Raman scattering.16 The absorption cross-sections, σA, were determined by the Fourier transform of 〈i|i(t)〉, where |i〉 is the initial vibrational eigenstate on the ground electronic surface and |i(t)〉 is the vibrational wavefunction of the initial state propagating on the excited electronic surface. The Raman cross-sections, σR, were determined by the square of the half-Fourier transform of 〈f|i(t)〉, where |f〉 is the final vibrational eigenstate on the ground electronic surface (see SI). The time-dependent overlaps, 〈i|i(t)〉 and 〈f|i(t)〉, depend on the dimensionless parameter Δ, which is the displacement between the ground and excited electronic state harmonic minima. Relative delta values were initially estimated from the intensities of the observed vibrational bands assuming I ∝ω2Δ2.17 The overall scaling of Δ, homogeneous broadening ΓG, inhomogeneous broadening θ, zero-zero transition energy E0, and electronic transition length M were then adjusted to provide the best fits.
The experimental and calculated absorption spectra of Pr in solution (295 K) are presented in Figure 1A. The absorption cross-section is 3.25 Å2/molecule at the maximum, which was calculated based on the molar extinction coefficient ε660 = 85000 M−1 cm−1.18 The spectrum is dominated by the 0–0 vibronic transition and features a shoulder on the blue edge near 16500 cm−1, which is shown here to be the 0–1 vibronic transition. The absorption profile calculated using parameters derived from a 24-mode Raman intensity vibronic analysis (summarized in Table 1) agrees very well with the experimental spectrum. These parameters include an inhomogeneous broadening of 90 cm−1, a homogeneous broadening of 880 cm−1, and a zero-zero transition energy of 14800 cm−1. The minor baseline difference to the blue of 17250 cm−1 is attributed to a weak transition between the Qy band and the Soret band at 360 nm that was not taken into account in the calculations19,20 (see SI Figure S1).
Table 1.
Resonance Raman Cross-Sections of Cph1 (Pr)
| Frequency [cm−1] | Expt. cross-section [Å2 × 10⁻¹¹][a] | Calc. cross-section [Å2 × 10⁻¹¹] | Delta [unitless][b] |
|---|---|---|---|
| 50 | - | - | 0.80 |
| 502 | 3.11 | 2.82 | 0.22 |
| 664 | 7.77 | 7.44 | 0.29 |
| 722 | 1.05 | 0.81 | 0.09 |
| 793 | 13.9 | 13.9 | 0.35 (0.34) |
| 808 | 11.9 | 11.9 | 0.32 (0.31) |
| 859 | 2.84 | 2.83 | 0.15 |
| 892 | 0.73 | 0.65 | 0.07 |
| 906 | 0.97 | 0.86 | 0.08 |
| 967 | 1.69 | 1.46 | 0.10 |
| 1116 | 1.54 | 1.40 | 0.09 |
| 1204 | 2.34 | 2.27 | 0.11 |
| 1225 | 6.26 | 6.19 | 0.18 |
| 1235 | 4.84 | 4.93 | 0.16 |
| 1301 | 6.40 | 4.57 | 0.15 |
| 1314 | 20.0 | 19.7 | 0.31 (0.37) |
| 1331 | 5.44 | 4.08 | 0.14 |
| 1379 | 2.27 | 2.15 | 0.10 |
| 1456 | 2.17 | 1.84 | 0.09 |
| 1474 | 4.26 | 4.49 | 0.14 |
| 1530 | 1.81 | 1.92 | 0.09 |
| 1569 | 12.4 | 12.3 | 0.23 (0.25) |
| 1630 | 24.8 | 24.8 | 0.32 (0.35) |
| 1652 | 12.9 | 12.8 | 0.23 (0.25) |
The slight difference to the red of 14375 cm−1 is attributed to a population of vibrational modes with energies below kBT (~200 cm−1 at RT) that was not observed experimentally, and accounts for less than 5% of the total integrated area. A highly displaced, 50 cm−1 mode was included in the calculations to model motion along these missing torsional coordinates.
The experimental and calculated absorption spectra of the crystalline (100 K) form of Pr are also in excellent agreement (Figure 1B). They exhibit the same vibronic features as the solution spectra, evidencing a single chromophore structure. The vibronic transitions are red-shifted by ~100 cm−1 relative to those in solution, most likely due to increased density, polarization, and dispersion interactions. In addition, the decreased temperature changes the distribution of transition energies of the individual molecules, thus reducing the overall line broadening and increasing the prominence of the 0–1 vibronic feature.21–23 The parameters that gave the best fit to the 100 K absorption spectrum were an inhomogeneous broadening of 50 cm−1, a homogeneous broadening of 430 cm−1 and a zero-zero transition energy of 14690 cm−1. The molar extinction coefficient of the crystal structure was not determined, and so the spectrum was scaled such that the electronic transition length matched that of the solution structure (M ~ 2.32 Å).
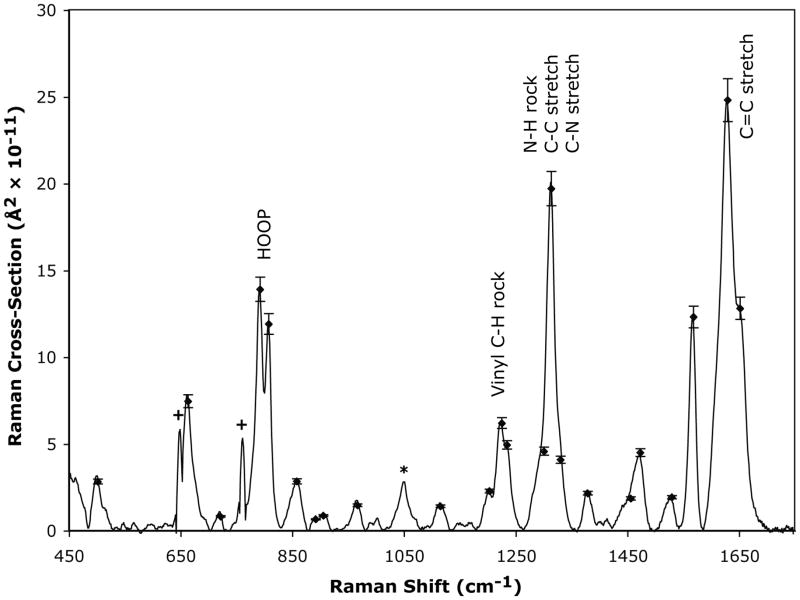
The Raman spectrum and calculated Raman cross-sections of Pr in solution are presented in Figure 2. Experimental cross-sections range from (0.73 ± 0.91) to (24.8 ± 4.10) × 10−11 Å2 molecule−1 at 892 cm−1 and 1630 cm−1, respectively, and were determined by comparison of the Pr integrated peak areas to the integrated area of the glycerol C–OH stretch band at 1049 cm−1. Calculated cross-sections were obtained by adjusting the overall scaling of the delta values to match the experimental peak intensities. The most notable bands are the C15–H hydrogen out-of-plane (HOOP) mode at 793 cm−1 (Δ = 0.35), the mixture of the C5–H and C15–H HOOP modes at 808 cm−1 (Δ = 0.32), the N–H in-plane rock at 1314 cm−1 (Δ = 0.31), and the C=C stretch at 1630 cm−1 (Δ = 0.32) with cross-sections on the order of 10−10 Å2/molecule (see Table 1). The equality of delta values indicates that the excitation energy is dissipated among multiple displaced modes as opposed to being focused along a small number of normal coordinates. Therefore, the wavepacket dynamics evidence multimodal evolution along the reaction trajectory.
Figure 2.
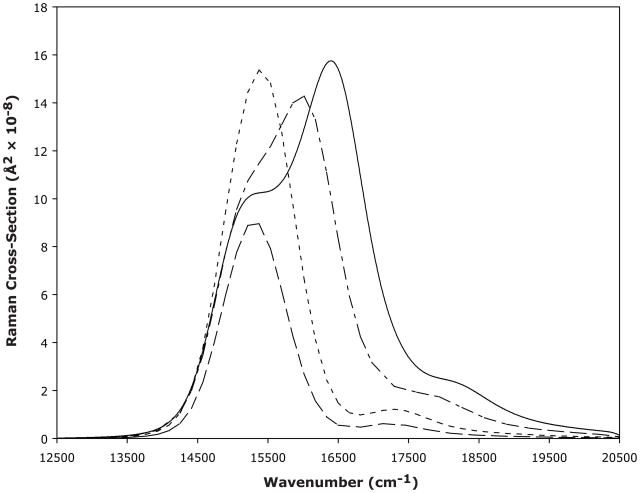
Raman excitation profiles (REPs) for the representative 664, 793, 1314, and 1630 cm−1 modes are shown in Figure 3. Excitation profiles show the dependence of the Raman cross- section on excitation wavelength and were calculated based on the parameters used to fit the experimental absorption and Raman spectra of Pr in solution. The REPs of the 664 and 793 cm−1 bands show a single dominant band near the absorption maximum and a slight contribution at the 0–2 transition. As the vibrational frequency increases, the intensity in the 0–0 transition region decreases slightly and increases significantly in the 0–1 and 0–2 transition regions, as shown for the 1314 cm−1 and 1630 cm−1 REPs. The REPs show that the relative Raman intensities will change as a function of excitation wavelength, and that pumping at an excitation wavelength closer to resonance would increase these intensities by three orders of magnitude. In our case, due to the significant fluorescence background from the Pr form, we pumped at a single frequency 2500 cm−1 to the red of the absorption maximum.
Figure 3.
One important observation is the ratio of the absorption cross-sections of the 0–0 and 0–1 vibronic transitions. In solution at 295 K this ratio is A0–0/A0–1 = 2.4 (Figure 1A). If multiple species existed in the system, a change in temperature should shift the equilibrium, thus modifying the relative population of conformers and the resulting absorption spectrum. We see, however, that at 100 K the ratio of the vibronic transition strengths remains 2.4 (Figure 1B), further supporting a homogeneous system.
This observation is contrary to previous suggestions of a structurally heterogeneous population of phytochromes. The fluorescence data of 80 individual Agp1 phytochrome molecules at 100 K presented by Nieder and coworkers showed a series of single-molecule fluorescence emission spectra, each attributed to a different conformer.8 At low temperatures, however, excited molecules can photoconvert to different locally trapped intermediate states with unique absorption profiles, fluorescence spectra, and decay rates that may account for this heterogeneity.3, 7
Temperature dependent measurements of the Pr absorption profile of native PhyA revealed an isosbestic point, which was argued to support the presence of two species in equilibrium.9 However, recent theoretical and experimental studies have shown that isosbestic points can exist in the inhomogeneously broadened spectra of a homogeneous system due to the slightly different local environments that individual solutes experience.23 Furthermore, we have successfully modeled the Pr vibronic absorption profiles of phytochrome Cph1 as a function of temperature, including the isosbestic point, by simply changing the temperature from 8 to 40°C in the theory and adjusting the homogeneous contribution to the broadening (see SI Figure S3). Thus, the absorption isosbestic point does not provide definitive evidence for multiple Pr conformers and we can conclude that Cph1’s Pr absorption spectrum reflects a single predominant species in solution.
Supplementary Material
Acknowledgments
We thank Jon Hughes (University of Giessen) for the 100 K crystal absorption spectrum and Anne Myers Kelley (UC Merced) for the RRModel program. We also thank Lester Hedges for computational assistance. This work was supported by the Mathies Royalty Fund and supported in part by a grant from the National Institutes of Health (GM068552) to J.C.L.
References
- 1.Rockwell NC, Su YS, Lagarias JC. Annu Rev Plant Biol. 2006;57:837–858. doi: 10.1146/annurev.arplant.56.032604.144208. [DOI] [PMC free article] [PubMed] [Google Scholar]
- 2.Quail PH. Nat Rev Mol Cell Biol. 2002;3:85–93. doi: 10.1038/nrm728. [DOI] [PubMed] [Google Scholar]
- 3.Dasgupta J, Frontiera RR, Taylor KC, Lagarias JC, Mathies RA. Proc Natl Acad Sci USA. 2009;106:1784–1789. doi: 10.1073/pnas.0812056106. [DOI] [PMC free article] [PubMed] [Google Scholar]
- 4.Schumann C, Gros R, Michael N, Lamparter T, Diller R. ChemPhysChem. 2007;8:1657–1663. doi: 10.1002/cphc.200700210. [DOI] [PubMed] [Google Scholar]
- 5.Heyne K, Herbst J, Stehlik D, Esteban B, Lamparter T, Hughes J, Diller R. Biophys J. 2002;82:1004–1016. doi: 10.1016/S0006-3495(02)75460-X. [DOI] [PMC free article] [PubMed] [Google Scholar]
- 6.Muller MG, Lindner I, Martin I, Gartner W, Holzwarth AR. Biophys J. 2008;94:4370–4382. doi: 10.1529/biophysj.106.091652. [DOI] [PMC free article] [PubMed] [Google Scholar]
- 7.Holzwarth AR, Venuti E, Braslavsky SE, Schaffner K. Biochim Biophys Acta. 1992;1140:59–68. [Google Scholar]
- 8.Nieder JB, Brecht M, Bittl R. J Am Chem Soc. 2009;131:69–71. doi: 10.1021/ja8058292. [DOI] [PubMed] [Google Scholar]
- 9.Schmidt P, Gensch T, Remberg A, Gartner W, Braslavsky SE, Schaffner K. Photochem Photobiol. 1998;68:754–761. doi: 10.1111/j.1751-1097.1998.tb05296.x. [DOI] [PubMed] [Google Scholar]
- 10.von Stetten D, Gunther M, Scheerer P, Murgida DH, Mroginski MA, Kraus N, Lamparter T, Zhang J, Anstrom DM, Vierstra RD, Forest KT, Hildebrandt P. Angew Chem, Int Ed. 2008;47:4753–4755. doi: 10.1002/anie.200705716. [DOI] [PubMed] [Google Scholar]
- 11.Lamparter T, Mittmann F, Gartner W, Borner T, Hartmann E, Hughes J. Proc Natl Acad Sci USA. 1997;94:11792–11797. doi: 10.1073/pnas.94.22.11792. [DOI] [PMC free article] [PubMed] [Google Scholar]
- 12.Gambetta GA, Lagarias JC. Proc Natl Acad Sci USA. 2001;98:10566–10571. doi: 10.1073/pnas.191375198. [DOI] [PMC free article] [PubMed] [Google Scholar]
- 13.Essen LO, Mailliet J, Hughes J. Proc Natl Acad Sci USA. 2008;105:14709–14714. doi: 10.1073/pnas.0806477105. [DOI] [PMC free article] [PubMed] [Google Scholar]
- 14.McCamant DW, Kukura P, Yoon S, Mathies RA. Rev Sci Instrum. 2004;75:4971–4980. doi: 10.1063/1.1807566. [DOI] [PMC free article] [PubMed] [Google Scholar]
- 15.Myers AB, Mathies RA. In: Biol App of Raman Spectroscopy. Spiro TG, editor. Vol. 2 John Wiley & Sons; New York: 1987. [Google Scholar]
- 16.Lee SY, Heller EJ. J Chem Phys. 1979;71:4777–4788. [Google Scholar]
- 17.Tang J, Albrecht AC. Raman Spectroscopy. Vol. 2 Plenum; New York: 1970. [Google Scholar]
- 18.Lamparter T, Esteban B, Hughes J. Eur J Biochem. 2001;268:4720–4730. doi: 10.1046/j.1432-1327.2001.02395.x. [DOI] [PubMed] [Google Scholar]
- 19.Matute RA, Contreras R, Perez-Hernandez G, Gonzalez L. J Phys Chem B. 2008;112:16253–16256. doi: 10.1021/jp807471e. [DOI] [PubMed] [Google Scholar]
- 20.Borucki B, Otto H, Rottwinkel G, Hughes J, Heyn MP, Lamparter T. Biochemistry. 2003;42:13684–13697. doi: 10.1021/bi035511n. [DOI] [PubMed] [Google Scholar]
- 21.Boitsov VM, Yuzhakov VI. J Appl Spectrosc. 1986;45:1200–1203. [Google Scholar]
- 22.Mukamel S. Principles of Nonlinear Optical Spectroscopy. Oxford University Press; New York: 1995. [Google Scholar]
- 23.Geissler PL. J Am Chem Soc. 2005;127:14930–14935. doi: 10.1021/ja0545214. [DOI] [PubMed] [Google Scholar]
Associated Data
This section collects any data citations, data availability statements, or supplementary materials included in this article.


