Abstract
Near-infrared Raman spectroscopy is a powerful analytical tool for detecting critical differences in biological samples with minimum interference in the Raman spectra from the native fluorescence of the samples. The technique is often suggested as a potential screening tool for cancer. In this article we report in vitro Raman spectra of squamous cells in normal and cancerous cervical human tissue from seven patients, which have good signal-to-noise ratio and which were found to be reproducible. These preliminary results show that several Raman features in these spectra could be used to distinguish cancerous cervical squamous cells from normal cervical squamous cells. In general, the Raman spectra of cervical cancer cells show intensity differences compared to those of normal squamous cell spectra. For example, several well-defined Raman peaks of collagen in the 775 to 975 cm −1 region are observed in the case of normal squamous cells, but these are below the detection limit of normal Raman spectroscopy in the spectra of invasive cervical cancer cells. In the high frequency 2800 to 3100 cm −1 region, it is found that the peak area under the CH stretching band is lower by a factor of approximately six in the spectra of cervical cancer cells as compared with that of the normal cells. The Raman chemical maps of regions of cancer and normal cells in the cervical epithelium made from the spectral features in the 775 to 975 cm −1 and 2800 to 3100 cm −1 regions are also found to show good correlation with each other.
Index Headings: Micro-Raman spectroscopy, Cervix tissues, Cervical cancer, Squamous cell epithelium, Raman maps
INTRODUCTION
Cervical cancer is the second leading cause of female cancer-related death1 worldwide; more than half a million women are diagnosed with cervical cancer each year, with an estimated 14,800 new cervical cancer cases reported in the U.S. in 2008. The total number of deaths worldwide attributable to cervical cancer is estimated to be 288,000 annually.1–3 Cervical cancer is much more common in developing countries than in developed countries. The incidence rates are low in developed countries because of the introduction of screening programs in the 1960s and 1970s. The main risk agent for cervical cancer is the human papilloma virus (HPV),4 which is present in 99.7% of invasive cervical cancers.2
Cervical cancer screening is primarily done by Pap smear, which involves examination of exfoliated cells under a microscope. A colposcopic examination is used to further investigate cytological abnormalities noted on a Pap smear. Due to the subjective interpretation of the Pap smears, the early diagnosis of cancer can have a high false-negative rate. A possible alternative to the current Pap smear approach is the Raman spectroscopic technique, which potentially avoids this subjectivity, providing a more accurate, objective diagnosis.5–16 Commercially available research-grade micro-Raman systems are capable of measuring Raman spectra from a single biological cell. This capability makes the micro-Raman system an attractive tool to screen not only for cancer cells but also for viruses, bacteria, and other bio-hazardous materials. The recent development of small Raman systems17–19 may also facilitate the remote, real-time screening of cancer and pathogens.
We recently used various excitation lasers to investigate the Raman spectra of cancer cells, normal cells, and other biological materials. Green laser excitation (such as 532 nm and 514.5 nm) produces significant native bio-fluorescence and obscures the Raman spectral features of biological specimens under investigation. Most biological samples also have a very low Raman cross-section, which makes it difficult to obtain good quality Raman spectra of the samples with low laser power. Use of high laser power to improve the Raman signals has the disadvantage of heating the sample, inducing spectral changes. Our preliminary investigation of Raman spectroscopy diagnostics using paraffin-embedded, formalin-fixed cells revealed the presence of paraffin, hematoxylin, eosin, and other chemicals that influenced the overall spectra of the tissue specimens, similar to observations reported by Faolain et al.20 Thus, our initial diagnostic studies were limited to tissue specimens immediately flash-frozen after surgical removal without any chemical processing.
Present state-of-the-art micro-Raman systems with near-infrared excitation lasers (i.e., 785 and 830 nm) are capable of measuring Raman spectra from single biological cells with minimum interference from bio-fluorescence. However, trace amounts of rare-earth ions in glass slides produce strong fluorescence bands in the near-infrared region, making it difficult to obtain good quality Raman spectra from glass-mounted biological specimens. In the case of fiber-optic probes developed for in vivo Raman spectral measurements of biological samples, the strong Raman signal from the silica glass of long fiber-optic probes would interfere with the Raman spectrum of the sample.21 Robichaux-Viehoever et al.,7 Utzinger et al.,8 and Mo et al.9 have reported difficulty in obtaining Raman spectra in the low frequency region (below 1000 cm−1) of cervical cells during in vivo measurements because of the background signal from the fiber probe. Low frequency bands (below 1000 cm−1) have not been analyzed by these researchers but have been reported to be of significance in discriminating precancerous cells from normal cells by Krishna et al.10 and Martinho et al.15 during their in vitro macro-Raman analysis of frozen tissue samples.
In vitro Raman spectra of normal cervices obtained from fresh and frozen tissues have been reported in the literature.5,6,10,11,15 However, Raman spectra reported by Mahadevan et al.5,6 are not the same as those reported by other researchers10,11,15 and spectral features can be visually seen to be quite different. Similarly, the Raman spectra of normal cervical cells reported in the literature from in vivo detection are also not consistent. Therefore, obtaining reliable Raman spectra of normal cervical squamous cells is not only important to resolve this issue but would also serve as reference spectra for comparison with those of cervical cancer cells. The objective of the present study was to identify Raman features that could serve as diagnostic markers for cervical cancerous squamous cells. The ultimate goal of the scientific community in this field is to use Raman spectroscopy for the detection of cervical precancer or cancer in its early stages, leading to detection and treatment of early cancer or cancer prevention. The Raman spectra reported in the literature by both in vivo and in vitro analyses show minor visual differences between normal and cancer cells. Utilizing statistical tools and data processing, it has been successfully shown10–12 that these minor differences could distinguish between normal and neoplastic cells. Our preliminary approach was to examine the Raman features of cancer cells that are fully developed and are in the final stage of invasive carcinoma. Our strategy here is that these spectra comparisons would show the highest contrast between normal cells and abnormal invasive cancer cells. Once the differences in spectral features are positively identified, future research can then be extended to the detection of intermediate precancer stages of neoplasia.
SAMPLES AND EXPERIMENTAL METHODS
The study protocol was approved by the Institutional Review Board of the University of Hawaii. All study participants provided written informed consent. Malignant tissue from women diagnosed with invasive squamous cell carcinoma and normal cervical tissue from women with no evidence of cervical cancer were immediately flash-frozen in liquid nitrogen following surgical removal without staining or exposure to other chemicals. A total of 14 tissue samples were measured from seven different human subjects (four patients with normal cervix and three patients with invasive cervical squamous cell carcinoma). All subjects had a total hysterectomy with bilateral salpingo-oopherectomy for clinical diagnoses, and these tissues were examined by a gynecologic pathologist. Table I shows the specimens used and their histological diagnosis. A microtome was used to prepare three adjacent thin sections of each sample. Frozen tissue samples were cut at −15 °C with thickness ranging from 8 to 15 μm. Water was used as the cutting medium; no optimal cutting temperature (OCT) medium was used for the thin-section processing because OCT has been reported to affect molecular analyses.22 One thin-section was mounted on a front-coated aluminum mirror sheet for micro-Raman analysis. The second and third thin-sections mounted on glass and aluminum mirror substrates were processed with standard hematoxylin and eosin (H&E) stain to provide a template for determining the areas of interest for Raman analysis. The Raman spectra were measured using a micro-Raman RXN system from Kaiser Optical Systems, Inc. (KOSI), utilizing a 785 nm laser excitation and an automated xyz microscope stage. A 50 μm slit width was used for measuring the micro-Raman spectra of tissues.
TABLE I.
List of cervical tissue specimens examined from seven patients and their histological diagnosis.
| Sample | Tissue type | Histology |
|---|---|---|
| KO383F | Normal cervix | Cervix with no pathologic abnormality, ovary-benign serous cysts |
| KO350C | Normal cervix | Cervix with no pathologic abnormality, ovary/uterus-endometriosis |
| KO224B | Normal cervix | Cervix with no pathologic abnormality, endometrium-endometrial adenocarcinoma |
| KO235D | Normal cervix | Cervix with no pathologic abnormality, endometrium-endometrial adenocarcinoma |
| KO396 | Cervical cancer | Invasive cervical squamous cell carcinoma |
| KO234F | Cervical cancer | Invasive cervical squamous cell carcinoma |
| KO225A | Cervical cancer | Invasive cervical squamous cell carcinoma |
Several transparent substrates, such as quartz, sapphire, plexiglass, and mica, were tested with 785 nm laser excitation to determine whether we could overcome the glass fluorescence. None of these were found suitable for the purpose of finding an ideal transparent substrate with low background Raman and fluorescence spectral features. Hence, the search for an ideal transparent substrate suitable for 785 nm Raman investigation was terminated. Because pure metals are known to have no Raman spectral features and very low background signal, efforts were made to find a suitable substrate that would replace the glass microscope slide. Front-coated aluminum mirrors were found to yield both low Raman background and the potential for visible inspection of tissues through emulated transmission.23 Furthermore, front-coated aluminum sheets with high reflectivity are commercially available at reasonably low cost.24 Several substrates were cut (size 2 in. × 1 in.) from a large aluminum mirror sheet and cleaned with methanol before mounting the tissue samples.
Raman spectra of malignant and normal cervical tissue were analyzed in the presence of a surgeon, histology technician, and Raman specialists to ensure identical spectroscopic conditions and positive identification of the epithelial cells to be examined. Frozen tissue samples were placed under the Raman microscope and brought to room temperature before the Raman spectral acquisition. Typically, Raman spectra in the 200 to 3200 cm−1 region were measured on squamous cells at various locations in a given tissue sample. Each Raman spectrum was collected for 60 s and with 10 mW of laser power on the sample.
For Raman mapping, tissue samples were mounted on the automated xyz stage. Raman images were created by measuring the Raman spectra of the tissue specimens at 100 points on a 120 μm × 80 μm grid. Spectra at each point on the grid were recorded twice with 30 mW of laser power and 10 s integration time. Cosmic rays were removed from the spectra by utilizing the built-in KOSI software function that compares the two spectra and eliminates signals produced by random cosmic ray events.
RESULTS AND DISCUSSION
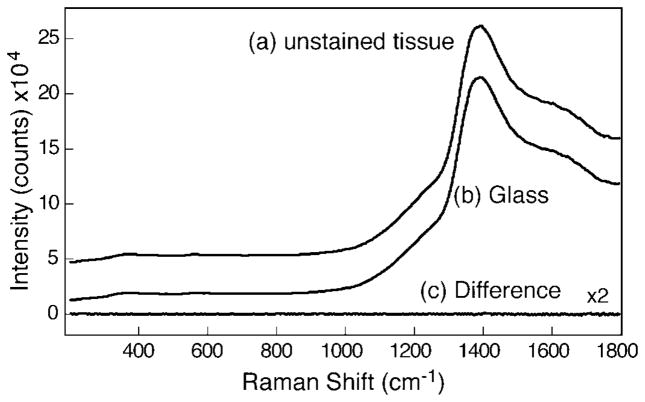
Microscope glass slides are commonly used in the biomedical field as they provide easy visual identification and inspection of stained tissues when illuminated in the transmission mode. Figure 1 shows the Raman spectrum of normal cervical squamous cells mounted on a microscope glass slide (Fig. 1a) and the spectrum of a glass slide without a sample measured under identical conditions with 10 mW of laser power and 60 s integration time (Fig. 1b). The glass slide displayed strong fluorescence bands near 880 nm (~1380 cm−1) that interfered with the weak Raman spectra of the tissue. No additional Raman bands corresponding to the tissue sample were visible in Fig. 1a over the background fluorescence from the slide. Figure 1c, shown with 2× magnification, shows the difference in spectra obtained by subtracting the glass slide fluorescence from the spectrum of tissue on the slide. No obvious Raman spectral features corresponding to the tissue samples were observed. Although it is possible to subtract the fluorescence spectra of the glass slide using baseline correction, we find that this procedure only works for chemicals that have bands with strong Raman cross-sections, such as rhodamine, naphthalene, paraffin, xylene, cyclohexane, etc.
Fig. 1.
Raman spectra of (a) unstained tissue mounted on glass slide and (b) glass slide with no sample measured with 10 mW of 785 nm laser and 60 s integration time. The difference spectrum (unstained tissue − glass) shown in plot (c) is magnified by a factor of 2.
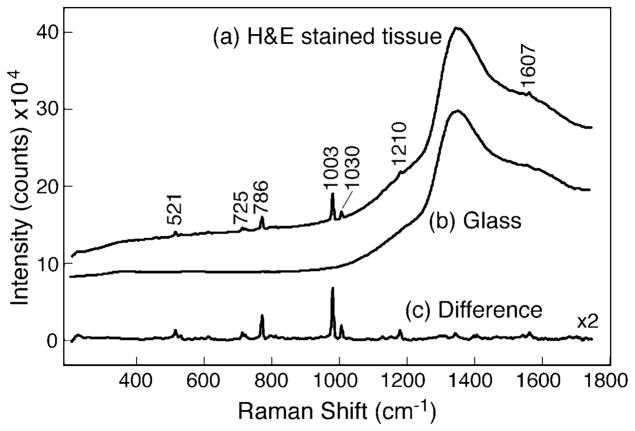
To illustrate this point, Fig. 2a shows the Raman spectra of H&E stained cervical tissue mounted on a glass slide measured under identical conditions of 10 mW laser and 60 s integration time. The difference spectrum (Fig. 2c) was generated by subtracting the glass fluorescence baseline shown with 2× magnification, demonstrating that Raman spectral features of an H&E stained sample could be obtained. However, all the major Raman peaks were found to correspond to xylene and toluene.25 Xylenes and alcohol mixtures were used in the processing of tissue samples during staining to remove extra hematoxylin and eosin. No Raman spectral features such as amide or lipid Raman bands corresponding to the tissue samples were found in the difference spectrum. This illustrates that the Raman spectra of cervical squamous cells are relatively weak in comparison to organic chemicals and hence pose a significant challenge in subtracting a strong fluorescence background.
Fig. 2.
Raman spectra of (a) H&E stained tissue mounted on glass slide and (b) glass slide with no sample measured with 10 mW of 785 nm laser and 60 s integration time. The baseline-corrected difference spectrum (H&E stained tissue − glass) shown in plot (c) exhibits Raman bands of xylene and toluene.
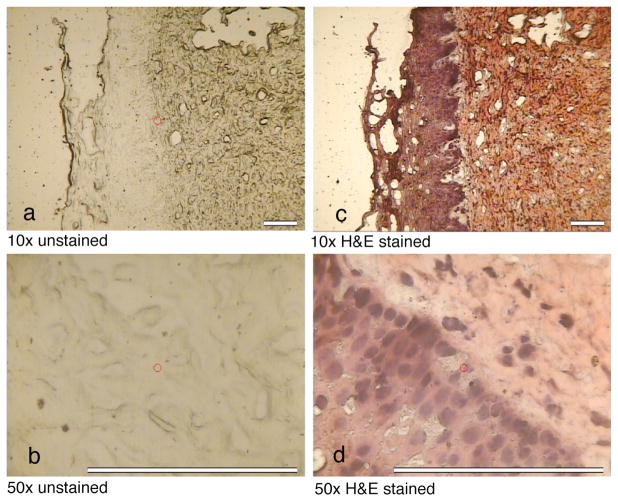
Thin-section cervical tissue specimens were mounted on polished aluminum substrates and visualized by a micro-Raman microscope. Leica 10× and 50× microscope objectives with respective numerical apertures of 0.25 and 0.75 were used for these studies. Figure 3 shows the images of unstained (left micro-photographs, Figs. 3a and 3b) and H&E stained (right micro-photographs, Figs. 3c and 3d) tissues. The epithelium and connective tissues can be distinguished with the 10× objective. The aluminum mirror enhances image contrast under reflected light, facilitating the identification of single cells in the micro-photograph with the 50× objective. In the micro-Raman measurements, the aluminum mirror substrate enhances the intensities of Raman bands from tissue specimens by a factor of four. This enhancement results from the fact that the specimen is excited twice by the laser and downward-scattered Raman photons are reflected back into the collecting optics.26,27 Raman spectra of unstained specimens on aluminum were measured with the 50× objective and a laser spot size of 8 μm. Because the laser spot size and thickness of the tissue samples are less than 15 μm, all Raman spectra reported in this article are presumed to be obtained from individual squamous cells.
Fig. 3.
Photographs of unstained and H&E stained cervical tissues mounted on front-coated aluminum mirror substrates as observed with the micro-Raman microscope with 10×objective (a and c, scale = 100 μm) and 50× objective (b and d, scale = 125 μm).
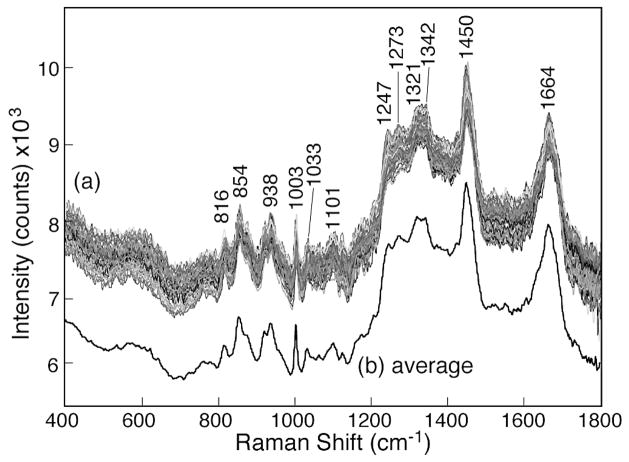
Figure 4a shows the representative spectra of the normal squamous cells in the 400 to 1800 cm−1 region, demonstrating nearly fluorescence-free Raman spectra with well-defined features. A total of 200 Raman spectra in the 200 to 3200 cm−1 region were measured on normal squamous cells at 200 different locations from a tissue sample. All 200 Raman spectra showed the same spectral features. The baseline values of the Raman spectra were found to shift vertically by an arbitrary amount because of variable weak bio-fluorescence from the sample at various locations. The average of the 200 “as-recorded” spectra is also shown as Fig. 4b. The spectra have been shifted vertically for presentation purpose. Several well-defined Raman bands are observed in the normal squamous cells, such as bands at 816 cm−1 [δ(CCH) aliphatic], 854 cm−1 (ring breathing in tyrosine, CCH deform), 922 cm−1 (C–C stretch), 938 cm−1 (C–C skeletal stretch in protein), 1003 cm−1 (symmetric ring breathing in phenylalanine), 1033 cm−1 (C–H in-plane bending), 1101 cm−1 (DNA O–P–O backbone stretch), 1247 cm−1 (amide III of β-sheet), 1273 cm−1 [δ(C= CH)], 1321 cm−1 (CH2 deformation in lipids), 1342 cm−1 [polynucleotide chain (DNA)], 1450 cm−1 (CH2 deformation in lipids), and 1664 cm−1 (amide I of α-helix). A complete list of Raman peak positions and tentative assignments is given in Table II.
Fig. 4.
(a) As-observed Raman spectra of various normal cervical squamous cells measured with 30 mW of 785 nm laser and 10 s integration time showing good overall reproducibility of Raman features. (b) The average of 200 Raman spectra of individual cells without any baseline correction.
TABLE II.
Raman peak positions and assignments of normal cervical squamous cells.a
| Raman peaks (cm−1) | Tentative assignments33 |
|---|---|
| 535 w | Cholesterol ester |
| 570 broad | Tryptophane/cytosine, guanine |
| 621 w | C–C twist in phenylalanine (protein) |
| 644 vw | C–C twist in tyrosine |
| 761 vw | Sym. ring breathing in tryptophane |
| 780 vw | Uracil ring breathing (nucleotide) |
| 816 m | δ(CCH) aliphatic (collagen) |
| 854 s | Ring breathing in tyrosine, CCH deformation |
| 876 m (sh) | CC stretch (protein, collagen) |
| 922 m | C–C stretch (protein, collagen) |
| 938 s | C–C skeletal stretch in protein, collagen |
| 959 w (sh) | Sym. stretch phosphate |
| 1003 vs | Sym. ring breathing of phenylalanine |
| 1033 m | C–H in plane bending of phenylalanine |
| 1064 w | C–C skeletal stretch in lipids |
| 1101 m | DNA: O–P–O backbone stretch |
| 1125 w | C–C skeletal stretch in lipids |
| 1176 w | Cytosine/guanine/adenine |
| 1208 w | CC stretch backbone phenyl ring |
| 1247 s | Amide III: β-sheet |
| 1273 w | δ(=CH), amide III |
| 1321 s | CH2 deformation in lipids/adenine/cytosine, amide III (α-helix) |
| 1342 s | Polynucleotide chain (DNA/RNA) |
| 1425 sh | δ(CH3) |
| 1450 vs | CH2 deformation in lipids |
| 1551 w | Tryptophane |
| 1606 w | C=C phenylalanine |
| 1665 vs | Amide I: α helix |
| 2878 s | CH2 sym. Stretch |
| 2900 m | CH stretch |
| 2938 vs | CH2 asym. and CH3 sym. stretch, CH3 sym. (lipid) |
| 2975 m | CH3 asym. Stretch |
| 2981 m | CH3 asym. Stretch |
Abbreviations: m = medium; s = strong; sh = shoulder; v = very; w = weak; δ = deformation; ρ = rocking modes; sym. = symmetric; asym. = antisymmetric.
The Raman spectral features of normal cervical squamous cells shown in Fig. 4 are similar to the in vitro Raman spectra reported by Krishna et al.10 and Vidyasagar et al.11 measured from fresh cervical tissue samples and by Martinho et al.15 measured from frozen cervical tissue samples. In contrast, the Raman spectra of cervix tissues reported by the Mahadevan-Jansen group do not match our results and also vary within their own publications.5–8 It is possible that this inconsistency results from the strong Raman background produced by silica glass fibers, obscuring the weak Raman signal from cervical cells. Variation in the reported Raman spectra of tissues5–8 could also result from signal processing differences such as data truncation, binning, noise smoothing, background removal, baseline correction, and normalization procedures.7
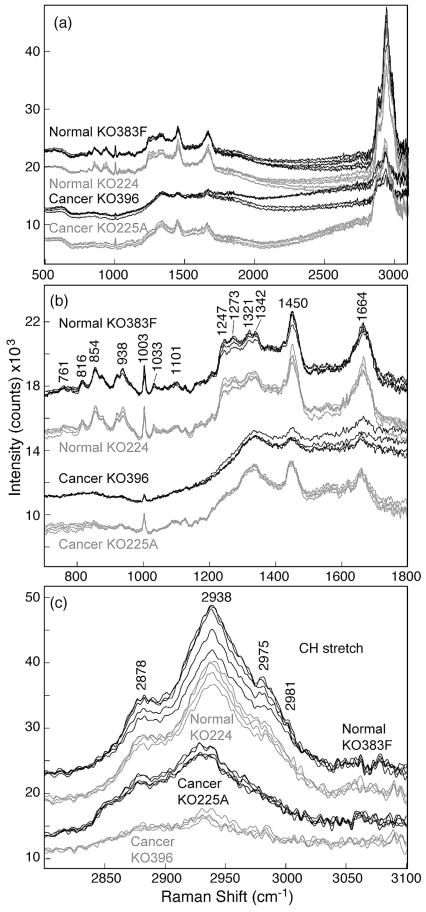
Micro-Raman spectra from fourteen tissue samples (seven from patients with normal cervix and seven from patients with invasive cervical squamous cell carcinoma) were measured with 785 nm laser excitation under identical conditions of 10 mW laser power and 60 s integration time. Figure 5a shows Raman spectra in the 500 to 3200 cm−1 region of normal cervical squamous cells and invasive cervical cancer cells obtained from a representative tissue set from four human subjects (two patients with normal cervix and two with invasive cervical squamous cell carcinoma). Raman features of all seven normal and cancer tissues were found to match with the representative spectra of the each group. Figure 5b shows the magnified region of the spectra in the 700 to 1800 cm−1 region, which demonstrates the spectral differences between normal and malignant cells. For example, several well-defined Raman peaks in the 775 to 975 cm−1 region are observed in the spectrum of normal cervical squamous cells but are missing in the spectra of invasive cancer cells. Another feature corresponding to the amide III band near 1248 cm−1 can also be used to discriminate between normal and malignant epithelial cells. These results are consistent with the macro-Raman spectra of Krishna et al.11 and Vidyasagar et al.,12 who examined fresh normal and malignant cervical tissue samples. Our results are also consistent with the macro-Raman spectra of Martinho et al.,15 who examined frozen samples of cervical intraepithelial neoplasia and saw the same spectral trends. Figure 5c shows the details of the 2800 to 3100 cm−1 high frequency region corresponding to C–H stretching modes and clearly indicates that the spectral area under this broad band is much larger in the normal cells than in the cancer cells. This finding is consistent with an in vivo analysis of cervical neoplasia by Mo et al.9
Fig. 5.
(a) As-recorded Raman spectra of normal cervical squamous cells and invasive cervical cancer cells measured with 10 mW of 785 nm laser and 60 s integration time. Spectra have been shifted vertically for presentation clarity. (b) Magnified region showing Raman spectra of normal cervical squamous cells and invasive cervical cancer cells in the fingerprint region of 700 to 1800 cm−1. (c) Details of Raman spectra of normal cervical squamous cells and invasive cancer cells in the CH stretch region of 2800 to 3100 cm−1.
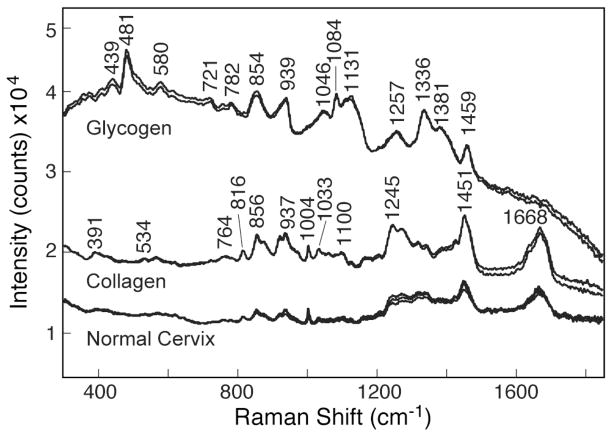
Presently, there are two hypotheses regarding the lack of 854 cm−1 and 938 cm−1 Raman bands in the malignant cervical cells. Martinho et al.15 and Lyng et al.13 assign these Raman bands to glycogen, arguing that cervical cells accumulate large amounts of this compound during maturation. Glycogen is linked to cellular maturation, disappearing with the loss of differentiation during neoplasia.13 A second group of researchers, Krishna et al.12 and Vidhyasagar et al.,11 assign these bands to structural proteins, such as collagen and elastin. According to these investigators,11,12 cervical tissue undergoes periodic inflammation associated with fibrotic changes, perhaps explaining the presence of structural proteins such as collagen in normal cells, whereas hypercellularity is reflected in the malignant cells.
To resolve the issue of glycogen versus collagen, we measured the Raman spectra of collagen and glycogen under the same spectroscopic conditions as the normal epithelial squamous cells. Figure 6 shows the as-recorded Raman spectra of glycogen, collagen, and normal squamous cells with 10 mW of laser power and 60 s integration time. Spectra have been shifted vertically for presentation purposes. The Raman spectrum of collagen appeared to be a better match to the spectral features of normal squamous cells. The Raman spectrum of glycogen shown in Fig. 6 is consistent with that reported in the literature.20,28–30 Similarly, the Raman spectrum of collagen in Fig. 6 is in good agreement with that of Jong et al.30 Although glycogen Raman features show the presence of bands at 854 and 938 cm−1, a strong argument against glycogen would be the absence of a 481 cm−1 band in the normal squamous cells. In a combined electron microscopy and Raman spectroscopy investigation of avian lens glycogen, Castilo et al.29 showed that the 481 cm−1 Raman band is the best indicator of glycogen in the lens nucleus of the ring-neck dove and pigeon. In the case of the dove lens, these investigators29 showed that the ratio of the 481 cm−1 glycogen Raman band and the phenylalanine band at 1003 cm−1 is a good indicator of the relative concentration of glycogen and lens protein. As seen in Figs. 4, 5, and 6, the 481 cm−1 band is not observed in the Raman spectra of normal cervical squamous cells, and therefore a strong contribution by glycogen to the squamous cell spectra is unlikely. The role of collagen in squamous cell carcinoma has also been reported by Parikka et al.31 and Goldberg et al.32
Fig. 6.
As-observed Raman spectra of normal cervical squamous cells, collagen, and glycogen measured with 785 nm laser, 10 mW, and 60 s integration time. Spectra have been shifted vertically.
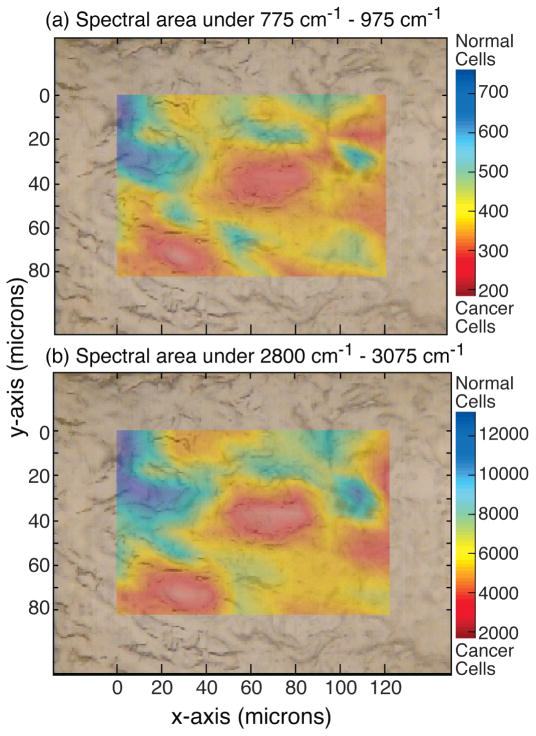
Figure 7 shows the Raman area scan of the squamous cells in the tissue sample K0225A from a patient with cervical cancer (Table I). Two chemical maps were created by analyzing the spectra obtained over the scanned area. The top figure, Fig. 7a, is the spectral area under the 775 to 975 cm−1 spectral region. Since this region showed well-defined collagen peaks in the normal cells, the blue area with high counts would correspond to normal cells. The cancerous region is highlighted in the red area, which corresponds to a region of low collagen. The bottom spectral map, Fig. 7b, is based on the area under the high frequency region corresponding to CH stretching and also gives almost the same map of cancerous and normal cells, providing cross-validation of the Raman technique.
Fig. 7.
(a) Raman chemical map of invasive cervical cancer tissue sample K0225A generated by integrating the spectral area between the 775 and 975 cm−1 regions indicating location of cancer cells (in red) and normal cells (in blue). (b) Raman chemical map of the same tissue generated by spectral area under the CH region validates the map generated in plot (a). All spectra measured with 785 nm laser, 30 mW, and 10 s integration time.
In the future, a Raman scanner could be developed based on spectral features in the low frequency or high frequency regions. Analysis of the low frequency Raman bands provides more specific molecular information and could isolate the chemical changes in the cell. On the other hand, Raman spectral features in the high frequency (2800–3100 cm−1) region are much stronger (by a factor of ~6) in intensity than the fingerprint low frequency region, which would be of advantage from a sensitivity point of view. For in vivo detection, the high frequency C–H stretching region offers a better option because the Raman bands of silica generated in the fiber probe do not interfere with this region. Successful in vivo diagnosis of cervical precancer based on the C–H stretching bands has been reported by Mo et al.9
CONCLUSION
We found that the use of a glass substrate during the in vitro analysis of cervical tissue is a major obstacle to Raman spectroscopy of biological samples based on the excitation of rare-earths fluorescence bands by the 785 nm laser. Front-coated aluminum mirror substrates are suitable substrates for the Raman investigations because these provide (1) good image contrast and identification of squamous cells under the reflection mode of the Raman microscope, (2) low spectral background, and (3) Raman signal enhancement by a factor of four. Good quality micro-Raman spectra of individual squamous cells could be obtained with 30 mW of 785 nm laser and 10 s integration time. The Raman spectra of normal cervical squamous cells and cancer cells excited with the 785 nm laser show spectral differences. A Raman chemical map generated from the low frequency collagen Raman bands in the 775 to 975 cm−1 region distinguishes cervical cancer cells from the normal cells and is shown to match with the chemical map generated by the analysis of the high frequency (2800–3100 cm−1) C–H stretching region. These preliminary high-quality Raman data on normal and cancerous cervical squamous cells are encouraging; however, further work is needed to investigate patient variability and improve statistical application to larger populations.
Acknowledgments
This work was supported in part the Army Research Laboratory under a cooperative agreement (WA11MF-07-2-0002); by Public Health Service grant R01-CA-58598; and contract N01-PC-35137 from the Department of Health and Human Services, National Institutes of Health. The authors would also like to thank Stanley Saiki, MD, of the Pacific Telehealth & Technology Hui for his support and gynecologic pathologist Jeffrey Killeen, MD, for his assistance with tissue evaluation. We would also like to thank Nancy Hulbirt and Diane Henderson for their valuable help with figures and editing, respectively. This is SOEST contribution No. 7871 and HIGP contribution No. 1833.
References
- 1.World Health Organization. Vol. 2. Geneva, Switzerland: World Health Organization; 2003. p. 1. [Google Scholar]
- 2.Bosch FX, de Sanjose S. J Natl Cancer Inst Monogr. 2003;31:3. doi: 10.1093/oxfordjournals.jncimonographs.a003479. [DOI] [PubMed] [Google Scholar]
- 3.Parkin DM, Bray F, Ferlay J, Pisani P. CA Cancer J Clin. 2002;55:74. doi: 10.3322/canjclin.55.2.74. [DOI] [PubMed] [Google Scholar]
- 4.Granadillo M, Torrens I. Biotecnologia Aplicada. 2008;25:1. [Google Scholar]
- 5.Mahadevan A, Ramanujam N, Mitchell MF, Malpica A, Thomsen S, Richards-Kortum R. Proc SPIE-Int Soc Opt Eng. 1995;2388:110. [Google Scholar]
- 6.Mahadevan-Jansen A, Mitchell MF, Ramanujam N, Malpica A, Thomsen S, Utzinger U, Richards-Kortum R. Photochem Photobiol. 1998;68:123. doi: 10.1562/0031-8655(1998)068<0123:nirsfv>2.3.co;2. [DOI] [PubMed] [Google Scholar]
- 7.Robichaux-Viehoever A, Kanter E, Shappell H, Billheimer D, Jones H, III, Mahadevan-Jansen A. Appl Spectrosc. 2007;61:986. doi: 10.1366/000370207781746053. [DOI] [PubMed] [Google Scholar]
- 8.Utzinger U, Heintzelman DL, Mahadevan-Jansen A, Malpica A, Follen M, Richards-Kortum R. Appl Spectrosc. 2001;55:955. [Google Scholar]
- 9.Mo J, Zheng W, Low J, Ng J, Hancheran A, Huang Z. Proc SPIE-Int Soc Opt Eng. 2007;6826:682611. [Google Scholar]
- 10.Krishna CM, Prathima NB, Malini R, Vadhiraja BM, Bhatt RA, Fernandes DJ, Kushtagi P, Vidyasagar MS, Kartha VB. Vib Spectrosc. 2006;41:136. [Google Scholar]
- 11.Vidyasagar MS, Maheedhar K, Vadhiraja BM, Fernendes DJ, Kartha VB, Krishna CM. Biopolymers. 2008;89:530. doi: 10.1002/bip.20923. [DOI] [PubMed] [Google Scholar]
- 12.Krishna CM, Sockalingum GD, Vidyasagar MS, Manfait M, Fernendes DJ, Vadhiraja BM, Maheedhar K. J Cancer Res Ther. 2008;4:26. doi: 10.4103/0973-1482.39602. [DOI] [PubMed] [Google Scholar]
- 13.Lyng FM, Faolain EO, Conroy J, Meade AD, Knief P, Duffy B, Hunter MB, Byrne JM, Kelehan P, Byrne HJ. Exp Mol Pathol. 2007;82:121. doi: 10.1016/j.yexmp.2007.01.001. [DOI] [PubMed] [Google Scholar]
- 14.Faolain EO, Hunter MB, Byrne JM, Kelehan P, Byrne HJ, Lyng FM. Proc SPIE-Int Soc Opt Eng. 2005;5826:25. [Google Scholar]
- 15.Martinho HDS, Silva CMDOMD, Yassoyama MCBM, Andrade PDO, Bitar RA, Santo AMDE, Arisawa EAL, Martin AA. J Biomed Opt. 2008;13:054029. doi: 10.1117/1.2976114. [DOI] [PubMed] [Google Scholar]
- 16.Jess PRT, Smith DDW, Mazilu M, Dholakia K, Riches AC, Herrington CS. Int J Cancer. 2007;121:2723. doi: 10.1002/ijc.23046. [DOI] [PubMed] [Google Scholar]
- 17.Sharma SK, Misra AK, Lucey PG, Angel SM, McKay CP. Appl Spectrosc. 2006;60:871. doi: 10.1366/000370206778062110. [DOI] [PubMed] [Google Scholar]
- 18.Misra AK, Sharma SK, Lucey PG. Appl Spectrosc. 2006;60:223. doi: 10.1366/000370206776023412. [DOI] [PubMed] [Google Scholar]
- 19.Misra AK, Sharma SK, Lucey PG, Lentz RCF, Chio CH. Proc SPIE-Int Soc Opt Eng. 2007;6681:66810C/1. [Google Scholar]
- 20.Faolain EO, Hunter MB, Byrne JM, Kelehan P, McNamara M, Byrne HJ, Lyng FM. Vib Spectrosc. 2005;38:121. [Google Scholar]
- 21.Schoen C, Cooney T, Sharma SK, Carey D. Appl Opt. 1992;31:7707. doi: 10.1364/AO.31.007707. [DOI] [PubMed] [Google Scholar]
- 22.Turbett GR, Sellner LN. Diagn Mol Pathol. 1997;6(5):298. doi: 10.1097/00019606-199710000-00009. [DOI] [PubMed] [Google Scholar]
- 23.Zinin PV, Misra A, Kamemoto L, Yu Q, Sharma SK. J Opt Soc Am B. 2007;24:2779. [Google Scholar]
- 24.Anomet, Inc. Brampton; Ontario, Canada: http://anomet.com/index.html. [Google Scholar]
- 25.Sharma SK, Misra AK, Sharma B. Spectrochim Acta, Part A. 2005;61:2404. doi: 10.1016/j.saa.2005.02.020. [DOI] [PubMed] [Google Scholar]
- 26.Misra AK, Sharma SK, Kamemoto L, Zinin PV, Yu Q, Hu N, Melnick L. Appl Spectrosc. 2009;63:373. doi: 10.1366/000370209787598988. [DOI] [PubMed] [Google Scholar]
- 27.Sharma SK, Misra AK, Kamemoto L, Dykes A, Acosta T. Proc SPIE-Int Soc Opt Eng. 2009;7313:73130F/1. [Google Scholar]
- 28.Choo-Smith LP, Maquelin K, Vreeswijk TV, Bruining HA, Puppels GJ, Thi NAN, Kirschner C, Naumann D, Ami D, Villa AM, Orsini F, Allouch P, Endtz HP. Appl Environ Microbiol. 2001;67:1461. doi: 10.1128/AEM.67.4.1461-1469.2001. [DOI] [PMC free article] [PubMed] [Google Scholar]
- 29.Castillo CG, Lo WK, Kuck JFR, Yu NT. Biophys J. 1992;61:839. doi: 10.1016/S0006-3495(92)81891-X. [DOI] [PMC free article] [PubMed] [Google Scholar]
- 30.de Jong BWD, Schut TCB, Coppens J, Wolffenbuttel KP, Kok DJ, Puppels GJ. Vib Spectrosc. 2003;32:57. [Google Scholar]
- 31.Parikka M, Nissinen L, Kainulainen T, Bruckner-Tuderman L, Sato T, Heino J, Tasanen K. Exp Cell Res. 2006;312:1431. doi: 10.1016/j.yexcr.2006.01.015. [DOI] [PubMed] [Google Scholar]
- 32.Goldberg I, Davidson B, Lerner-Geva L, Gotlieb WH, Ben-Baruch G, Novikov I. J Kopolovic J Clin Pathol. 1998;51:781. doi: 10.1136/jcp.51.10.781. [DOI] [PMC free article] [PubMed] [Google Scholar]
- 33.Movasaghi Z, Rehman S, Rehman IU. Appl Spectrosc Rev. 2007;42:493. [Google Scholar]


