Abstract
Hydrogen bonding is generally thought to play an important role in tuning the electronic structure and reactivity of metal-sulfur sites in proteins. To develop a quantitative understanding of this effect, S K-edge X-ray absorption spectroscopy (XAS) has been employed to directly probe ligand-metal bond covalency, where it has been found that protein active sites are significantly less covalent than their related model complexes. Sulfur K-edge XAS data are reported here on a series of P450 model complexes with increasing H-bonding to the ligated thiolate from its substituent. The XAS spectroscopic results show a dramatic decrease in pre-edge intensity. DFT calculations reproduce these effects and show that the observed changes are in fact solely due to H-bonding and not from the inductive effect of the substituent on the thiolate. These calculations also indicate that the H-bonding interaction in these systems is mainly dipolar in nature. The −2.5 kcal/mole energy of the H-bonding interaction was small relative to the large change in ligand-metal bond covalency (30%) observed in the data. A bond decomposition analysis of the total energy is developed to correlate the pre-edge intensity change to the change in Fe-S bonding interaction on H-bonding. This effect is greater for the reduced than the oxidized state, leading to a 330 mV increase in the redox potential. A simple model shows that E° should vary approximately linearly with the covalency of the Fe-S bond in the oxidized state, which can be determined directly from S K-edge XAS.
Keywords: Sulfur K-edge XAS, DFT, H-bonding, P450 model complexes
Introduction
Hydrogen bonding is thought to play an important role in tuning the reactivity of a whole range of chemical and biological systems by modulating substrate binding and active site geometric and electronic structure.1,2 Many active sites have highly conserved H-bonds which appear to be key to the site function as their mutation greatly reduces reactivity.3 The functional role of these H-bonds has been extensively investigated using different experimental and computational techniques.4 These studies have mainly focused on donor/acceptor centers containing first row transition metals. There are only a few studies addressing the effects of H-bonding on the electronic structures of inorganic complexes and in particular, active sites having sulfur ligands.5,6,7,8,9
Metal-sulfur based active sites are abundant in nature, performing a wide variety of functions, including redox catalysis (e.g. O2 activation of cytochrome P450),10 small-molecule activation (e.g. nitrogenase, CO dehydrogenase),11 Lewis acid catalysis (e.g. nitrile hydratase)12 and electron transport (e.g. Fe-S and blue copper proteins).13 Many of these sites feature multiple H-bonding interactions between the ligated sulfur atoms and the protein backbone NH groups. H-bonding interactions along with other factors e.g. protein dielectric and dipoles can make a significant contribution to the large observed difference between the redox potentials of the active sites and structurally similar inorganic model complexes of electron transfer.14 Hydrogen bonding reduces the Fe-S bond covalency which would localize charge on the donor thiolate/sulfide atom and lower the stabilization of the oxidize state, raising the redox potentials. Hydrogen bonding interactions are also thought to be involved in electron transfer pathways in these proteins.15
Ligand K-edge X-ray absorption spectroscopy (XAS) is a direct probe of ligand-metal bond covalency.16,17 The primary transition at the ligand K-edge is the ligand 1s→4p transition. However the 1s→3p transition is also dipole allowed, and there is covalent mixing of these ligand 3p orbitals into the unoccupied metal 3d antibonding orbitals and C-S σ* orbitals. Thus, transitions to these molecular orbitals from the filled ligand 1s orbital obtain intensity. The intensity of the 1s→3d transition is directly proportional to the amount of ligand character in these acceptor orbitals (α2):
| (1) |
In equation 1, I(1s→L3p) is the transition moment integral or the intensity of a purely ligand based 1s→3p transition, which depends on the Zeff of the ligand.18 Thus the pre-edge intensity provides a direct estimate of ligand-metal bond covalency.
This method has been used to investigate the electronic structures of mononuclear, binuclear, trinuclear and tetranuclear iron-sulfur active sites in proteins and relevant model complexes.19,20,21 In all of these studies the covalency of the model complex was significantly higher than that of the corresponding protein active site. The experimental data in the above studies strongly suggested significant weakening of Fe-S bonds in the active sites of these proteins which was due to the presence of multiple H-bonds, although other factors could also contribute. The lower ligand-metal bond covalency also empirically correlated to the observed differences in redox potentials between model complexes and protein active sites.
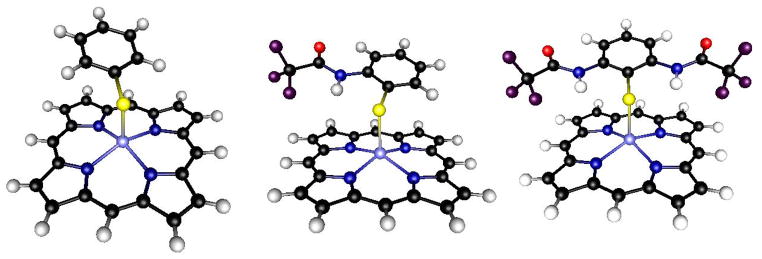
The purpose of the present study is to focus on a series of model complexes, for which one can systematically vary the H-bonding (Figure 1) to evaluate its effects on covalency and redox potentials. This series, of high spin ferric porphyrins with increasing H-bonding, reported by Nakamura et al., has been structurally characterized and has a systematic shift in E°.22 We report the S K-edge XAS and DFT calculations for this series and quantitatively estimate the effects of H-bonds on the Fe-S bond covalency and its correlation to the redox potentials. We also investigate the mechanism of the H-bonding interaction and establish a relationship between redox potential and covalency using a Valence Bond Configuration Interaction (VBCI) model.
Figure 1.
Schematic diagram of the model complexes (left to right) Fe(OEP)SPh, Fe(OEP)L1 and Fe(OEP)L2. The ethyl groups in the original molecules have been truncated to hydrogens for simplicity.
Experimental Details
Materials and Methods
The complexes FeIII(octaethylporphyrinato)thiophenolate [Fe(OEP)SPh], FeIII(octaethylporphyrinato)benzene(2-trifluoroacetamido)thiolate [Fe(OEP)L1] and FeIII(octaethylporphyrinato)benzene(2,6-bis-trifluoroacetamido)thiolate [Fe(OEP)L2] were synthesized according to literature.22 For XAS experiments, sample preparations were performed in a dry, nitrogen-filled anaerobic atmosphere glove-box. The samples were ground into a fine powder and dispersed as thinly as possible on sulfur-free Mylar tape. This procedure has been verified to minimize self-absorption effects. The sample was then mounted across the window of an aluminum plate. A 6.35 μm polypropylene film window protected the solid samples from exposure to air during transfer from the glove-box to the experimental sample chamber.
Data Collection
XAS data were measured at the Stanford Synchrotron Radiation Laboratory using the 54-pole wiggler beam line 6-2. Details of the experimental configuration for low energy studies have been described previously.23 The energy calibration, data reduction and error analysis follow the methods described in Ref. 24.
Fitting Procedures
Pre-edge features were fit by pseudo-Voigt line shapes (sums of Lorentzian and Gaussian functions). This line shape is appropriate as the experimental features are expected to be a convolution of a Lorentzian transition envelope25 and a Gaussian line shape imposed by the beam line optics.26 A fixed 1:1 ratio of Lorentzian to Gaussian contribution successfully reproduced the pre-edge features. The rising edges were also fit with pseudo-Voigt line shapes. Fitting requirements included reproducing the data and its second derivative, using the minimum number of peaks. The intensity of a pre-edge feature (peak area) represents the sum of the intensity of all the pseudo-Voigt peaks which were needed to successfully fit the feature in a given fit. The reported intensity values for the model complexes are an average of all of the accepted pre-edge fits, typically 10–12 (which differed from each other by less than 3%).
DFT Calculations
All calculations were performed on dual-CPU Pentium Xeon 2.8 GHz work stations and a SGI Origin 2000 computer using the Amsterdam Density Functional (ADF) program, versions 2004.01 and developed by Baerends et al.27,28 A triple-ζ Slater-type orbital basis set (ADF basis set TZP) with a single polarization function at the local density approximation of Vosko, Wilk, and Nusair29 with nonlocal gradient corrections of Becke30 and Perdew31 were employed. The molecular orbitals were plotted using Gopenmol ver.2.2 and the Mulliken32 population analyses were performed using the AOMix33 program. The solvation calculations were performed using the PCM34 method and CH2Cl2 as solvent with the Gaussian 03 package.35 For an estimate of the error in these numbers B3LYP36 and PBE37 functionals were used and the COSMO38 solvation model in the ADF package using epsilon of 8.9 for CH2Cl2.
Results
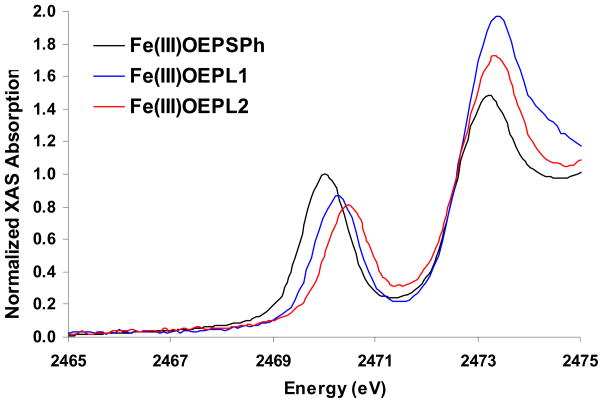
The S K-edge XAS of the three model complexes FeIII(octaethylporphyrinato)thiophenolate [Fe(OEP)SPh, in black], FeIII(octaethylporphyrinato)benzene(2-trifluoroacetamido)thiolate [Fe(OEP)L1, in blue] and FeIII(octaethylporphyrinato)benzene(2,6-bis-trifluoroacetamido)thiolate [Fe(OEP)L2, in red], are shown in Figure 2. All three complexes exhibit two distinct transition envelopes around 2470 eV and 2473 eV. The first feature, which is the pre-edge, is assigned to the thiolate 1s→ Ψ* transition, where Ψ* reflects the metal 3d antibonding manifold (Ψ*= (1−α2)1/2|Fe3d> + α|S3P>).39 The higher-energy feature is assigned to the thiolate 1s→C-S σ* manifold of transitions. The data show that there is a decrease in pre-edge intensity along the series and that the pre-edge peak maxima progressively shift to higher energy. The energy and intensity of the pre-edge features are quantitatively estimated from fits to the experimental spectra and their 2nd derivatives (Table 1; Figure S1, Supplementary Information). The intensity of the thiolate-based transitions, normalized to the pre-edge intensity (Do in Table 1), is related to the total percent ligand character in the d antibonding manifold. This uses as a reference the thiolate S-Cu bond in plastocyanin where the S K-edge intensity of 1.01 unit corresponds to 38% S3p character in the LUMO.40 The Do decreases from 1.30±0.05 for Fe(OEP)SPh to 0.80±0.06 for Fe(OEP)L2 corresponding to a decrease of Fe-S bond covalency from 49±2% to 31±2%. The energy position of the peak maximum shifts from 2470.0±0.1 eV for Fe(OEP)SPh to 2470.5±0.1 eV for Fe(OEP)L2. Note that the t2-e orbital splitting in these complexes is not large enough to allow experimental resolution of the σ and π contributions to bonding. However, DFT calculations can be used to estimate their splitting and thus allow fitting of the relative contributions of these components (vide infra).
Figure 2.
S K-edge XAS of the Fe(OEP) complexes SPh (black), L1 (blue) and L2 (red).
Table 1.
Results of fits to the experimental spectra.
| Normalized pre-edge intensity (Do) | Average pre-edge energy (eV) | Total covalency (% S3p) | Rising edge transition energy (eV) | |
|---|---|---|---|---|
| Fe(OEP)SPh | 1.30±0.05 | 2470.0±0.1 | 49±2 | 2473.2 |
| Fe(OEP)L1 | 1.10±0.05 | 2470.2±0.1 | 41±2 | 2473.4 |
| Fe(OEP)L2 | 0.80±0.06 | 2470.5±0.1 | 31±2 | 2473.4 |
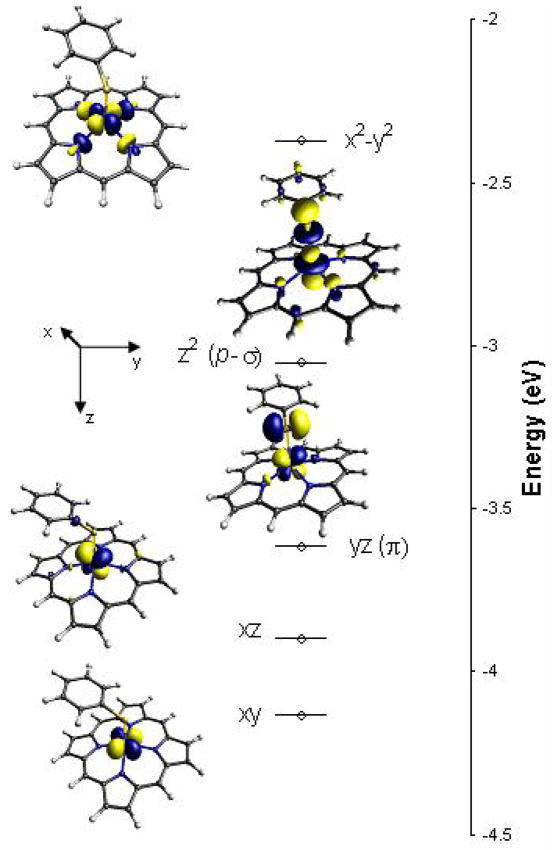
Geometry-optimized DFT calculations were performed on the high spin (S=5/2) ground states of these heme complexes. The calculated geometries are in general good agreement with the crystal structures and reproduce the Fe-S bond elongation on H-bonding as observed crystallographically (Table 2).41,42 The calculations can be correlated to the experimentally observed changes in pre-edge intensity. The calculated MO diagram for the Fe(OEP)SPh complex (Figure 3) shows that two of the Fe 3d orbitals interact with the S 3p donor orbitals. The dyz orbital has a π type interaction with the thiolate 3p orbital in the plane of the aromatic ring of SPh−, and the dz2 orbital has a psuedo-σ type interaction with the thiolate orbital out of the plane of the aromatic ring of the SPh−. (Note that in the crystal structure and the optimized geometry of the complexes, the thiolate binds with an orientation such that the N-H bond is oriented directly toward the in-plane 3p orbital of the S in the L1 and L2 complexes). The sum of thiolate S 3p character in these β unoccupied Fe 3d orbitals (Table 2) decreases from 42% to 30% on going from Fe(OEP)SPh to Fe(OEP)L2, reflecting well the experimental results in table 1. The calculations also indicate that the decrease in the thiolate contribution is solely in the π type orbital.
Table 2.
DFT calculated bond lengths and covalencies for the Fe(OEP)X complexes (crystallographic distance are given in parenthesis)
| Distance (Å) | Covalency(% S3p) | Total covalency (% S3p) | ||||
|---|---|---|---|---|---|---|
| Fe-S | Fe-N | N--S | π | σ | ||
| Fe(OEP)SPh | 2.30 (2.30) | 2.11 (2.06) | N/A | 24 | 18 | 42 |
| Fe(OEP)L1 | 2.33 (2.33) | 2.10 (2.05) | 2.98 (2.93) | 17 | 18 | 35 |
| Fe(OEP)L2 | 2.38 (2.36) | 2.10 (2.05) | 2.98 (2.96) | 12 | 18 | 30 |
Figure 3.
DFT-calculated MO diagram of the Fe(OEP)SPh complex. The β LUMO orbitals are pictured. The dz2 orbital has a pseudo-σ interaction with the out-of-plane thiolate donor orbital and the dyz orbital has a π interaction with the in-plane thiolate donor orbital. The inset shows the reference coordinate system.
Analysis
The observed decrease in pre-edge intensity along the series of complexes can have contributions from the H-bonding interaction but also the electron withdrawing effect (-I) of the amido substituents. The observed pre-edge energy shifts can have contributions from both the Zeff for the Fe and the S atom. DFT calculations were performed to quantitatively evaluate the contributions of these different effects to the pre-edge intensities and energies.
A. H-bonding and Inductive Effect
The amido substitution at the ortho position of the phenyl ring can affect the electron donating power of the thiolate sulfur and hence covalency of the metal-ligand bond. To independently quantify the inductive (–I) effect of the CF3CONH- substituent it is necessary to evaluate a substituent which has a comparable –I but with no H-bonding. Geometry-optimized calculations were first performed on simpler RCH=CH2 systems using different R groups to reproduce the –I effect of the CF3CONH- substituent on the ethylene unit (Table S1, Supplementary Information). The HCOO- group was found to be most suitable in terms of resultant charge density on the α and β carbons of the ethylene. Geometry-optimized calculations of the heme complex were then performed using this substituent on the thiolate, (Table 3 Fe(OEP)SPh vs Fe(OEP)Ester). These calculations show that there is essentially no decrease in the ligand-metal bond covalency (42% vs 40% total covalency, Table 3, Column 3) indicating that the –I effect of the substituent does not decrease the covalency in Fe(OEP)L2. This calculation also shows that there is a significant amount of charge transfer from the C-S bonding orbital into its anti-bonding counterpart in the case of the ester (Table 3, Column 4). This will reduce the 1s orbital energies (hence increasing the pre-edge transition energy) and increase the C-S σ* rising edge-transition intensity, as observed in Figure 2 at ~2473 eV. Note that there are two factors that influence the shift of sulfur character to the antibonding manifold, this –I effect and the C-S bond length. A shorter C-S bond will have higher S3p character in the C-S σ* orbital. The observed intensities reflect the combination of these effects. For the ~2473 eV transition, Fe(OEP)L1 has maximum intensity, having the shortest C-S bond length; Fe(OEP)L2 has higher intensity than Fe(OEP)SPh despite its longer bond, which results from the strong –I effect. DFT calculations performed on the free ligands (Table S2, Supplementary Information) show that indeed the 1s orbital shifts deeper in energy by 0.5 eV in the ester substituted thiolate (due to –I).
Table 3.
Results of DFT calculation for Fe(OEP)X complexes.
| Covalency | Total ligand-metal covalency | % S3p in C-S antibonding manifold | ||
|---|---|---|---|---|
| π | σ | |||
| Fe(OEP)SPh | 24 | 18 | 42 | 40 |
| Fe(OEP)L2 | 12 | 18 | 30 | 46 |
| Fe(OEP)Ester | 24 | 16 | 40 | 44 |
| Fe(OEP)SPh + 2H2O | 12 | 18 | 30 | 39 |
| Fe(OEP)L2 + dipole | 16 | 18 | 34 | 40 |
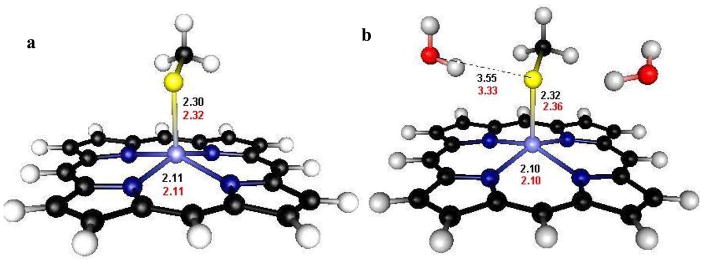
A geometry-optimized calculation was performed in which the amido substituent was removed and two H2O molecules were placed in the vicinity of the thiolate ligand (Figure 5). The results shows a similar decrease in covalency (12π, 18σ) which parallels that for Fe(OEP)L2 (Table 3, Rows 4 and 2, respectively). These calculations demonstrate that the observed decrease in covalency in Fe(OEP)L2 relative to that of Fe(OEP)SPh can be simulated by H-bonding only with no –I effect of the substituent. The -I effect of the substituent does not affect the pre-edge intensity, but does contribute to the pre-edge energy by shifting charge density to antibonding orbitals, stabilizing the 1s orbital of sulfur. Thus, the observed decrease in pre-edge intensity in Figure 2 is due to H-bonding. H-bonding can localize charge on the thiolate sulfur decreasing ligand-metal bond covalency. The ligand structure provides a good orientation for the H-bonding interaction as the N-H bonds of the substituent point directly at the two lobes of the π type orbital of the complex (Figure 3, yz π orbital). This is consistent with the result that the calculated decrease in covalency, from 24 to 12%, only occurs in the π type orbital (Table 3, Column 1).
Figure 5.
Optimized geometries and relevant bond lengths of oxidized (in black) and reduced (in red) of complexes with (a) and without (b) H-bonding used to evaluate the energies.
This interaction also shifts the S 1s orbital of the ligand to deeper energy (0.7 eV from free ligand calculations, Table S2) which might be expected to shift the pre-edge transition to higher energy. However, the decrease of ligand-metal bond covalency will also increase the Zeff of the bound iron, shifting the antibonding manifold to deeper energy (by 0.7 eV in the DFT-optimized ground state). The net result of these opposing contributions is little effect on the pre-edge energy position due to the H-bond. Thus the –I effect of the substituent is the main contributor to the observed pre-edge energy shift (Figure 2, Table 1).
B. Mechanism of H-bonding
The H-bonding interaction can have both dipolar and covalent contributions. Previous studies on H-bonding systems with oxygen and nitrogen donor centers have indicated that they are mostly Coulombic in nature.2,43,44 The covalent interaction is very small in these systems mainly due to the large energy gap between the donor orbital (lone pair) and the acceptor O-H σ* orbitals (8 eV in the case of water). Sulfur-based ligands have higher lying donor orbitals due to their lower electronegativity. These ligands could thus have some covalent interaction with acceptor σ* orbitals. As presented above, geometry-optimized DFT calculations, performed on the Fe(OEP)SPh+2H2O complex (Table 3), show that the covalency of the π type orbital decreases from 24% to 12% relative to the Fe(OEP)SPh complex. Substituting the H2O by dipoles45 to simulate the Coulombic interaction of the water molecules reduces the covalency of the π* orbital from 24% to 16% (Table 3) accounting for 2/3 of the change observed in the calculation including water molecules. This suggests that the H-bonding interaction in this case is mainly ionic but also has a partial covalent contribution.
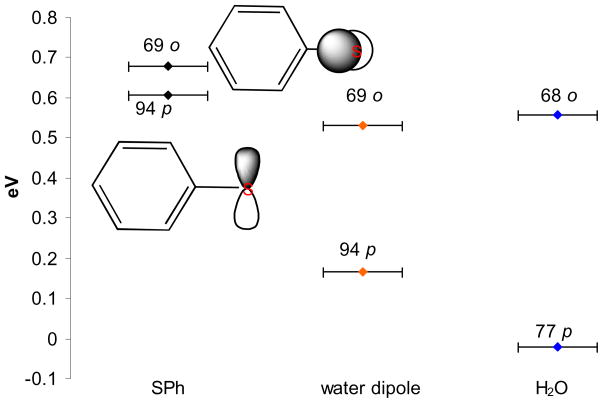
DFT calculations were also performed on the free ligands, and on ligands with water molecules and dipoles, to evaluate how these perturbations affect the ligand interaction with the metal. Figure 4 shows the MO diagram46 for these ligands. The PhS− ligand has two 3p donor orbitals in its valence shell that are close in energy, the in-plane (p) orbital, which forms the π bond with the metal and the out-of-plane (o) orbital, which is involved in a pseudo-σ interaction with the metal (Figure 3, dz2 pseudo-σ antibonding). The calculation with the dipoles shows that the p orbital has been stabilized in energy relative to the o orbital by 0.4 eV, which reduces the π interaction with the metal (i.e. π covalency) as observed in the metal complex calculation (Table 3). Note that the coefficients of the donor orbital have not changed compared to the free ligand as the dipoles do not affect the charge density of the sulfur. The calculation with water bound to the thiolate shows that the p orbital has been stabilized relative to the calculation with the dipoles (by 0.6 eV) and the sulfur coefficient on this donor orbital has decreased by ~17%. This decrease is complemented by ~14% increase of the S 3p coefficient in the antibonding H-O σ* orbitals due to charge transfer to the water molecules from the free ligand. The partial covalent interaction is also evident from the −0.16 total charge on each water fragment which would be neutral in the absence of a covalent interaction. This further decrease in energy and co-efficient in the water calculation correlates with the 4% decrease in covalency in the heme complex with the water bound to the thiolate relative to the calculation with the dipoles.
Figure 4.
The relative orbital energies of the out of plane (o) and the in plane (p) donor orbitals of the free SPh− ligand, and of the ligand with dipolar interactions and H-bonding. The numbers on top of the orbitals represent the % S 3p character in the MO.
C. Energy of H-bonding
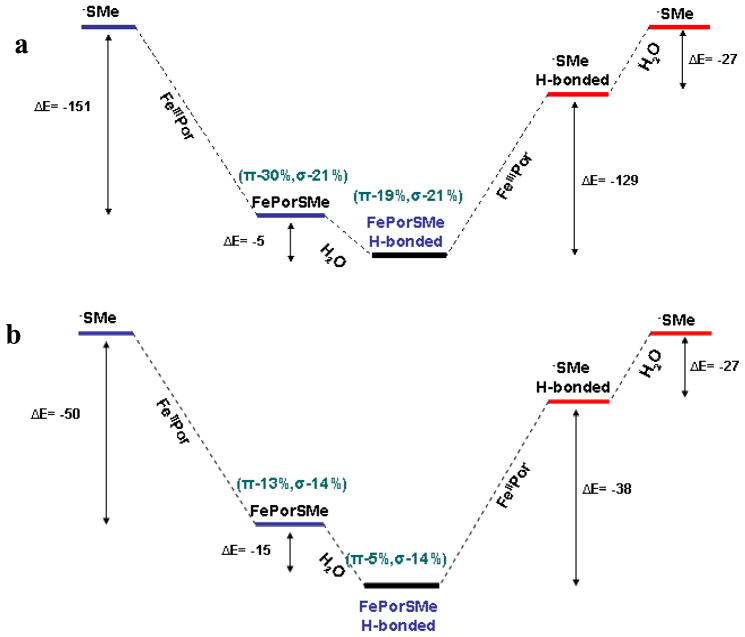
The energy of the H-bonding interaction was evaluated using both the Fe(OEP)SPh model and an alkylthiolate model (Fe(OEP)SMe, Figure 5) where the aryl −SPh thiolate group of the Fe(OEP)SPh complex was substituted by an alkyl −SMe. Parallel to the results in the last section for the aryl thiolate DFT calculations with geometry optimizations were performed for Fe(OEP)SMe and Fe(OEP)SPh. These calculations show that the Fe-S bond length increases on H-bonding by 0.02 Å in the oxidized form compared to a 0.03 Å increase in the case of the Fe(OEP)SPh model (Table 4). The covalency of the Fe-S bond decreases from 30% to 20% in the π orbital due to H-bonding, similar to the effects found with the SPh− ligand (Table 4).47 The ΔE of H-bonding calculated for the ferric heme complex is about −5 kcal/mole (for both aromatic and aliphatic thiolate) for two H-bonds to the thiolate in the gas phase. This is in good agreement with previous estimates of the H-bond energy of sulfur acceptors.44 This net change in energy (−5 kcal/mole) is thus small considering the large change in Fe-S bonding interaction (decrease in π covalency by almost 33% for both alkyl and aryl thiolates) involved in the process. The decrease of ligand-metal bond covalency should be reflected in the energy of metal-ligand bond more than in the total energy of the system. This is indicated in the energy decomposition Scheme 1a for the alkyl thiolate. This shows that the bond energy (BE) of the H-bonded thiolate ligand and the FeIIIheme fragment is about −129 kcal/mole, while that of the free thiolate is −151 kcal/mole, 22 kcal/mole higher than the H-bonded ligand. Thus there is, in fact, a 22 kcal/mole decrease in BE of the Fe-S bond between the H-bonded and the non H-bonded complexes which corresponds to the dramatic decrease in the bonding interaction observed from the S K pre-edge intensity (i.e. covalency, Figure 2, Table 1). However, the H-bonding energy of the thiolate with H2O is −27 kcal/mole, which compensates for this difference in bonding energy and further stabilizes the system by −5 kcal/mole, as estimated above.
Table 4.
DFT-calculated Fe(OEP)SMe energies, MULLIKEN population and HIRSCHFIELD charges. Energies obtained using PCM method and CH2Cl2 as a solvent are reported in parenthesis.
| Fe-S (Å) | Covalency | Charge | ΔEf (kcal/mole) (solvent) | ||||
|---|---|---|---|---|---|---|---|
| π | σ | Fe | S | H2O | |||
| Fe(OEP)SPh | 2.30 | 24 | 18 | 0.34 | −0.07 | −0.10 | −4.0 (1.0) |
| Fe(OEP)SPh + 2H2O | 2.33 | 12 | 18 | 0.36 | −0.03 | ||
| Fe(OEP)SMe | 2.30 | 30 | 21 | 0.32 | −0.06 | −0.14 | −5.1 (−1.5) |
| Fe(OEP)SMe + 2H2O | 2.32 | 19 | 21 | 0.34 | −0.03 | ||
| Fe(OEP)SPh (red) | 2.34 | 10 | 0.24 | −0.16 | −0.22 | −12.2 (−7.2) | |
| Fe(OEP)SPh+2H2O (red) | 2.39 | 4 | 7 | 0.26 | −0.10 | ||
| Fe(OEP)SMe (red) | 2.32 | 13 | 14 | 0.24 | −0.17 | −0.26 | −15.6 (−7.5) |
| Fe(OEP)SMe + H2O (red) | 2.36 | 5 | 13 | 0.25 | −0.09 | ||
Scheme 1.
Bonding energy decomposition for the a) oxidized and b) reduced hydrogen bonding to Fe(OEP)SMe complexes. All energies are in kcal/mol
Similar geometry optimized DFT calculations, now performed on the one-electron reduced ferrous-heme complexes, show that there is an 0.5Å increase in Fe-S bond length on H-bonding and the ΔE of H-bonding is about −12–15 kcal/mole for both alkyl and aryl thiolates. This H-bonding energy can also be partitioned into components using a similar energy decomposition scheme (Scheme 1b). The bonding energy of the free thiolate to ferrous heme is −50 kcal/mole, 12 kcal/mole more than that of the H-bonded thiolate which is −38 kcal/mole. The −27 kcal/mole of H-bonding (the same as above) again overcomes this difference and results in an overall stabilization of −15 kcal/mole.
The overall H-bonding energy can be correlated with the relative charge density of the sulfur in different complexes (Table 5). The protonated thiolate has a charge density of −0.06 on the sulfur and a corresponding H-bonding energy of −11 kcal/mole while the free thiolate ligand has −0.75 charge density and −41 kcal/mole of H-bond energy. The ferric thiolate complex has about the same charge density as the protonated thiolate (−0.06) due to higher covalency, and only −5 kcal/mole H-bonding energy. Alternatively, the ferrous complex has a charge density of −0.17 on the thiolate and a stabilization of −15 kcal/mole. The energies discussed above are for the gas-phase. When corrected for solvation48 the same trend in these energies is observed. The absolute magnitude of the stabilization due to H-bonding is −1 kcal/mole in the oxidized and −7 kcal/mole in the reduced complexes (values in parentheses in Table 5).
Table 5.
DFT-calculated H-bonding energies in different ligands and complexes. Energies obtained using PCM method and CH2Cl2 as a solvent are reported in parenthesis.
| Charge on S | Charge on H2O in H-bond | Δ Ef (kcal/mole) (2 H-bonds) | ||
|---|---|---|---|---|
| No H-bond | H-Bond | |||
| MeS− | −0.75 | −0.49 | −0.31 | −41 (−17) |
| MeSH | −0.06 | −0.01 | −0.16 | −11 (−4) |
| Fe(OEP)SMe ox | −0.06 | −0.03 | −0.14 | −5 (−1.5) |
| Fe(OEP)SMe red | −0.17 | −0.09 | −0.26 | −15(−7.5) |
There will also be an entropic contribution to the estimated free energies of H-bonding in gas phase. A statistical estimate of this contribution may be made using the relation TΔS=RTln(nf/ni) (where nf = 1 = final number of molecules, and ni = 3 = initial number of molecules) which gives ~ 0.6 kcal/mole at 300 K.
D. Effect of H-bonding on Redox Potential
The H-bonding energy is ~6 kcal/mole greater for the reduced complex than for the oxidized complex (vide supra) for both alkyl and aryl thiolates after taking solvation into account. This energy difference will contribute to the observed redox potential for these complexes. The entropic contribution to the H-bonding energy is small and expected to be very similar for both oxidized and reduced complexes. This H-bond energy difference will lead to a 260 mV higher redox potential in the H-bonded couple. 49 The observed difference in redox potential between the Fe(OEP)SPh and Fe(OEP)L2 couple is 330 mV, which is in reasonable agreement with this estimate.50
Discussion
S K-edge XAS is a direct probe of changes in bonding as well as of changes in the chemical nature of the ligand. As discussed above, we observed a dramatic change in the intensity of the XAS pre-edge (1.3 to 0.8 units) for the Fe(OEP)SPh and Fe(OEP)L2 complexes (Figure 2), which corresponds to a large decrease in the Fe-S bonding interaction in the Fe(OEP)L2 complex relative to that of the Fe(OEP)SPh complex. The decrease is due to H-bonding to the acceptor S atom of the thiolate in Fe(OEP)L2. The shift in energy of the pre-edge is due to a change in the S 1s orbital energy due to a –I effect of the substituted aromatic ring which has no effect on the Fe-S bond. DFT calculations also indicate that the decrease in covalency is in the π-type orbital, as the H-bonds are oriented favorably for such an interaction.
H-bonding interactions in neutral donor-acceptor pairs are generally thought to be dipolar in nature due to very high donor-acceptor orbital energy gaps, disfavoring covalent interaction. However, significant covalent interaction has been proposed in H-bonding involving anionic ligands due to their higher donor orbital energies. The DFT calculations indicate that in case of the FeIII bound thiolate, the charge density on the S atom is comparable to that of a thiol (−0.06), and not a thiolate, due to strong covalency of the FeIII-S bond, resulting in a mainly Coulombic interaction. However, there is a covalent component as well (8% S 3p in acceptor water OH σ* obtained from a Mulliken analysis), owing to the lower electronegativity (i.e. the higher energy and more extended donor orbital) of the ligand. Similar covalent contributions in H-bonding were observed in NMR experiments on the blue Cu protein plastocyanin and in models of rubredoxin.51,52 Note that this small covalent interaction can make an important contribution to HDA for efficient electron transfer.
Our results indicate that the nature, effect on geometric and electronic structure and the energy of H-bonding is the same for aryl (the complexes presented in this paper) and alkyl (more physiologically relevant) thiolates in both oxidized and reduced forms. The observed change in Fe-S bond covalency due to H-bonding (30%) in the S K-edge data is very large relative to the 5 kcal/mole change in energy. An energy decomposition scheme (Scheme 1) shows that the Fe-S bonding energy indeed decreased significantly (22 kcal/mole) as suggested by the change in pre-edge intensity, but the H-bonding stabilization of the ligand (27 kcal/mole) compensated for this loss, resulting in the combined 5 kcal/mole stabilization. DFT calculations suggest that the H-bonding energy increases by 10 kcal/mole in the reduced complex due to the higher charge density on the S resulting from its poor donor interaction with the Fe. This difference, 10 kcal/mole in H-bonding energy between the oxidized and the reduced complexes, shifts the redox potential higher by ~430 mV (~260 mV in CH2Cl2 solution). This theoretical prediction that two H-bonds to a thiolate will shift the E° by ~260 mV in CH2Cl2 solution is in reasonable agreement with the experimentally observed ~330 mV difference in E° between Fe(OEP)SPh and Fe(OEP)L2.
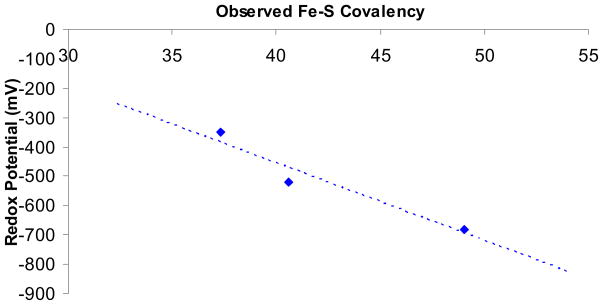
The experimentally observed Fe-S covalency decreases from Fe(OEP)SPh to Fe(OEP)L2 (from 49% to 30%) as the redox potential increases (−680 mV to −350 mV). Interestingly, there is an approximately linear correlation between the redox potential and the observed Fe-S covalency along this series (Figure 6). This linear correlation has previously been observed in a series of Fe2S2 ferredoxin models.16 Valence Bond Configurational Interaction (VBCI) modeling of this system provides physical insight into this experimental trend (See Scheme S1, Supplementary Information).
Figure 6.
Plot of measured Fe-S covalency vs redox potential measured in CH2Cl2 solution.
The observed difference in redox potential between the H-bonded and the non H-bonded complexes in Figure 6 can be expressed as the difference in their bond energy (B.E) in the oxidized and reduced forms i.e.
where subscripts L and L′ represent non H-bonded and H-bonded ligands, respectively. Substituting BE by (Δ)(α2), where α2 is ligand-metal bond covalency and Δ is energy difference between the Fe(II) 3d orbitals and the ligand (L) 3p orbitals before bonding, and defining the energy shift of the metal 3d orbitals upon redox (from FeII to FeIII) as kM and the shift of ligand 3p orbitals (from L to L′) as kL (for details see Supplementary Information):
where ox(Δα2)L→L′ represents the decrease in covalency due to H-bonding within a given oxidation state (superscripted as ox and red), ν = red(Δα2)L→L′/ox(Δα2)L→L′ and ox→red(Δα2L′) is the difference in the covalency of the H-bonded ligand L′-Fe bond between the oxidized and reduced states. The first term in the expression above is linear with covalency and is dominated by kM.53 Since kM is significantly greater than kL the first term will dominate over the second.54 Thus the above expression indicates that in a series of complexes where the change in energy of the ligand donor orbitals is significantly smaller than the energy difference between the oxidized and reduced metal 3d orbitals in the complexes (i.e. kL ≪ kM), E° will vary approximately linearly with covalency (Δα2) as observed experimentally.
This study shows that in a well defined series of complexes the covalency of a metal-ligand bond is reduced by H-bonding to the S. This greatly weakens the S-M bond and the effect is larger for the reduced than the oxidized state (due to the decreased covalent donation from the thiolate to a reduced metal ion) resulting in an increase in reduction potential. Thus, the covalency of the S-M bond, which can be obtained from the intensity of the S K pre-edge correlates with and can be used to evaluate the change in redox potential due to H-bonding in metalloproteins.
Supplementary Material
Acknowledgments
This research was supported by NSF CHE-9980549 (E.I.S.), and by NIH RR-01209 (K.O.H.). Stanford Synchrotron Radiation Laboratory operations are funded by the Department of Energy, Office of Basic Energy Sciences. The SSRL Structural Molecular Biology Program is supported by the National Institutes of Health, National Center for Research Resources, Biomedical Technology Program, and by the Department of Energy, Office of Biological and Environmental Research.
Footnotes
SUPPORTING INFORMATION. Coordinates of all optimized geometries, tables estimating –I effect of the ligands and shift of 1s orbitals of thiolates, 2nd derivative of XAS spectrum and details of the VBCI modeling is available free of charge from the ACS website at http://pubs.acs.org/.
References
- 1.Steiner T. Angew Chem Int Ed. 2002;41:48–76. [Google Scholar]
- 2.Hobza P, Havlas Z. Chem Rev. 2000;100:4253–4264. doi: 10.1021/cr990050q. [DOI] [PubMed] [Google Scholar]
- 3.a) Lipscomb WN, Strater N. Chem Rev. 1996;96:2375–2433. doi: 10.1021/cr950042j. [DOI] [PubMed] [Google Scholar]; b) Bhaumik D, Medin J, Gathy K, Coleman MS. J Biol Chem. 1993;268:5464–5470. [PubMed] [Google Scholar]; c) Sideraki V, Mohamedali KA, Wilson DK, Chang Z, Kellems RE, Quiocho FA, Rudolph FB. Biochemistry. 1996;35:7862–7872. doi: 10.1021/bi952920d. [DOI] [PubMed] [Google Scholar]
- 4.a) Kumar GA, Pan YP, Smallwood CJ, McAllister MA. J Comp Chem. 1998;19:1345–1352. [Google Scholar]; b) Francois S, Rohmer MM, Benard M, Moreland AC, Rauchfuss TB. J Am Chem Soc. 2000;122:12743–12750. [Google Scholar]
- 5.Yang X, Niu SQ, Ichiye T, Wang LS. J Am Chem Soc. 2004;126:15790–15794. doi: 10.1021/ja045709a. [DOI] [PubMed] [Google Scholar]
- 6.Torres RA, Lovell T, Noodleman L, Case DA. J Am Chem Soc. 2003;125:1923–1936. doi: 10.1021/ja0211104. [DOI] [PubMed] [Google Scholar]
- 7.a) Ueno T, Ueyama N, Nakamura A. J Chem Soc, Dalton Trans. 1996;19:3859–3863. [Google Scholar]; b) Ueyama N, Yamada Y, Okamura T, Kimura S, Nakamura A. Inorg Chem. 1996;35:6473–6484. doi: 10.1021/ic9604324. [DOI] [PubMed] [Google Scholar]
- 8.Hung WP, Dewan JC, Tuckerman M, Walters MA. Inorg Chim Acta. 1999;291:388–394. [Google Scholar]
- 9.Huang J, Dewan John C, Walters MA. Inorg Chim Acta. 1995;228:199–206. [Google Scholar]
- 10.Meunier B, de Visser SP, Shaik S. Chem Rev. 2004;104:3947–3980. doi: 10.1021/cr020443g. [DOI] [PubMed] [Google Scholar]
- 11.a) Lee SC, Holm RH. Chem Rev. 2004;104:1135–1157. doi: 10.1021/cr0206216. [DOI] [PubMed] [Google Scholar]; b) Rao PV, Holm RH. Chem Rev. 2004;104:527–559. doi: 10.1021/cr020615+. [DOI] [PubMed] [Google Scholar]
- 12.Endo I, Nojiri M, Tsujimura M, Nakasako M, Nagashima S, Yohda M, Odaka M. J Inorg Biochem. 2001;83:247–253. doi: 10.1016/s0162-0134(00)00171-9. [DOI] [PubMed] [Google Scholar]
- 13.Rorabacher DB. Chem Rev. 2004;104:651–697. doi: 10.1021/cr020630e. [DOI] [PubMed] [Google Scholar]
- 14.Stephens PJ, Jollie DR, Warshel A. Chem Rev. 1996;96:2491–2513. doi: 10.1021/cr950045w. [DOI] [PubMed] [Google Scholar]
- 15.Therein MJ, Chang J, Raphael AL, Bowler BE, Gray HB. Structure and Bonding. 1991;75:109–129. [Google Scholar]
- 16.Glaser T, Hedman B, Hodgson KO, Solomon EI. Acc Chem Res. 2000;33:859–869. doi: 10.1021/ar990125c. [DOI] [PubMed] [Google Scholar]
- 17.Solomon EI, Hedman B, Hodgson KO, Dey A, Szilagyi RK. Coord Chem Rev. 2005;249:97–129. [Google Scholar]
- 18.Neese F, Hedman B, Hodgson KO, Solomon EI. Inorg Chem. 1999;38:4854–4860. doi: 10.1021/ic990461p. [DOI] [PubMed] [Google Scholar]
- 19.Rose K, Shadle SE, Eidsness MK, Kurtz DM, Jr, Scott RA, Hedman B, Hodgson KO, Solomon EI. J Am Chem Soc. 1998;120:10743–10747. [Google Scholar]
- 20.a) Rose K, Shadle S, Glaser T, de Vries S, Cherepanov A, Canters GW, Hedman B, Hodgson KO, Solomon EI. J Am Chem Soc. 1999;121:2353–2363. [Google Scholar]; b) Anxolabéhère-Mallart E, Glaser T, Frank P, Aliverti A, Zanetti G, Hedman B, Hodgson KO, Solomon EI. J Am Chem Soc. 2001;123:5444–5452. doi: 10.1021/ja010472t. [DOI] [PubMed] [Google Scholar]
- 21.Glaser T, Bertini I, Moura JJG, Hedman B, Hodgson KO, Solomon EI. J Am Chem Soc. 2001;123:4859–4860. doi: 10.1021/ja0155940. [DOI] [PubMed] [Google Scholar]
- 22.a) Ueyama N, Nishikawa N, Yamada Y, Okamura T, Oka S, Sakurai H, Nakamura A. Inorg Chem. 1998;37:2415–2421. [Google Scholar]; b) Ueyama N, Nishikawa N, Yamada Y, Okamura T, Oka S, Sakurai H, Nakamura A. Inorg Chem. 1998;37:2415–2421. [Google Scholar]
- 23.Hedman B, Frank P, Gheller SF, Roe AL, Newton WE, Hodgson KO. J Am Chem Soc. 1988;110:3798–3805. [Google Scholar]
- 24.Shadle SE, Hedman B, Hodgson KO, Solomon EI. Inorg Chem. 1994;33:4235–4244. [Google Scholar]
- 25.Agarwal BK. X-ray Spectroscopy. Springer-Verlag; Berlin: 1979. p. 276. [Google Scholar]
- 26.Tyson TA, Roe AL, Frank P, Hodgson KO, Hedman B. Phys Rev B. 1989;39A:6305–6315. doi: 10.1103/physrevb.39.6305. [DOI] [PubMed] [Google Scholar]
- 27.Baerends EJ, Ellis DE, Ros P. Chem Phys. 1973;2:41–51. [Google Scholar]
- 28.te Velde G, Baerends EJ. Int J Comput Phys. 1992;99:84–98. [Google Scholar]
- 29.Vosko SH, Wilk L, Nusair M. Can J Phys. 1980;58:1200–1211. [Google Scholar]
- 30.Becke AD. Phys Rev A: Gen Phys. 1988;38:3098–3100. doi: 10.1103/physreva.38.3098. [DOI] [PubMed] [Google Scholar]
- 31.Perdew JP. Phys Rev B. 1986;33:8822–8224. doi: 10.1103/physrevb.33.8822. [DOI] [PubMed] [Google Scholar]
- 32.Mulliken RS. J Chem Phys. 1955;23:1833–1840. [Google Scholar]
- 33.Gorelsky SI. Gorelsky SI, Lever ABP, editors. AOMix Program rev.6.04. J Organomet Chem. 2001;635:187–196. http://www.sg-chem.net.
- 34.Miertus S, Scrocco E, Tomasi J. Chem Phys. 1981;55:117–129. [Google Scholar]
- 35.Frisch MJ, et al. Gaussian 03, Revision C.02. Gaussian, Inc; Wallingford CT: 2004. [Google Scholar]
- 36.Becke AD. J Chem Phys. 1993;98:5648–5652. [Google Scholar]
- 37.Perdew JP, Burke K, Ernzerhof M. Phys Rev Lett. 1996;77:3865–3872. doi: 10.1103/PhysRevLett.77.3865. [DOI] [PubMed] [Google Scholar]
- 38.Klamt A, Schüürmann G. J Chem Soc: Perkin Transactions. 1993;2:799–805. [Google Scholar]
- 39.Rose KW, Hedman B, Hodgson KO, Solomon EI. Inorg Chim Acta. 1997:263, 315–321. [Google Scholar]
- 40.Shadle SE, Hedman B, Hodgson KO, Solomon EI. Inorg Chem. 1994;33:4235–4244. [Google Scholar]
- 41.Note that several structures using these ligands have shown shorter Fe-S bond lengths relative to the unsustituted SPh ligand (Ref. 42). However, these have additional strong intra-ligand interactions. This system studied here does not have additional intramolecular interactions and shows an increase in Fe-S bond length.
- 42.Okamura T, Takamizawa S, Ueyama N, Nakamura A. Inorg Chem. 1998;37:18–28. doi: 10.1021/ic970640b. [DOI] [PubMed] [Google Scholar]
- 43.Klein RA. J Comp Chem. 2003;24:1120–1131. doi: 10.1002/jcc.10256. [DOI] [PubMed] [Google Scholar]
- 44.Meot-Ner M. Chem Rev. 2005;105:213–284. doi: 10.1021/cr9411785. [DOI] [PubMed] [Google Scholar]
- 45.Point charges (−0.64 for O and +0.32 for H) were determined from a DFT calculation on H2O keeping the dipole moment of the resulting charge distribution to 1.77 Debye.
- 46.The calibration of the MO energy diagrams was performed relative to the meta C-H bonds which are relatively unchanged between these ligands.
- 47.The calculated H-bonding energies are the same for the SPh and the SMe complexes (Table 4).
- 48.Single-point calculations on optimized gas phase geometries using PCM and CH2Cl2 solvent.
- 49.We have evaluated this shift in redox potential using popular pure and hybrid DFT methods and two different solvation models (Table S3, in supplementary information) The error in this calculated shift was estimated to be ± 20 mV.
- 50.The calculated FeII/III redox potentials for the Fe(OEP)SMe and the Fe(OEP)SMe(2H2O) complexes are about −520 mV and −360 mV, respectively, in CH2Cl2 solvent. The measured redox potential for Fe(OEP)SPh is −680 mV.
- 51.Bertini I, Ciurli S, Dikiy A, Gasanov R, Luchinat C, Martini G, Safarov N. J Am Chem Soc. 1999;121:2037–2046. [Google Scholar]
- 52.Okamura T, Takamizawa S, Ueyama N, Nakamura A. Inorg Chem. 1988;37:18–28. doi: 10.1021/ic970640b. [DOI] [PubMed] [Google Scholar]
- 53.DFT calculations on the FeOEPL series indicate that ν is close to 1. Though the absolute values of the oxidized covalencies are larger than those of the reduced complexes, the H-bonding interaction is stronger in the reduced form leading to a greater change in the covalency.
- 54.In the limit where the H-bonding is weak ox→red(Δα2L′) may be greater than ox(Δα2)L→L′ however at this limit kL will be small. In the strong H-bonding limit kL (the ligand donor orbital stabilization by H-bonding) and ox(Δα2)L→L′ will be high, but the absolute covalencies of the L′-Fe bond will be small in both oxidation states hence ox→red(Δα2L′) will be small.
Associated Data
This section collects any data citations, data availability statements, or supplementary materials included in this article.


