Abstract
K-ras is the most commonly mutated oncogene in pancreatic cancer and its activation in murine models is sufficient to recapitulate the spectrum of lesions seen in human pancreatic ductal adenocarcinoma (PDAC). Recent studies suggest that Notch receptor signaling becomes reactivated in a subset of PDACs, leading to the hypothesis that Notch1 functions as an oncogene in this setting. To determine whether Notch1 is required for K-ras-induced tumorigenesis, we employed a mouse model in which an oncogenic allele of K-ras is activated and Notch1 is deleted simultaneously in the pancreas. Unexpectedly, the loss of Notch1 in this model resulted in increased tumor incidence and progression implying that Notch1 can function as a tumor suppressor gene in PDAC.
Keywords: Ras, Notch1, Pancreatic Adenocarcinoma, tumor suppressor
Introduction
Pancreatic ductal adenocarcinoma (PDAC) is one of the most aggressive forms of human cancer. Pathogenesis of PDAC is thought to evolve through progression of precursor lesions, termed pancreatic intraepithelial neoplasias (PanINs). The PanINs are classified into four subgroups (1A, 1B, 2, and 3) and eventually evolve into invasive carcinoma. The most commonly mutated oncogene in PDAC is K-ras, with activating mutations found in more than 90% of human cases. Recently developed animal models have further underscored this point, as expression of a mutant activated K-ras allele in the pancreas is sufficient to induce the formation of both pre-malignant and malignant lesions in a mouse model, faithfully recapitulating the human disease (1).
Recent studies have implicated Notch1 as a potential oncogene in PDAC, as Notch targets appear to become reactivated in a subset of PanINs and PDAC (1-3). The Notch proteins are central components of pancreatic development and are required for directing cell fate decisions and proliferation (4, 5). While Notch1 was originally identified as an oncogene, recent evidence indicates that Notch1 can also function as a tumor suppressor (6). Conclusive evidence comes from studies in the skin, where loss of both Notch1 alleles led to development of basal cell carcinoma (7) by mechanisms impacting the tumor microenvironment (8).
Notch and Ras have been shown to cooperate or antagonize one another in a manner that is dependent upon cellular context (9). Previous studies have suggested that the ability of Ras to transform cells depends upon Notch function (10, 11). In the case of PDAC, it has been recently shown that ectopic expression of activated Notch1 and K-ras in the mouse pancreas synergizes in inducing PanIN formation (12). Thus, we hypothesized that K-ras and Notch1 functions intersect specifically in the pathogenesis of PDAC. To test this directly, in vivo, we generated a compound mutant mouse where K-ras is activated and Notch1 deleted simultaneously in the pancreas. Surprisingly, we found that this resulted in increased tumor incidence and progression implying that Notch1 can function as a tumor suppressor in a mouse model of PDAC.
Materials and Methods
Mouse strains
The LSL-KrasG12D (13), Notch1lox/lox (14) and PDX-1-Cre (1) mice have been previously described.
KrasG12D and Notch1 allele recombination PCR assays
KrasG12D allele was analyzed by PCR as described (13). Notch1 allele recombination PCR assay was performed as described, without multiplexing (15).
Histology and immunohistochemistry
Formalin-fixed paraffin embedded murine pancreatic tissue was processed by standard methods, or subject to immunohistochemical staining, using citrate buffer antigen retrieval. Antibodies: Rat anti-Ki67, (1:400, Dako); rabbit anti-cleaved caspase-3 (1:200, Cell Signaling); rabbit anti-Hey1, (1:125, Abcam); rabbit anti-Hes1 (1:500, B. Stanger, U. Pennsylvania), mouse anti-β-catenin (1:200, BD Biosciences).
Quantitative PCR
Pancreatic tissue samples were snap-frozen. Total RNA was isolated using the Nucleospin RNA II kit (Macherey-Nagel) and reverse transcribed using Superscript II Reverse Transcriptase (Invitrogen). cDNA transcripts were amplified by quantitative real-time PCR using SYBR Green (Applied Biosystems). Detection/quantitation done on ABI Prism 7000 (Applied Biosystems). Each gene was normalized to 18S rRNA. Notch1 primer sequences: Fwd–TGGATGTCAATGTTCGAGGA, Rev-CACTGCAGGAGGCAATCAT.
Western blot analysis
Tissues/cells were homogenized in RIPA buffer. Primary antibodies: rabbit anti-Notch1 (1:500, Epitomics), rabbit anti-Notch2, 3 and 4 (all 1:200, Santa Cruz), mouse anti-β-catenin (1:1000, BD Biosciences), mouse anti-active β-catenin (1:1000, Millipore), rabbit anti-GAPDH (1:10,000, Sigma) and mouse anti-tubulin (1:8000, Sigma).
Isolation and culture of primary pancreatic ductal cells
Primary pancreatic ductal cells (PDCs) were derived as previously described (16). For siRNA experiments, PDX-1-Cre:KrasG12D:Notch1lox/lox PDCs were plated at 1×10⁴ cells/well in a 12 well plate on day -1, transfected on day 0 with either β-catenin ON-TARGETplus SMART pool siRNA or ON-TARGETplus Non-targeting siRNA pool#3 (Dharmacon), using DharmaFect 2 transfection reagent (Dharmacon) following the manufacturers protocol.
Statistical Analysis
Ki67 positive nuclei comparisons were assessed by a standard unpaired t-test. Error bars represent the standard deviation of triplicate counts (p value ≤ 0.05 was considered significant). For real time PCR, mean ± standard deviation are shown.
Results and discussion
Loss of Notch1 in the context of activated K-ras leads to increased PanIN incidence and progression
To test whether Notch1 is required for K-ras-induced pancreatic tumorigenesis in vivo, we employed a mouse model of PDAC (1). The simultaneous expression of an oncogenic K-ras allele and deletion of both Notch1 alleles was achieved by interbreeding mice harboring both a conditional activated K-ras allele (LSL-K-rasG12D) (13) and conditional Notch1lox/lox knockout alleles (14) with PDX-1-Cre transgenic mice that express Cre-recombinase as early as day 8.5 of embryonic development in progenitors of all major pancreatic cell types (17).
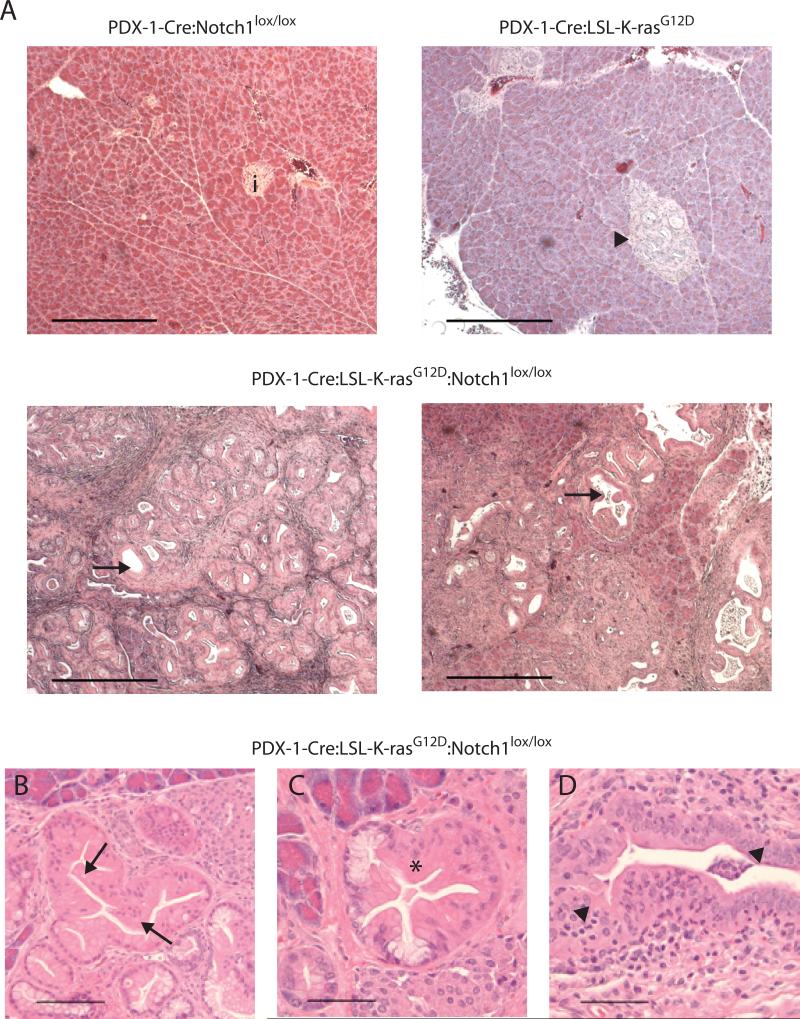
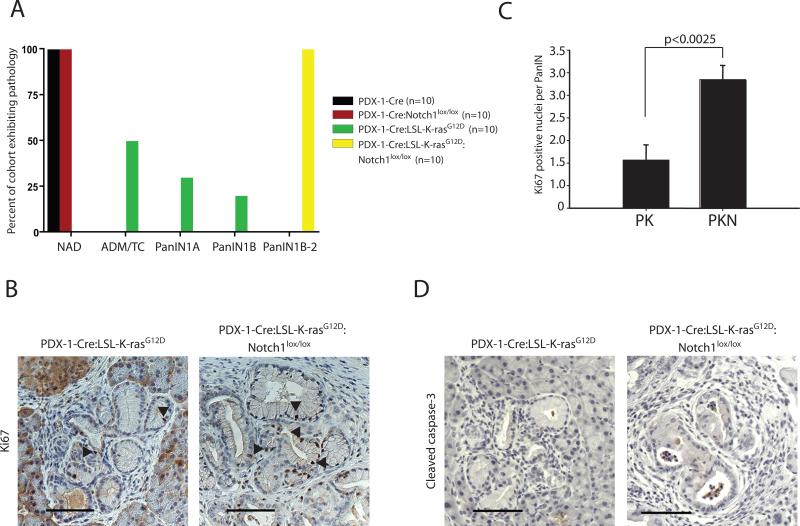
We compared the pancreata of Pdx1-Cre:LSL-K-rasG12D:Notch1lox/lox mice to those of Pdx1-Cre:LSL-K-rasG12D mice. At a 20-week time point, the PDX-1-Cre:LSL-K-rasG12D pancreata displayed predominantly a combination of very early changes; acinar to ductal metaplasia (ADM), tubular complexes (TC) and PanIN1A lesions (Fig. 1A). Approximately 50% of the mice displayed ADM/TC, 30% displayed PanIN1A and less than 20% displayed a lesion classified as PanIN1B (Fig. 2A), consistent with previous findings in this model (1). In contrast, 100% of PDX-1-Cre:LSL-K-rasG12D:Notch1lox/lox pancreata were classified histologically as PanIN1B, transitioning to PanIN2 (Fig. 1A and 2A). All mice in this cohort displayed tissue architecture that was significantly altered. The majority of ducts exhibited PanIN1B-PanIN2 changes, with only between 10-40% of normal acinar, ductal and islet tissue remaining (Fig. 1B-D and 2A). The appearance of intraepithelial and stromal polymorphonuclear leukocytes (PMNs), a cell type often present in subtypes of human pancreatic cancer and thought to play a role in carcinogenesis, was noted (Fig. 1D). Thus, the PDX-1-Cre:LSL-K-rasG12D:Notch1lox/lox mice displayed both increased numbers and more advanced stage PanIN lesions than the PDX-1-Cre:LSL-K-rasG12D mice. The PDX-1-Cre:Notch1lox/lox pancreata displayed no signs of abnormalities (Fig. 1A and 2A), consistent with recently published findings (18). Likewise, PDX-1-Cre pancreata appeared unremarkable (not shown). To verify the expected Cre-mediated recombination events occurred, we isolated genomic DNA from the pancreata and tails of mice from the various genotypes and performed PCR reactions to monitor recombination events. DNA isolated from the pancreas, and not the tails, verified recombination of both alleles (Supp. Fig. 1).
Figure 1. Histological analysis of pancreata.
(A) H&E stained sections from pancreata at 20 weeks of PDX-1-Cre:Notch1lox/lox mice (i = islet), PDX-1-Cre:LSL-K-rasG12D mice (arrowhead = tubular complexes-TC), and PDX-1-Cre:LSL-K-rasG12D:Notch1lox/lox mice (arrows = ducts exhibiting PanIN 1B-2 changes). Scale bar = 400μm. (B-D) Detailed characterization of pathology exhibited in PDX-1-Cre:LSL-K-rasG12D:Notch1lox/lox pancreata. (B) PanIN1B; papillary ductal lesions without significant loss of polarity or nuclear atypia (arrows). (C) PanIN1B transiting to PanIN2 revealing moderate nuclear atypia and a loss of polarity. (D) PanIN1B showing intraepithelial polymorphonuclear leukocytes (arrowheads). Scale bar = 200μm.
Figure 2. Characterization of pancreatic pathology in the experimental cohorts.
(A) Grouped illustration of predominant pancreatic pathology in each of the four experimental cohorts at 20 weeks; NAD – no abnormality detected, ADM/TC – acinar to ductal metaplasia/tubular complexes, PanINs – pancreatic intraepithelial neoplasias. N=10 animals from each cohort (B) Representative Ki67 staining in PDX-1-Cre:LSL-K-rasG12D and PDX-1-Cre:LSL-K-rasG12D:Notch1lox/lox pancreata. Arrowheads point to Ki67 positive nuclei. Scale bar = 80μm. (C) Number of Ki67 positive nuclei per PanIN lesion in pancreata from PDX-1-Cre:LSL-K-rasG12D (PK) and PDX-1-Cre:LSL-K-rasG12D:Notch1lox/lox (PKN) mice. Six pancreata from each genotype were analyzed; 100 PanINs per pancreata were counted. (D) Representative cleaved caspase-3 staining in PDX-1-Cre:LSL-K-rasG12D and PDX-1-Cre:LSL-K-rasG12D:Notch1lox/lox pancreata. Scale bar = 80 μm.
Additionally, mice that are heterozygous for the floxed Notch1 allele (Pdx1-Cre:LSL-K-rasG12D:Notch1lox/+) exhibited an intermediate phenotype. PanIN lesions were predominantly graded as PanIN1B, but a much greater proportion of normal acinar, ductal and islet tissue remained than when compared to the PDX-1-Cre:LSL-K-rasG12D:Notch1lox/lox cohort (not shown).
To compare the proliferative index of the pre-neoplastic lesions in the PDX-1-Cre:LSL-K-rasG12D and PDX-1-Cre:LSL-K-rasG12D:Notch1lox/lox pancreata, we performed Ki67 immunohistochemical staining and scored the number of positive cells per duct (Fig. 2B). Ki67 positive nuclei were more frequent in similar grade PanINs from PDX-1-Cre:LSL-K-rasG12D:Notch1lox/lox pancreata compared to PDX-1-Cre:LSL-K-rasG12D pancreata (Fig. 2C). This indicates that in similar grade lesions more cells were actively proliferating in the PDX-1-Cre:LSL-K-rasG12D:Notch1lox/lox pancreata. To rule out that decreased rates of apoptosis lead to a more severe phenotype in PDX-1-Cre:LSL-K-rasG12D:Notch1lox/lox, we stained sections for cleaved caspase-3. No difference was evident when compared to PDX-1-Cre:LSL-K-rasG12D pancreata (Fig. 2D). These studies demonstrate that the loss of Notch1 in the context of activated K-ras results in increased proliferation rates of pancreatic ductal cells in vivo, increased PanIN incidence, and progression. This implies that Notch1 possesses tumor suppressor-like function in a mouse model of Kras-induced PDAC.
In a recent report, conditionally co-expressing activated Notch and K-ras in mouse pancreata induced synergy in PanIN formation (12). This was interpreted as an indication of Notch1 functioning to inhibit the normal differentiation of the tumor initiating cells in the pancreas. It is possible that differences in target cells and/or timing of recombination events might account for the differences between our findings. In addition, Notch1 expression and activation are highly regulated and overexpression of a constitutively active form of Notch1 could lead to non-physiological phenomena. Finally, a recent report which catalogued core signaling pathways in human pancreatic cancer suggests that the expression levels of Notch-family members and downstream targets were not up-regulated in primary tumor samples and cell lines, when compared to normal pancreatic ductal epithelium (19).
Activation of Notch family members is not responsible for accelerated tumorigenesis in PDX-1-Cre:LSL-K-rasG12D:Notch1lox/lox mice
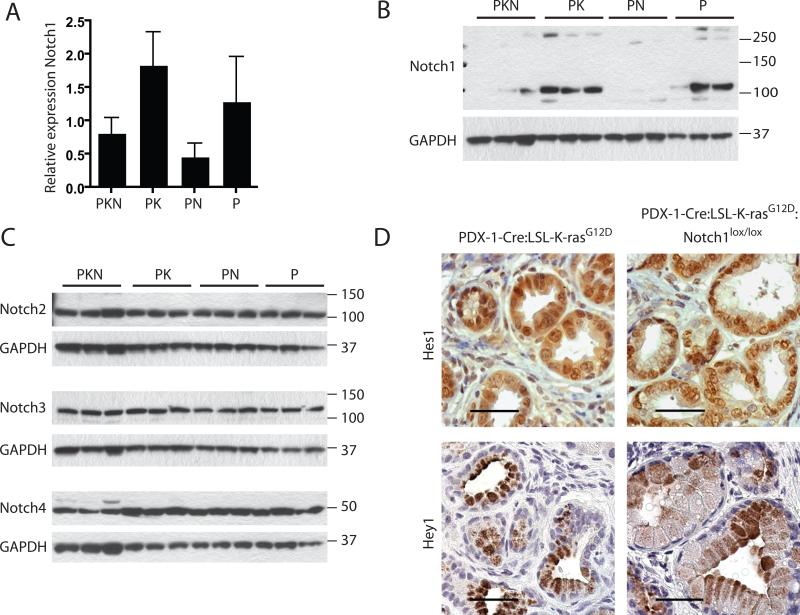
To assess whether other Notch family members (Notch 2- 4) are induced to compensate and substitute for the loss of Notch1, we examined the expression and activation of the Notch family receptors. Employing quantitative PCR to verify loss of Notch1 expression we find, as expected, that expression of Notch1 mRNA was reduced in both the PDX-1-Cre:Notch1lox/lox and PDX-1-Cre:LSL-K-rasG12D:Notch1lox/lox pancreata, when compared to control PDX-1-Cre pancreata. In the PDX-1-Cre:LSL-K-rasG12D pancreata the expression of Notch1 mRNA appeared to be slightly upregulated when compared to PDX-1-Cre (Fig. 3A). Additionally, we analyzed Notch1 protein levels by western blotting, confirming loss of Notch1 in PDX-1-Cre:LSL-K-rasG12D:Notch1lox/lox and PDX-1-Cre:Notch1lox/lox pancreata (Fig. 3B). Western blot analysis of Notch2, 3 and 4, in extracts prepared from pancreas tissue, as above, indicates no significant differences in levels of expression between the cohorts (Fig. 3C). To further establish whether the activity of Notch family members might be increased in the pancreas of PDX-1-Cre:LSL-K-rasG12D:Notch1lox/lox mice we analyzed the expression of established Notch downstream target genes, Hes1 and Hey1, by immunohistochemistry. Expression of Hes1 and Hey1 was detected at similar levels in comparable grade lesions of PDX-1-Cre:LSL-K-rasG12D:Notch1lox/lox mice compared to PDX-1-Cre:LSL-K-rasG12D (Fig. 3D). Collectively our data indicate that Notch1 has been effectively deleted in the pancreas of PDX-1-Cre:LSL-K-rasG12D:Notch1lox/lox mice, and that activation of other Notch family members is not likely to account for the observed acceleration of tumorigenesis in these mice.
Figure 3. Expression of Notch family members and targets in pancreata from cohorts.
(A) Relative expression levels of Notch1 in pancreatic tissue determined by qPCR (normalized to 18srRNA). (B) Western blot analysis of Notch1 in whole pancreatic lysates. Both the full length Notch1 (250kDa) and cleaved Notch1 intracellular domain (120kDa) are detected. Three independent samples are shown for each genotype. PKN=PDX-1-Cre:LSL-K-rasG12D:Notch1lox/lox, PK=PDX-1-Cre:LSL-K-rasG12D, PN=PDX-1-Cre:Notch1lox/lox, P=PDX-1-Cre. (GAPDH =loading control). (C) Expression of Notch 2, 3, and 4 in whole pancreatic lysate determined by western blot analysis. Three independent samples are shown for each genotype. (GAPDH =loading control). (D) Immunohistochemical analysis of Hes1 and Hey1 in similar grade PanIN lesions. Scale bar = 40μm.
Activation of β-catenin in pancreata of PDX-1-Cre:LSL-K-rasG12D:Notch1lox/lox mice
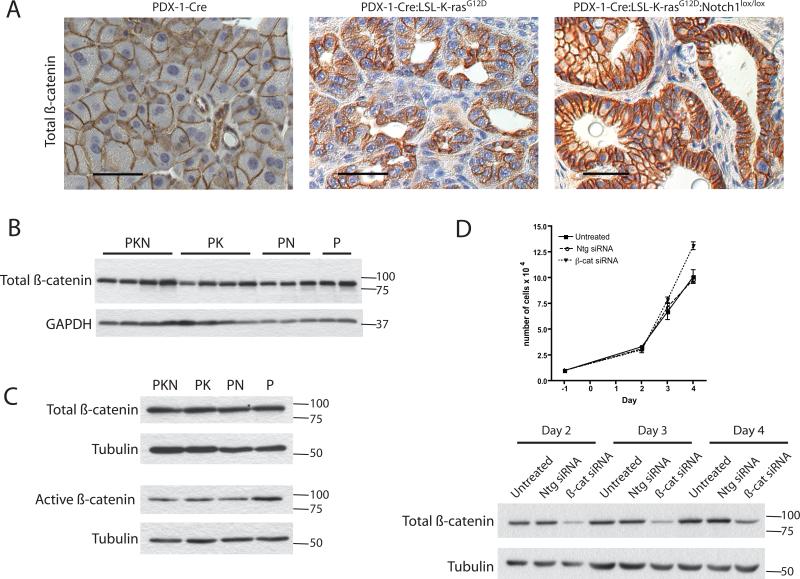
To investigate potential mechanisms underlying the observed tumor suppressive function of Notch1 in K-ras-induced PDA, we examined the status of β-catenin, which has been identified as a target of Notch1's tumor suppressor function in the skin (4, 7). In normal adult pancreas, localization at the cell membrane serves as an indication of inactivity while both cytoplasmic and nuclear localization of β-catenin are commonly regarded as indicators of active canonical Wnt/β-catenin signaling (20). In PDX-1-Cre acinar and ductal cells, total β-catenin was restricted to the cell membrane (Fig. 4A). In PDX-1-Cre:LSL-K-rasG12D β-catenin was observed mostly in ductal cells at the cell membrane and faintly in the cytoplasm (Fig. 4A). In contrast, intense β-catenin staining was observed in the membrane and cytoplasm in PDX-1-Cre:LSL-K-rasG12D:Notch1lox/lox ductal cells, implying β-catenin levels are induced and possibly activated (Fig. 4A). Importantly, total β-catenin levels were similar in pancreatic cells of all genotypes (Fig. 4B).
Figure 4. Expression and activation state of β-catenin in pancreata from cohorts.
Expression and localization of total β-catenin (A) (Scale bar = 40μm) by immunohistochemical staining in pancreata from PDX-1-Cre, PDX-1-Cre:LSL-K-rasG12D, and PDX-1-Cre:LSL-K-rasG12D:Notch1lox/lox mice. (B) Expression levels of total β-catenin in whole pancreatic lysates by western blot analyses. Four independent samples are shown for PDX-1-Cre:LSL-K-rasG12D:Notch1lox/lox (PKN) and PDX-1-Cre:LSL-K-rasG12D (PK) cells, 3 independent samples for PDX-1-Cre:Notch1lox/lox (PN) cells and 2 independent samples forPDX-1-Cre (P) cells. (GAPDH = loading control). (C) Western blot analysis of total and activated β-catenin expression in PDCs. (Tubulin = loading control). Results shown are representative of two independent PDC lines tested for each genotype. (D) Proliferation of PDX-1-Cre:LSL-KrasG12D:Notch1lox/lox PDCs untreated, treated with Non-targeting siRNA pool (Ntg siRNA), or β-catenin siRNA pool (β-cat siRNA). Values shown are the mean of 3 independent samples. Western blot analysis of β-catenin knockdown in PDCs treated with siRNA on days 2, 3, and 4. (Tubulin =loading control).
To further assess β-catenin activation directly in pancreatic ductal cells, we isolated primary pancreatic ductal cells (PDCs) from each of the different genotypes. Western blot analysis revealed no increase in either total or activated β-catenin (dephosphorylated on Ser37 and Thr41) in PDCs derived from PDX-1-Cre:LSL-K-rasG12D:Notch1lox/lox mice compared to the other genotypes (Fig. 4C). Finally, in order to functionally determine if β-catenin is required for proliferation of PDX-1-Cre:LSL-K-rasG12D:Notch1lox/lox PDCs, β-catenin was knocked down in these cells using an siRNA-based approach. Cells treated with β-catenin siRNA displayed a significant reduction in β-catenin levels, however this knockdown did not effect the proliferative capacity of these cells, when compared to untreated cells or cells treated with non-targeting siRNA (Fig. 4D).
These findings suggest that β-catenin repression might not represent the putative tumor suppressive function of Notch1 in our mouse model of K-ras-induced PDAC. This conclusion is based on studies in PDCs and it is possible that these findings do not reflect the complex interactions occurring in vivo.
In conclusion, we show that loss of Notch1, in the context of activated K-ras, leads to acceleration of tumor progression and an increase in PanIN numbers in a mouse model of PDAC. This implies that Notch1 can function as a tumor suppressor in K-ras-induced PDAC and additional studies are required to determine which downstream effectors of Notch1 signaling are essential for this activity.
Supplementary Material
Acknowledgements
We thank M. Wescott and A. Panikkar for technical assistance and I. Coban and D. Altinel for assistance with the analyses of the pancreatic pathology. The work described was funded, in part, by the W.W. Smith Charitable Trust (J.L.K.) and DK056645 (A.K.R.).
References
- 1.Hingorani SR, Petricoin EF, Maitra A, et al. Preinvasive and invasive ductal pancreatic cancer and its early detection in the mouse. Cancer Cell. 2003;4(6):437–50. doi: 10.1016/s1535-6108(03)00309-x. [DOI] [PubMed] [Google Scholar]
- 2.Miyamoto Y, Maitra A, Ghosh B, et al. Notch mediates TGF alpha-induced changes in epithelial differentiation during pancreatic tumorigenesis. Cancer Cell. 2003;3(6):565–76. doi: 10.1016/s1535-6108(03)00140-5. [DOI] [PubMed] [Google Scholar]
- 3.Plentz R, Park JS, Rhim AD, et al. Inhibition of gamma-Secretase Activity Inhibits Tumor Progression in a Mouse Model of Pancreatic Ductal Adenocarcinoma. Gastroenterology. 2009 doi: 10.1053/j.gastro.2009.01.008. [DOI] [PMC free article] [PubMed] [Google Scholar]
- 4.Radtke F, Raj K. The role of Notch in tumorigenesis: oncogene or tumour suppressor? Nat Rev Cancer. 2003;3(10):756–67. doi: 10.1038/nrc1186. [DOI] [PubMed] [Google Scholar]
- 5.Sjolund J, Manetopoulos C, Stockhausen MT, Axelson H. The Notch pathway in cancer: differentiation gone awry. Eur J Cancer. 2005;41(17):2620–9. doi: 10.1016/j.ejca.2005.06.025. [DOI] [PubMed] [Google Scholar]
- 6.Dotto GP. Notch tumor suppressor function. Oncogene. 2008;27(38):5115–23. doi: 10.1038/onc.2008.225. [DOI] [PMC free article] [PubMed] [Google Scholar]
- 7.Nicolas M, Wolfer A, Raj K, et al. Notch1 functions as a tumor suppressor in mouse skin. Nat Genet. 2003;33(3):416–21. doi: 10.1038/ng1099. [DOI] [PubMed] [Google Scholar]
- 8.Demehri S, Turkoz A, Kopan R. Epidermal Notch1 loss promotes skin tumorigenesis by impacting the stromal microenvironment. Cancer Cell. 2009;16(1):55–66. doi: 10.1016/j.ccr.2009.05.016. [DOI] [PMC free article] [PubMed] [Google Scholar]
- 9.Sundaram MV. The love-hate relationship between Ras and Notch. Genes Dev. 2005;19(16):1825–39. doi: 10.1101/gad.1330605. [DOI] [PubMed] [Google Scholar]
- 10.Kiaris H, Politi K, Grimm LM, et al. Modulation of notch signaling elicits signature tumors and inhibits hras1-induced oncogenesis in the mouse mammary epithelium. Am J Pathol. 2004;165(2):695–705. doi: 10.1016/S0002-9440(10)63333-0. [DOI] [PMC free article] [PubMed] [Google Scholar]
- 11.Weijzen S, Rizzo P, Braid M, et al. Activation of Notch-1 signaling maintains the neoplastic phenotype in human Ras-transformed cells. Nat Med. 2002;8(9):979–86. doi: 10.1038/nm754. [DOI] [PubMed] [Google Scholar]
- 12.De La OJ, Emerson LL, Goodman JL, et al. Notch and Kras reprogram pancreatic acinar cells to ductal intraepithelial neoplasia. Proc Natl Acad Sci U S A. 2008;105(48):18907–12. doi: 10.1073/pnas.0810111105. [DOI] [PMC free article] [PubMed] [Google Scholar]
- 13.Jackson EL, Willis N, Mercer K, et al. Analysis of lung tumor initiation and progression using conditional expression of oncogenic K-ras. Genes Dev. 2001;15(24):3243–8. doi: 10.1101/gad.943001. [DOI] [PMC free article] [PubMed] [Google Scholar]
- 14.Radtke F, Wilson A, Stark G, et al. Deficient T cell fate specification in mice with an induced inactivation of Notch1. Immunity. 1999;10(5):547–58. doi: 10.1016/s1074-7613(00)80054-0. [DOI] [PubMed] [Google Scholar]
- 15.Wolfer A, Wilson A, Nemir M, MacDonald HR, Radtke F. Inactivation of Notch1 impairs VDJbeta rearrangement and allows pre-TCR-independent survival of early alpha beta Lineage Thymocytes. Immunity. 2002;16(6):869–79. doi: 10.1016/s1074-7613(02)00330-8. [DOI] [PubMed] [Google Scholar]
- 16.Schreiber FS, Deramaudt TB, Brunner TB, et al. Successful growth and characterization of mouse pancreatic ductal cells: functional properties of the Ki-RAS(G12V) oncogene. Gastroenterology. 2004;127(1):250–60. doi: 10.1053/j.gastro.2004.03.058. [DOI] [PubMed] [Google Scholar]
- 17.Gu G, Brown JR, Melton DA. Direct lineage tracing reveals the ontogeny of pancreatic cell fates during mouse embryogenesis. Mech Dev. 2003;120(1):35–43. doi: 10.1016/s0925-4773(02)00330-1. [DOI] [PubMed] [Google Scholar]
- 18.Siveke JT, Lubeseder-Martellato C, Lee M, et al. Notch signaling is required for exocrine regeneration after acute pancreatitis. Gastroenterology. 2008;134(2):544–55. doi: 10.1053/j.gastro.2007.11.003. [DOI] [PubMed] [Google Scholar]
- 19.Jones S, Zhang X, Parsons DW, et al. Core signaling pathways in human pancreatic cancers revealed by global genomic analyses. Science. 2008;321(5897):1801–6. doi: 10.1126/science.1164368. [DOI] [PMC free article] [PubMed] [Google Scholar]
- 20.Pasca di Magliano M, Biankin AV, Heiser PW, et al. Common activation of canonical wnt signaling in pancreatic adenocarcinoma. PLoS ONE. 2007;2(11):e1155. doi: 10.1371/journal.pone.0001155. [DOI] [PMC free article] [PubMed] [Google Scholar]
Associated Data
This section collects any data citations, data availability statements, or supplementary materials included in this article.


