

Abstract
Despite extensive use of type I collagen for research and medical applications, its fibril-forming or polymerization potential has yet to be fully defined and exploited. Here we describe a type I collagen formulation that is acid solubilized from porcine skin (PSC), quality controlled based upon polymerization potential, and well suited as a platform polymer for preparing three-dimensional (3D) culture systems and injectable/implantable in-vivo cellular microenvironments in which both relevant biochemical and biophysical parameters can be precision-controlled. PSC is compared with 3 commercial collagens in terms of composition and purity as well as polymerization potential, which is described by kinetic parameters and fibril microstructure and mechanical properties of formed matrices. When subjected to identical polymerization conditions, PSC showed significantly decreased polymerization times compared to the other collagens and yielded matrices with the greatest mechanical integrity and broadest range of mechanical properties as characterized in oscillatory shear, uniaxial extension, and unconfined compression. Compositional and intrinsic viscosity analyses suggest that the enhanced polymerization potential of PSC may be attributed to its unique oligomer composition. Collectively, this work demonstrates the importance of standardizing next generation collagen formulations based upon polymerization potential and provides preliminary insight into the contribution of oligomers to collagen polymerization properties.
Keywords: collagen, ECM (extracellular matrix), mechanical properties, fibril microstructure, polymerization, 3D matrix, mesenchymal stem cell differentiation
1. Introduction
Purified type I collagen is routinely used for basic research including creation of physiologically-relevant three-dimensional (3D) culture models, investigation of cell-extracellular matrix (ECM) interactions, and more recently development of engineered tissue constructs1–5. Furthermore, collagen has been processed into various biomaterial forms (e.g., films, fibers, sponges, and fibers) for numerous clinical applications including corneal shields, dermal repair, plastic surgery, drug delivery, and hemostasis6. Collagen is an ideal candidate polymer for such research and medical applications because it serves as the predominant component and primary structural-mechanical determinant of most tissue ECM7,8. Here, it exists as a composite material consisting of an insoluble fibril network surrounded by interstitial fluid. The material properties and microstructure of this fibrous matrix endow tissues with critical physical attributes (e.g. diffusional, mechanical, and degradation/remodeling properties). In addition, collagen imparts its biological activity through cell surface-receptor mediated signaling, primarily through integrin receptors8. Integrins mediate the physical connectivity between the cytoskeletal elements of cells and their surrounding extracellular matrix. In fact, the mechanical force balance that results between a cell and its ECM has been shown to be a critical determinant of cell morphology and fate9–11.
Despite the significant advantages offered by this natural polymer, a number of factors hinder its more wide-spread use, especially for creation of 3D culture systems. At present, both commercial and laboratory grade collagens undergo cursory characterization, primarily focused on molecular mass of constituent polypeptide chains and purity. Furthermore, there is a lack of standardization amongst the various commercial and laboratory-generated collagens which ultimately contributes to significant lot-to-lot and product-to-product variation and makes comparisons between studies difficult1. Soluble collagens traditionally have been used to coat surfaces (e.g., tissue culture plastic or scaffolds) to promote cell adhesion, therefore little focus has been given to polymerization as a functional collagen property. Since collagen fibrils are indeed the fundamental unit of the ECM, elucidation of the mechanisms underlying collagen polymerization and how it contributes to the fibril organization and mechanical properties of collagen matrices are critical to the study of cell-ECM interactions. In addition, such information will contribute to the rational design of next generation collagen polymer formulations that can recapitulate and facilitate precision-tuning of the multiple, dynamic signaling modalities (biochemical and physical) inherent to 3D cellular microenvironments.
Unfortunately, due to collagen's complexity in design and relatively unique protein biochemistry, the term collagen is often generally applied to preparations that differ significantly in molecular composition and ability to form supramolecular structures (aggregates versus fibrils). Collagen molecules are approximately 300kD in size and exist as coils of three intertwined helical polypeptides consisting generally of two alpha 1(I) (αI(I)) and a single α2(I) chains. Collagen molecules self-assemble in a hierarchical fashion to form micro-fibrils, fibrils, fibers, and fiber networks or bundles. Mechanical and chemical stability of the fibril network is further derived from cross-links between polypeptide chains within the same molecule (intra-molecular) and between different molecules (inter-molecular)2. Type I collagens routinely used for basic research and tissue engineering applications are solubilized from different source tissues and animals (e.g., rat tail tendon, calf skin) using a variety of methods involving neutral salt, dilute acid solutions, or enzymes (e.g., pepsin and pronase). It is important to note that the purity and integrity of the collagen polypeptides and molecules (e.g., presence of telopeptides, cross-links, monomer/oligomer fractions), kinetics of polymerization, and structural-mechanical properties of polymerized fibrils differ based upon the isolation technique employed12–15. For example, partial loss of telopeptides from collagen molecules, as occurs with pepsin or pronase digestion16, has major effects on fibril growth, including loss of diameter uniformity, loss of unidirectional packing, and changes in the fibril assembly pathway17.
Over the last several years we have attempted to use commercial collagens for correlating physical design properties of 3D collagen matrices with cellular responses. The overarching goal of these efforts was to develop a soluble collagen formulation designed to polymerize in situ to form a 3D fibril-based microenvironment, serving to both entrap cells when forming tissue constructs in vitro or used as an injectable cell-delivery vehicle or biomaterial in vivo. Furthermore, this 3D microenvironment would be tunable in terms of relevant biochemical and biophysical cues such that the survival and fate of embedded cells could be predictably modulated. Unfortunately, use of such collagens in this capacity yields matrices that possess low reproducibility, slow polymerization rates, low mechanical integrity, and a limited range of fibril microstructures and mechanical properties. To remedy these problems we developed a new soluble collagen formulation derived from porcine skin. Acid solubilization was used to maintain the integrity of telopeptide regions, which are known to be critical elements of the assembly process. In addition, isolation and characterization of this collagen focused not only on purity and molecular composition but also on polymerization potential (e.g., kinetics of matrix assembly and fibril microstructure and mechanical properties of formed matrices). Here we present results from studies where pig skin collagen (PSC) and 3 common commercial sources were compared in terms of molecular composition, polymerization kinetics, 3D fibril network organization (microstructure), and mechanical properties. Matrices were tested in shear, compression, and uniaxial extension to fully characterize mechanical properties and gain insight into important relationships between fibril microstructure and mechanical properties18. Collagen concentration was co-varied with source in order to correlate changes in matrix properties between these two variables. Finally, we document the ability of cultured mesenchymal stem cells (MSC) to differentially sense and respond to the range of physical properties provided by PSC matrices. Results from this work are important because defining the parameters that control the polymerization kinetics of collagen as well as the functional microstructure-mechanical relationships that result upon polymerization is an essential first step in the design and standardization of collagen formulations to be used for future in vitro cell culture, tissue engineering, and regenerative medicine applications.
2. Materials and Methods
2.1. Preparation and analysis of purified type I collagens
Porcine skin collagen (PSC) was acid solubilized from the dermis of market weight animals according to a modified protocol from Gallop and Seifter19. Prior to use, lyophilized PSC was dissolved in 0.01 N HCl and rendered aseptic by exposure to chloroform overnight at 4°C. PSC was compared to three commercial grade type I collagen sources. PureCol, previously marketed as Vitrogen (Inamed, Fremont, CA), represents a pepsin digested type I collagen harvested from bovine dermis and was purchased as a sterile solution (~ 3 mg/ml) in 0.01 N hydrochloric acid (HCl). Acid solubilized type I collagen harvested from bovine dermis was purchased in a lyophilized form from Sigma-Aldrich (St. Louis, MO). Prior to use, Sigma collagen (referenced as Sigma) was dissolved in 0.01 N HCl and rendered aseptic by exposure to chloroform overnight at 4°C. Acid solubilized type I collagen harvested from rat tails was purchased as a sterile solution (8–10 mg/ml) in 0.02 N acetic acid from BD Biosciences (Bedford, MA, referenced as BD-rat tail collagen (BD-RTC)). Collagen concentration was determined using a Sirius Red (Direct Red 80) assay as previously described 20,21. Standard curves were generated based on manufacturer specified concentrations of both PureCol and BD-RTC and found to match identically.
Sodium dodecyl sulfate polyacrylamide gel electrophoresis (SDS-PAGE) was used to assess the purity and molecular composition of each collagen source. 8% Novex Tris-Glycine gels (Invitrogen, Carlsbad, CA) were used for identification of non-collagenous proteins and small molecular weight contaminants. SDS-PAGE in interrupted and uninterrupted formats22 and western blot analysis using mouse monoclonal antibodies specific for type I (AB6308, Abcam, Cambridge, MA) and type III (MAB 1343, Chemicon, Temecula) collagen were used for analysis of collagen type content (e.g. types I, III, and V). Gels were stained with Coomassie Blue (Sigma-Aldrich) or silver nitrate and imaged using a digital camera and light box. An alcian blue assay was used as previously described23 to assess sulfated glycosaminoglycan (GAG) content. Heparin derived from porcine intestinal mucosa (Sigma-Aldrich) was used to prepare a standard curve (1–20 heparin units/ml).
Intrinsic viscosity of soluble collagen preparations was determined as previously described24. In brief, apparent viscosities (shear stress/shear rate) of collagen solutions in 0.01N HCl were measured on an AR2000 rheometer (TA Instruments, New Castle, DE) with a cone and plate geometry (40mm, 2° cone angle). Viscosities of solutions representing concentrations of 0.1 mg/ml, 0.2 mg/ml, and 0.3 mg/ml were measured at shear rates of 100–1500 s−1 at 10°C in triplicate. Intrinsic viscosity [η] (ml/mg) was determined by a dual extrapolation procedure at a zero concentration and zero shear rate. From intrinsic viscosity measurements, the average molecular weight (M) may be estimated using the Mark-Houwink equation, [η] = kMa, where parameters k and a are dependent upon the polymer-solvent system.
2.2. Preparation of 3D collagen matrices
All collagen preparations were polymerized under identical reaction conditions to produce 3D matrices. Collagen solutions were diluted with 0.01 N HCl and neutralized with 10X phosphate buffered saline (PBS, 1X PBS had 0.17 M total ionic strength and pH 7.4) and 0.1 N sodium hydroxide to achieve neutral pH (7.4) and final collagen concentrations ranging from 0.5 to 4 mg/ml. PureCol matrices were limited to ≤2.0 mg/ml due to the available stock concentration of ~3.0 mg/ml. Neutralized collagen solutions were kept on ice prior to the induction of polymerization by warming to 37°C. Due to the increased viscosity of collagen solutions, positive displacement pipettes (Microman, Gilson, Inc., Middleton, WI) were used to accurately pipette all collagen solutions.
2.3. Analysis of collagen polymerization
A turbidimetric assay was used to analyze the polymerization (fibrillogenesis) kinetics of each collagen source. Neutralized collagen solutions prepared from each source at both 0.5 and 1 mg/ml collagen concentrations were transferred into pre-chilled (4°C) 96-well plates prior to polymerization. Plates were loaded into a preheated (37°C) Spectra Max 190 plate reader (Molecular Devices, Sunnyvale, CA) and absorbance at 405 nm (A405) was measured at 10 s intervals for 2 h. Kinetic parameters calculated from the sigmoidal-shaped turbidity curves included lag time (x-intercept of line tangent to the inflection point of the sigmoidal turbidty curve), polymerization rate during growth phase (slope averaged around inflection point), maximum absorbance value, and polymerization half-time (time at which absorbance equals half the maximum absorbance value). Turbidity measurements were performed on 3 independently prepared matrices per matrix formulation (n = 3).
2.4. Analysis of collagen fibril microstructure
Collagen matrices prepared from each collagen source at concentrations ranging from 0.5 to 3 mg/ml were polymerized (2 h in 37°C humidified incubator) in Lab-Tek IV chambered coverglass slides (Nunc, Thermo Fisher Scientific, Rochester, NY) and overlaid with PBS. Confocal reflection microscopy (CRM) was used to collect high resolution 3D images of the matrices in their native, hydrated state25. Confocal imaging was performed on an Olympus Fluoview FV1000 confocal system adapted to an Olympus IX81 inverted microscope with a 60X UPlanSApo water immersion objective (Olympus, Tokyo, Japan). Image stacks were collected at 3 to 5 random locations within each of 2 independent matrices (n = 6–10 images) per matrix formulation. The 3D fibril network was visualized using Imaris 5.0 software (Bitplane Inc., St. Paul, MN). Two microstructural parameters, fibril volume fraction (fibril density) and fibril diameter, were quantified from images. For fibril volume fraction, images were read into Matlab (Mathworks, Natick, MA) and binarized by thresholding. Each threshold value was chosen mathematically as the center of the concave bend in the sigmoidal decay curve of fibril volume fraction versus threshold value for that image. Fibril volume fraction was calculated as the percentage of fibril-containing voxels to total image voxels. Fibril diameters were measured from image stacks in random order using a measurement tool in the Imaris software. Sixteen random fibrils (defined as single, non-dividing fibrils) were measured from 3 different images of each treatment group (n = 48 fibrils). Each fibril diameter represents the average of 3 diameters measured along the major axis of an individual fibril. Fibril measurements were validated by a blinded observer.
2.5. Analysis of matrix mechanical properties in shear, compression, and uniaxial extension
Viscoelastic properties of polymerized collagen matrices were measured in both oscillatory shear and compression on a stress-controlled AR2000 rheometer (TA Instruments, New Castle, DE) using a stainless steel 40 mm diameter parallel plate geometry. Each sample was polymerized on the rheometer to standardize sample geometry and adherence to plates. The neutralized collagen solution (1 ml) was pipetted onto the bottom plate and the geometry lowered to the gap distance (725 μm). A peltier heater in the base plate was used to induce polymerization and maintain temperature at 37°C. Humidity was maintained using a solvent trap. Samples were allowed to polymerize for 30 min, which was sufficient time for polymerization due to conductive (rather than convective) heating. Following polymerization a shear strain sweep from 0.01 to 5% strain at 1 Hz (chosen from predetermined linear viscoelastic response regions) was used to measure the shear modulus (reported values are at 1% strain). The controlling software calculated shear storage (G', elastic/solid component representing stored, recoverable energy) and loss (G”, viscous/fluid component representing energy permanently lost during deformation) moduli, which are related by phase shift (δ) as tan(G”/G').
Following the strain sweep, compressive behavior of each sample was evaluated in an unconfined format. Normal force was measured in response to compressive strain generated by depressing the geometry at a rate of 20 μm/s (strain rate 2.76%/s). Stress-strain plots were generated for each sample, with compressive strain calculated as 1 - L/L0 (Cauchy or engineering strain, L = height and L0 = initial height) and stress calculated as normal force divided by plate area26. The compressive modulus (Ec) was calculated using linear regression of the slope of the stress-strain curve from approximately 15 to 60% strain (Fig. 6a). Shear and compression tests were performed on 3 independent matrices per matrix formulation (n = 3).
Fig. 6.

Unconfined compression stress-strain curves (A) and modulus (EC, B) for matrices prepared with PSC or commercial collagen sources at varied concentrations. Representative stress-strain curves for each source prepared at 2 mg/ml are shown to illustrate source-dependent compressive behavior (curves are mean ± SD (n = 3) with SD plotted at 10% strain intervals for clarity). EC, measured in a linear region of curves from 15 to ~60 % strain as indicated in (A), increased with collagen concentration in a source dependent fashion. PSC exhibited the largest EC at each concentration (p<0.05).
Uniaxial extension testing of polymerized collagen matrices was performed on a custom built uni-/bi-axial testing instrument. Briefly, collagen matrices were polymerized (2 h in 37°C humidified incubator) in dogbone-shaped molds27. Pieces of hook and loop style fastener (6 × 10 mm) were embedded in each end prior to matrix polymerization to facilitate attachment to force transducer/actuator (hooks on transducer/actuators were inserted through holes in fastener blocks)28. Samples were tested at room temperature (22°C) while submersed in PBS (pH 7.4). A 5 g beam style force transducer (LBQ630, Cooper Instruments; Warrenton, VA) was used to record force during uniaxial extension (10 mm/min, strain rate 35.7% /min). LabView software with a National Instruments cRIO-9012 acquisition and control system (National Instruments, Austin, TX) was used to control actuators and record load displacement data. Engineering strain (ε) was calculated as the displacement (ΔL) divided by the original length (L0) between attachment blocks (ε = ΔL/L0). For comparison, stress (σ) was calculated in two fashions: 1) “engineering” stress (σe) was calculated as the force (F) divided by the initial cross-sectional area (A0) of the gauge section (7.2 mm2, σe = F/A0), and 2) “true” stress (σt) was calculated as F divided by the actual, real-time cross-sectional area (Aa) as measured from images of the gauge section width and height (σt = F/Aa,29). Images were collected at 2 s intervals using a digital camera (Retiga 4000R, Qimaging; Surrey, BC, Canada) equipped with a telecentric lens (TEC-M55, Computar; Commack, NY) looking down on the gauge section with an adjacently placed 45° prism to capture gauge section height. Tensile moduli (ET) were calculated using linear regression for both σe and σt data as the slope of the stress-strain curves from 20 to 80% for σe and 40 to 80% for σt of the maximum stress achieved during loading (ultimate stress, σU). Failure strain (εF) was the strain at which matrices experienced total failure (separation). Only samples failing in the gauge section were used for σU and εF analyses, but all were used in the measurement ET as this was well before failure and ET were consistent with other samples. Tensile testing was performed on 3 to 10 independent matrices per matrix formulation (n = 3–10).
2.6 Preparation and Analysis of 3D Tissue Constructs
Mesenchymal stem cells (D1) derived from mouse bone marrow were obtained from American Type Culture Collection (Manassas, VA). MSC were grown in Dulbecco's Modified Eagle's Medium (DMEM; Sigma-Aldrich) supplemented with 1.5 g/L sodium bicarbonate, 10% fetal bovine serum (FBS, Sigma-Aldrich), 100 U/ml penicillin (Gibco, Carlsbad, CA) and 100 μg/ml streptomycin (Gibco). MSC were grown and maintained in a humidified environment of 5% CO2 at 37°C. To ensure multipotency, MSCs were kept below 80% confluence and used in experiments at passage 6 to 9.
Three-dimensional tissue constructs consisting of MSC embedded within PSC matrices were prepared as described previously30. Collagen fibril density and matrix shear storage modulus (G', stiffness) was systematically varied by adjusting the collagen concentration. MSCs were harvested in complete medium and added at a relatively low cell density (5×10⁴ cells/ml) as the last component before polymerization within a humidified environment at 37°C. Following polymerization, complete medium was added and the tissue constructs were maintained in a humidified environment at 37°C and 5% CO2. The day the cells were seeded within the PSC matrices was denoted Day 0. On Day 1, tissue constructs were treated with one of two different medium formulations: “Regular” consisted of DMEM containing 4 mM L-glutamine, 4.5 g/L glucose, 1.5 g/L sodium bicarbonate, and 1.0 M sodium pyruvate, and supplemented with 10% fetal bovine serum, 100 U/ml penicillin, and 100 μg/ml streptomycin. “Adipogenic” consisted of “regular” medium supplemented with 1 μM dexamethasone, 0.5 mM isobutyl-methylxanthine, and 1 μg/ml insulin31. MSC were seeded at 1.25×10⁴ cells/cm2 and cultured in parallel fashion on tissue culture plastic.
Tissue constructs were harvested at designated time points up to 14 days and fixed in 4% formaldehyde. To visualize lipid-filled vacuoles, a hallmark of adipogenesis, cells and tissue constructs were stained with Oil Red O (Sigma-Aldrich). Alizarin red S (Sigma-Aldrich) was used to stain for calcium, a marker of osteogenesis. Cells cultured on plastic or within collagen constructs were viewed using an inverted microscope (Nikon Eclipse TE200-S) and photographed (QImaging Retiga 4000R; Vancouver, BC). For each experiment, the mean and standard deviation of adipocyte and calcified nodule counts were determined for three replicate wells. Each experiment was repeated three times.
Tissue constructs were cryopreserved, and total RNA was isolated using established methodologies32 with modifications. Total RNA was treated with Turbo DNA-free (Ambion, Inc., Austin, TX) and quantified using a Nanodrop ND-1000 spectrophotometer (Nanodrop Technologies, Inc., Wilmington, DE). Reverse transcription was performed using the High-Capacity cDNA Archive Kit (Applied Biosystems, Foster City, CA). Relative quantification of gene expression was performed using the ABI 7500 real-time polymerase chain reaction (RT-PCR) system (Applied Biosystems). TaqMan® Gene Expression Assay kits (Applied Biosystems) were used to identify transcript levels of tissue-specific genes. The endogenous control was 18S, and core binding factor alpha 1 (CBFA1 or runx2) was used to assess early osteogenesis and lipoprotein lipase (LPL) was an indicator of adipogenesis (Assays on Demand: 18S: Hs99999901_s1, CBFA1: Mm00501578_m1, and LPL: Mm00434764_m1; Applied Biosystems). Relative gene expression was calculated using the comparative Ct method relative to undifferentiated MSCs. Total messenger RNA was isolated from 4 to 6 replicate wells for each experiment. Each experiment was repeated at least three times.
2.7. Statistical analysis
All measured values are reported as mean ± standard deviation (SD). Statistical analyses were performed using SAS v. 9.1 (SAS Institute Inc, Cary, NC). To determine differences among treatment groups the general linear model (GLM) procedure was used to conduct unbalanced analysis of variance (ANOVA, in some cases a Kruske-Wallis ANOVA for nonparametric distributions) and perform multiple comparisons of least squares means using the Tukey-Kramer method. In cases of co-varied collagen source and concentration, data was routinely grouped by source or concentration for single factor ANOVA (e.g. compare means of all concentrations of a single source or all sources at a single concentration). Differences were considered statistically significant when p<0.05.
3. Results
3.1. PSC has a unique molecular composition compared to commercial collagen sources
SDS-PAGE analysis under denaturing conditions showed that PSC and commercial collagen sources contained highly purified type I collagen protein. Each collagen source displayed the expected banding patterns for type I collagen including individual α, beta (β), gamma (γ), and high molecular weight components (Fig. 1A). Interestingly, PSC contained prominent banding between the β and γ components with molecular weights in the range of 250–280 kDa (arrow Fig. 1A). Western blot analysis confirmed that the band contained the type I collagen epitope (Fig. 1B). While β and γ bands were identifiable within PureCol, they showed noticeable differences in their mobility and/or proportions compared to those of acid-solubilized collagens. Such observations are expected since PureCol is isolated using limited proteolytic digestion thereby retaining some telopeptides and level of molecular cross-linking. Western blot analysis as well as interrupted gel electrophoresis confirmed that PSC and the other commercial collagens did not contain significant levels of collagen types III and V (data not shown). Furthermore, significant levels of glycosaminoglycans or non-collagenous proteins were not identified within any of the sources.
Fig. 1.

Polypeptide composition of PSC (A; Lane 1), Sigma (Lane 2), BD-RTC (Lane 3), and PureCol (Lane 4) collagen sources as determined using SDS-PAGE (4%) under reducing conditions. PSC contained a prominent protein band intermediate in molecular weight to β and γ bands (arrow). Western blot analysis (B; Lane 2) confirmed that this band contained the type I collagen epitope with corresponding Coomassie Blue-stained bands shown in Lane 1.
Based upon results from the compositional analyses, we speculated that PSC contained a unique composition of oligomers. Oligomers represent at least two collagen molecules (monomers) that are covalently cross-linked and, together with monomers, are inherent outcomes of collagen isolation from tissues. As such, follow-up studies were performed to determine the intrinsic viscosity as a means of estimating the average molecular weight of the polymeric solutions. As expected, PSC exhibited a significantly higher intrinsic viscosity (and therefore average molecular weight) at 2.85 ± 0.07 ml/mg compared to the commercial collagens (p<0.05). Intrinsic viscosity measurements for PureCol, Sigma, and BD-RTC were 2.50 ± 0.06 ml/mg, 2.38 ± 0.02 ml/mg, and 1.15 ± 0.02 ml/mg, respectively.
3.2. PSC exhibits rapid polymerization
Upon neutralization, PSC transitioned within minutes from its solution form to an insoluble, fibril-based matrix. Turbidimetric analysis showed that all collagen sources displayed sigmoidal-shaped polymerization curves with characteristic lag, growth, and plateau regions. Quantified kinetic parameters, including lag time, polymerization rate during growth phase, final absorbance, and polymerization half-time are listed in Table 1. Importantly, each collagen source had distinct polymerization kinetics (Fig. 2), suggestive of differences in fibril formation and growth mechanisms which ultimately affects fibril structure and fibril-fibril interactions. Polymerization half-times ranged widely from 8 to 52 min. Half-times were shortest for PSC and BD-RTC (statistically same, p=0.35) and longest for PureCol (p<0.05). Lag times and polymerization rates followed same trends. Increasing collagen concentration primarily affected final A405 values while slightly decreasing lag and half-times. Interestingly, BD-RTC and PureCol had significantly larger final A405 values than PSC and Sigma, indicating that absorbance values were also dependent on source and not directly relatable to collagen concentration.
Table 1.
Collagen polymerization kinetic parameters for PSC and commercial collagen sources
| Collagen Source | Concentration (mg/ml) | Lag Time (min) | Polymerization Rate During Growth Phase (10−3 /min) | Final Absorbance Value | Polymerization Half-time (min) |
|---|---|---|---|---|---|
| PureCol | 0.5 | 38.9 ± 4.3 | 21.5 ± 6.2 | 0.303 ± 0.040 | 40.9 ± 4.1 |
| 1 | 50.7 ± 2.4 | 36.8 ± 0.7 | 0.504 ± 0.015 | 52.3 ± 2.1 | |
|
| |||||
| Sigma | 0.5 | 36.0 ± 5.6 | 9.9 ± 1.9 | 0.171 ± 0.011 | 38.3 ± 4.7 |
| 1 | 33.6 ± 1.0 | 20.5 ± 1.1 | 0.314 ± 0.010 | 35.5 ± 0.8 | |
|
| |||||
| BD-RTC | 0.5 | 10.1 ± 2.1 | 56.4 ± 1.1 | 0.289 ± 0.016 | 12.5 ± 1.9 |
| 1 | 7.4 ± 1.2 | 130.9 ± 15.0 | 0.561 ± 0.042 | 9.5 ± 1.3 | |
|
| |||||
| PSC | 0.5 | 7.9 ± 1.1 | 56.8 ± 1.9 | 0.182 ± 0.008 | 9.5 ± 1.0 |
| 1 | 6.1 ± 1.1 | 102.9 ± 18.8 | 0.322 ± 0.021 | 7.7 ± 0.9 | |
Fig. 2.
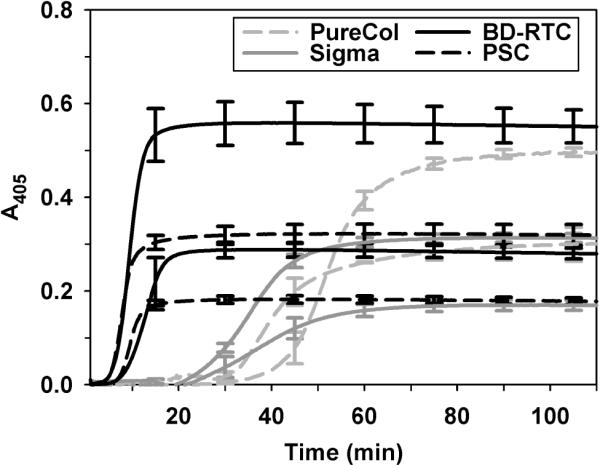
Polymerization kinetics of PSC and commercial collagen sources measured spectrophotometrically at 405 nm. Sources were polymerized at concentrations of 0.5 mg/ml and 1.0 mg/ml (lower and upper curves for each collagen source, respectively). Curves represent mean ± SD (n = 3) with SD plotted at 15-minute intervals for clarity. Kinetic parameters calculated from curves are summarized in Table 1.
3.3. PSC forms 3D fibril networks with tunable fibril density
CRM analysis showed that matrices produced with PSC and other collagen sources generally appeared as highly porous 3D networks of collagen fibrils linked and entangled together (Fig. 3). The structural organization of fibril networks showed subtle variations with collagen source. Specifically, each source appeared to produce different fibril-fibril interactions, such as fibril coalescence or bundling events (Fig. 3, arrows). PureCol matrices were most dissimilar displaying less fibril coalescence and appearing more homogeneous, possibly relating to being pepsin digested. Increasing collagen concentration resulted in similar network organizations with increased fibril density for each source. Fibril volume fraction (fibril density) was quantified from CRM images and found to increase linearly with collagen concentration (Fig. 4A, Table 2 catalogs all measured microstructure and mechanical properties for comparison and reference). PSC, Sigma, and BD-RTC fibril volume fractions were not significantly different at any concentration (p≥0.13 at each concentration). PureCol was only significantly different from other sources at 2 mg/ml (p<0.05). Thus, in general, fibril density was not dependent on collagen source. Sigma, BD-RTC and PSC fibril volume fractions increased at a level of 3.09 ± 0.44% /(mg/ml) with collagen concentration (mean ± SD of 3 sources), while PureCol's level of increase, 4.69% /(mg/ml), was different.
Fig. 3.

Collagen fibril microstructure of matrices prepared with PSC and commercial collagen sources as visualized using CRM. Representative CRM images are shown for each source (PureCol (A,B), Sigma (C,D), BD-RTC (E,F), and PSC (G,H)) polymerized at 0.5 mg/ml (top row) and 2.0 mg/ml (bottom row; scale bar = 10 μm). Subtle differences in fibril network organization and fibril-fibril interactions, such as bundling/coalescence (arrows E,G) were observed between the sources. Increasing collagen concentration appeared to increase fibril density while maintaining similar fibril diameters and network organizations.
Fig. 4.

Fibril volume fraction (fibril density, A) and average fibril diameter (B) measured from CRM images of matrices prepared with different collagen sources and concentrations. Fibril volume fraction increased linearly with collagen concentration and was not significantly dependent on source (with the exception of PureCol at 2 mg/ml (p<0.05), n = 6–10 images per matrix formulation). Average fibril diameter showed a small, but significant dependence on collagen source (p<0.05 at each concentration, n = 48 fibrils per matrix formulation). In general, fibril diameters did not change with collagen concentration.
Table 2.
Summary of mechanical and microstructural properties of 3D collagen matrices prepared with PSC and commercial collagen sources.
| Collagen Source | Concentration (mg/ml) | Microstructure | Shear | Compression | |||
|---|---|---|---|---|---|---|---|
| Fibril Volume Fraction (%) | Avg. Fibril Diameter (um) | G' (Pa) | G” (Pa) | δ (degrees) | Ec (kPa) | ||
| PureCol | 0.5 | 9.21 ± 0.782 | 436 ± 52.8 | 2.33 ± 0.35 | 0.557 ± 0.146 | 13.3 ± 1.58 | 0.768 ± 0.741 |
| 1 | 11.4 ± 0.589 | 420 ± 49.4 | 9.77 ± 4.95 | 2.02 ± 1.10 | 11.4 ± 0.849 | 3.05 ± 2.32 | |
| 1.5 | 13.4 ± 2.14 | 410 ± 61.8 | 20.9 ± 8.78 | 4.40 ± 2.12 | 11.6 ± 1.45 | 4.44 ± 0.689 | |
| 2 | 16.3 ± 1.67 | 435 ± 55.5 | 37.2 ± 17.5 | 7.51 ± 3.46 | 11.5 ± 1.24 | 9.79 ± 2.79 | |
|
| |||||||
| Sigma | 0.5 | 7.71 ± 0.609 | 339 ± 35.5 | 8.96 ± 2.07 | 1.07 ± 0.176 | 6.89 ± 0.556 | 2.11 ± 0.347 |
| 1 | 11.0 ± 1.05 | 340 ± 33.8 | 35.9 ± 2.29 | 3.83 ± 0.257 | 6.09 ± 0.0992 | 3.06 ± 1.82 | |
| 2 | 12.1 ± 0.764 | 320 ± 29.1 | 142 ± 11.6 | 15.2 ± 1.03 | 6.08 ± 0.206 | 3.45 ± 0.878 | |
| 3 | 17.2 ± 0.902 | 313 ± 39.0 | 221 ± 12.2 | 24.8 ± 1.22 | 6.39 ± 0.0494 | 5.10 ± 1.71 | |
| 4 | - | - | 343 ± 27.9 | 39.8 ± 1.40 | 6.63 ± 0.326 | 6.50 ± 0.961 | |
|
| |||||||
| BD-RTC | 0.5 | 8.65 ± 0.907 | 390 ± 38.8 | 1.71 ± 0.226 | 0.233 ± 0.0066 | 7.78 ± 0.751 | 0.412 ± 0.339 |
| 1 | 9.99 ± 1.69 | 381 ± 50.5 | 7.33 ± 0.106 | 1.03 ± 0.0139 | 8.02 ± 0.0430 | 0.348 ± 0.0363 | |
| 2 | 12.5 ± 1.86 | 411 ± 62.8 | 34.8 ± 1.66 | 4.91 ± 0.273 | 8.01 ± 0.0701 | 0.465 ± 0.146 | |
| 3 | 15.1 ± 1.92 | 401 ± 57.4 | 75.7 ± 6.01 | 10.4 ± 1.34 | 7.82 ± 0.409 | 1.50 ± 0.231 | |
| 4 | - | - | 138 ± 0.611 | 20.1 ± 0.206 | 8.28 ± 0.0596 | 1.62 ± 0.273 | |
|
| |||||||
| PSC | 0.5 | 8.06 ± 0.980 | 391 ± 50.6 | 27.3 ± 3.51 | 2.20 ± 0.187 | 4.62 ± 0.218 | 5.31 ± 1.22 |
| 1 | 9.18 ± 1.30 | 367 ± 49.6 | 126 ± 8.74 | 8.45 ± 0.281 | 3.82 ± 0.214 | 11.1 ± 3.55 | |
| 2 | 13.3 ± 2.55 | 381 ± 41.6 | 491 ± 12.3 | 29.9 ± 0.383 | 3.48 ± 0.0613 | 20.0 ± 1.18 | |
| 3 | 15.9 ± 2.98 | 379 ± 54.8 | 1010 ± 69.9 | 61.3 ± 2.58 | 3.49 ± 0.111 | 30.1 ± 1.64 | |
| 4 | - | - | 1440 ± 54.3 | 88.1 ± 4.21 | 3.49 ± 0.0422 | 42.8 ± 2.99 | |
| Collagen Source | Concentration (mg/ml) | Uni-axial Tension | ||||
|---|---|---|---|---|---|---|
| “engineering” ET (kPa) | “engineering” σu (kPa) | Failure Strain (%) | “true” ET (kPa) | “true” σu (kPa) | ||
| PureCol | 0.5 | 0.797 ± 0.299 | 0.222 ± 0.135 | 32.7 ± 6.99 | 42.5 ± 27.6 | 8.05 ± 3.84 |
| 1 | 1.71 ± 0.360 | 0.467 ± 0.169 | 60.0 ± 5.67 | 83.5 ± 10.5 | 18.7 ± 2.10 | |
| 1.5 | 1.66 ± 0.430 | 0.504 ± 0.145 | 59.6 ± 10.4 | 52.8 ± 23.3 | 16.6 ± 4.52 | |
| 2 | 2.05 ± 0.390 | 0.567 ± 0.0889 | 55.4 ± 4.40 | 24.9 ± 12.3 | 6.29 ± 2.85 | |
|
| ||||||
| Sigma | 0.5 | 12.3 ± 1.54 | * | * | 765 ± 129 | * |
| 1 | 23.6 ± 1.46 | * | * | 798 ± 455 | * | |
| 2 | 30.7 ± 3.42 | 11.7 ± 0.939 | 58.4 ± 7.05 | 619 ± 409 | 125 ± 89.4 | |
| 3 | 27.5 ± 1.69 | 12.5 ± 0.206 | 63.3 ± 5.33 | 458 ± 109 | 92.4 ± 29.8 | |
| 4 | 57.3 ± 2.86 | 23.2 ± 4.22 | 57.3 ± 11.3 | 792 ± 561 | 215 ± 129 | |
|
| ||||||
| BD-RTC | 0.5 | 4.43 ± 1.83 | 0.948 ± 0.469 | 43.3 ± 3.90 | 191 ± 59.9 | 28.1 ± 19.2 |
| 1 | 5.32 ± 0.632 | 1.21 ± 0.152 | 44.1 ± 3.36 | 196 ± 57.5 | 46.9 ± 32.5 | |
| 2 | 4.53 ± 2.62 | 1.25 ± 0.746 | 46.1 ± 5.95 | 70.8 ± 63.3 | 14.4 ± 13.6 | |
| 3 | 2.23 ± 0.968 | 0.414 ± 0.361 | 41.2 ± 5.19 | 17.0 ± 14.6 | 1.60 ± 1.32 | |
| 4 | 1.44 ± 0.595 | 0.518 ± 0.240 | 57.3 ± 6.99 | 8.06 ± 6.12 | 2.48 ± 1.73 | |
|
| ||||||
| PSC | 0.5 | 32.6 ± 1.93 | 6.49 ± 0.452 | 43.3 ± 3.90 | 2900 ± 886 | 384 ± 127 |
| 1 | 99.0 ± 7.80 | 17.0 ± 2.99 | 45.1 ± 2.99 | 4980 ± 1160 | 532 ± 140 | |
| 2 | 186 ± 23.6 | 38.4 ± 2.48 | 43.9 ± 3.86 | 6510 ± 889 | 774 ± 135 | |
| 3 | 231 ± 7.98 | * | * | 7190 ± 2040 | * | |
| 4 | 277 ± 34.9 | * | * | 6940 ± 1320 | * | |
failure occurred in attachment block region for >50% of matrices; − 4mg/ml matrix CRM data was not collected
Measurement of fibril diameters from CRM images revealed that collagen source had a small, but significant effect on average fibril diameter (Fig. 4B). As an important distinction, fibril diameters here represent single fibrils that did not appear to further divide, meaning larger coalesced/bundled fibrils (Fig. 3, arrows) weren't measured. At a given collagen concentration, average fibril diameters were significantly different between collagen sources (p<0.05). Specifically, Sigma produced the smallest fibrils, PSC and BD-RTC intermediate sized fibrils, and PureCol the largest fibrils. Note that standard deviations (ranging 30–50 nm) are reported to describe fibril populations, but due to large n-value standard error of the means were 5–8 nm. Interestingly, the larger average diameter of PureCol fibrils was consistent with the qualitative appearance of thicker, more homogenous fibrils. In general, average fibril diameters for each collagen source did not significantly change with collagen concentration.
3.4. PSC matrices show high mechanical integrity with tunability across a broad range of mechanical properties
Since collagen matrices represent composite viscoelastic materials, the mechanical properties of PSC were determined using multiple loading formats, including oscillatory shear, compression, and uniaxial extension, and compared to that of commercial collagens. This comprehensive mechanical properties evaluation provided critical insight into the disparate fibril microstructure-mechanical behavior of each collagen source.
3.4.1. Shear
Oscillatory shear testing showed that PSC matrices had distinct viscoelastic responses compared to commercial collagen matrices through both their elastic and viscous phase components. At each collagen concentration, PSC showed the highest G' (p<0.05) followed by Sigma (p<0.05) and then BD-RT and PureCol. PureCol and BD-RTC were not significantly different at any concentration (p=0.97). Matrix G' (elastic modulus) significantly increased with increasing collagen concentration, but to dramatically different magnitudes depending on the collagen source (Fig. 5A, Table 2). Overall, PSC matrices covered a much broader G' range (25 to 1450 Pa) than achievable with other sources (1 to 350 Pa) at the concentrations tested. G' and collagen concentration ([C]) data were best fit with quadratic rather than linear equations. Equation coefficients varied largely between sources; for PSC G' = 2230[C]2 + 2020[C] −136, R2=0.993), for Sigma G' = 4.88[C]2 + 75.2[C] − 35.54 (R2=0.984), and for PureCol and BD-RTC combined G' = 8.22[C]2 + 1.57[C] − 0.772 (R2=0.981).
Fig. 5.

Shear storage modulus (G', A) and phase shift (δ, B) of matrices prepared with PSC or commercial collagen sources at varied concentrations (values reported at 1 % strain, 1 Hz frequency, n = 3). PSC had the largest G' and lowest δ at each concentration (p<0.05). G' increased with increasing collagen concentration, but with significantly different relationships for each source (p<0.05 at each concentration with the exception of PureCol and BD-RTC (p≥0.9 for all comparisons)). δ was significantly different for each source (p<0.05) and did not change with collagen concentration.
In comparison to G', matrix shear loss modulus (G”; viscous modulus) was small and in general followed the same statistical trends. Small G” translated to small δ and indicated, as expected, that matrix shear response was dominated by the collagen fibril network (solid/elastic phase). At each concentration tested, PSC matrices showed the lowest δ with values around 4°. Matrices prepared with Sigma, BD-RTC, and PureCol possessed progressively larger δ values that were significantly different (p<0.05) at each concentration with the exception of 0.5 mg/ml where BD-RTC and Sigma were similar (p=0.661), Fig. 5B). Interestingly, δ was independent of collagen concentration.
3.4.2. Unconfined compression
In contrast to shear, compressive loads are supported by the interstitial fluid phase and depend on hydraulic permeability. In general, unconfined compression stress-strain curves were biphasic in nature with distinguishable behavior noted within low strain and high strain regions (Fig. 6A). EC were measured in the linear, low-strain region of the curves (as indicated in Fig. 6A) to compare differences in matrix compressive resistance. At all concentrations, PSC EC were significantly higher (p<0.05) than those obtained for other sources (Fig. 6B, Table 2). In addition, PSC matrices covered the broadest range of Ec values, 5.3kPa to 42.8kPa. Significant differences between other sources did not emerge until ≥2 mg/ml concentrations (p<0.05). EC and collagen concentration were linearly related with slopes of 5.69, 1.20, and 10.5 kPa/(mg/ml) for PureCol, Sigma, and PSC, respectively. On the other hand, BD-RTC EC was not dependent upon concentration (p=0.056).
3.4.3. Uniaxial extension
Uniaxial extension testing of collagen matrices causes a dramatic reorganization and alignment of fibril architecture18,33. Therefore, this loading format allowed determination and comparison of PSC and other commercial collagen matrices to develop tension within the aligned microstructure. To measure ET and σU, stress was calculated as “engineering” or “true” to account for assumptions of constant cross-sectional area or actual cross-sectional area, respectively27,29. “Engineering” assumptions are widely used for traditional materials (low Poisson's ratio) and/or in situations where real-time cross-sectional area measurements are difficult. On the other hand, “true” stress calculations account for the significant cross-sectional area changes (high Poisson's ratio) observed with biological-based materials and tissues.
Despite the stress definition used, PSC matrices showed the highest ET and σU for each collagen concentration tested (Fig. 7A–D, Table 2). In fact, both “engineering” ET and σU were found to be dependent upon source at each concentration with the following statistically significant relationships PSC>>Sigma>BD-RTC=PureCol (p<0.05 except for BD-RTC and PureCol where p≥0.5). In general, “true” ET and σU values were significantly higher and showed greater variation than their “engineering” counterparts largely owing to the significant specimen compaction with loading and the associated error in cross-sectional area measurements. However, these parameters also were found to be dependent upon source with statistical trends similar to those specified for “engineering” values. Importantly, the dependence of ET and σU on collagen concentration varied largely between sources. More specifically, for PSC “engineering” ET increased with concentration (C) in logarithmic fashion (ET=117*ln(C)+107, R2 = 0.958) while “engineering” σU showed more linear dependence (Fig. 7A–B). “Engineering” ET and σU for PureCol and Sigma also showed moderate increases with concentration, but linear fits were poor (R2=0.5). On the other hand, “engineering” ET and σU for BD-RTC matrices actually decreased with increasing concentration, a contradiction to common theory18. Similar relationships between “true” ET and concentration were observed for each source (Fig. 7C–D); however, statistically significant differences were less largely owing to large variance in “true” ET values. In general, the greatest increase in “true” ET and σU as a function of concentration again was observed for PSC. In fact, “true” ET and σU values for PureCol and Sigma did not change significantly with concentration while those for BD-RTC decreased with increasing concentration. It should be noted that PSC matrices prepared at concentrations greater than 2 mg/ml maxed out the load cell and Sigma matrices prepared at concentrations less than 2 mg/ml failed outside the gauge section, therefore these groups were excluded from σU analyses.
Fig. 7.

Matrices produced with PSC or commercial collagens at various concentrations were subjected to uniaxial tensile testing and ET (A,B), σU (C,D), and εF (E) measured. ET and σU were calculated based upon “engineering” (A,C) “true” (B,D) assumptions. All measured parameters are summarized in Table 2 (n = 3–10, note σU and εF groups not shown when > 50% of samples failed outside of gauge section). PSC exhibited the largest ET and σU at each concentration (p<0.05), despite whether the “engineering” or “true” definition was used. In general, εF showed no dependence on collagen source or concentration.
Interestingly, matrix εF showed no consistent dependence on collagen source or concentration (Fig. 7E). PSC and BD-RTC εF were not significantly different at any concentration (p≥0.9) despite their dramatically different ET and σU. These results implied that matrices produced by the four sources differed in their ability to store energy, which was corroborated by visual observations of matrix failure (Fig. 8). At failure, stiffer PSC and Sigma matrices appeared to stretch like a band, then abruptly tear and snap with elastic recoil (Fig. 8A–C). In contrast, and BD-RTC and PureCol matrices appeared to plastically dissociate, developing fibrous connections that eventually fell apart (Fig. 8D–F).
Fig. 8.

Time-lapse brightfield images showing the failure of PSC (A–C) and BD-RTC (D–F) matrices (4 mg/ml) during uniaxial extension tests. PSC failure was observed as an abrupt, elastic tearing across the gauge section (also representative of Sigma failure). BD-RTC failure was observed as a slow dissociation throughout the gauge section (note fibrous strands of matrix pulled apart between separating ends, also representative of PureCol failure; scale bar = 5 mm).
3.5 PSC matrix physical properties are sufficient to guide lineage specific differentiation of MSC in vitro
To demonstrate biocompatibility of PSC matrices as well as the biological relevance of their broad range of physical properties, MSC were entrapped within PSC matrices in which fibril density and matrix stiffness (G') were varied by modulating the collagen concentration of the polymerization reaction. 3D tissue constructs were classified based upon their measured matrix G' values as either 45Pa (45±8Pa) or 695Pa (695±53Pa). Because of the high differentiation potential of MSC, the effects of modulating fibril density and matrix stiffness were immediately apparent on the in-vitro cell response. MSC cultured in regular medium and entrapped within 45Pa-matrices showed numerous adipocytes with no identifiable calcified nodules, while those within 695Pa-matrices showed calcified nodules with little to no identifiable adipocytes as observed qualitatively (Fig. 9). Expression levels of LPL and CBFA1, molecular indicators of adipogenesis and osteogenesis, respectively, corroborated these findings (Fig. 10). More specifically, MSC cultured in regular medium and 45Pa-matrices showed greatest LPL expression at both timepoints (Fig. 10A). In contrast, matrix dependent differences in CBFA1 expression were identifiable at 14 days only, with greatest levels observed for 695-Pa matrices (Fig. 10B). As expected, MSC cultured in regular medium on the surface of tissue culture plastic showed no evidence of lineage specific differentiation (Figs. 9C (upper panel), 10A, and 10B).
Fig. 9.

Tuning the physical properties of 3D PSC matrices effectively directed different patterns of lineage specific differentiation by embedded MSC. MSC (5×10⁴ cells/ml) were cultured for up to 14 days within collagen matrices whose physical properties corresponded to G' of 45Pa or 695Pa, as prepared by modulating the collagen content of polymerization reaction. Cultures were stained with oil red O (Upper Panel (A and D)) or alizarin red (Upper Panel (B and C)) for visualization of adipocytes (white arrows) or calcified nodules (black arrow), respectively. The number of adipocytes and calcified nodules within the 3D constructs also was quantified (Lower Panel). Asterix denotes statistically significant relationships (p<0.05). Scale bar = 50 μm.
Fig. 10.

Relative expression levels of LPL and CBFA1 as determined by RT-PCR for MSC cultured for 4 or 14 days on tissue culture plastic (circles) or within 3D PSC matrices. PSC matrices were prepared with physical properties corresponding to G' of 45Pa (squares) or 695Pa (triangles). MSC were cultured in the presence of regular medium (A and B) or adipogenic medium (C and D).Note differences in y-axis scales.
When 3D tissue constructs and cells on plastic were cultured in the presence of adipogenic medium, increases in adipogenic differentiation were noted in all cases but in a culture-format dependent fashion. As shown in Fig. 9 (lower panel), MSC cultured within 45Pa-matrices and adipogenic medium showed a 9-fold increase in adipocyte number compared to those cultured in regular medium. Interestingly, MSC cultured within 695Pa-constructs in the presence of adipogenic medium showed not only a 32-fold increase in the number of adipocytes but also an 8-fold increase in the number of calcified nodules (Fig. 9 (lower panel)). Interestingly, similar LPL expression profiles were observed for the two matrices when cultured in the presence of adipogenic medium, with greatest levels observed for 45-Pa cultures at 14 days (Fig. 10C). On the other hand, matrix dependent differences in CBFA1 expression persisted even in the presence of soluble adipogenic factors, with 695-Pa matrices showing the highest levels at both time points (Fig.10D). MSC cultured on plastic in the presence of adipogenic medium showed high levels of adipogenesis and no osteogenesis as evidenced by the numerous adipocytes (Fig. 9D (lower panel)) and expression of LPL (10). Collectively, these results indicate that 1) MSC are able to sense and respond to the broad range of physical properties provided by PSC matrices and 2) modulation of fibril density and matrix stiffness is sufficient to guide lineage specific differentiation of MSC. Furthermore, it is evident that soluble factor signaling is not sufficient to overcome collagen matrix-induced MSC differentiation, but rather soluble factors work synergistically with physical signals to drive stem cell phenotype and function.
3.6 PSC preparations show low intra- and inter- hide variability
Lots prepared from the hide obtained from the same (intra-hide) or different (inter-hide) market weight pigs have shown high reproducibility in terms of molecular composition, polymerization potential (e.g., kinetics and fibril microstructure-mechanical properties), and therefore biological response. The low intra- and inter-lot variability of PSC is best documented by comparing the functional polymerization properties as measured by matrix viscoelastic properties (e.g. G') as a function of the collagen content of the polymerization reaction (Fig. 11). For cell culture and other applications, collagen matrix formulations are routinely prepared and classified based upon matrix G' as predicted from the quantified relationship between G' and collagen content.
Fig. 11.

Intra- and inter- hide variation in polymerization potential of PSC preparations. Data are provided for 6 different PSC lots prepared from 3 different market-weight pig hides. Highly consistent relationships are observed between matrix mechanical properties (as measured by G') and collagen concentration used in the polymerization reaction. The first digit of the lot number designates the source pig, the second number represents the production lot number, and the last 6 digits indicate the production date.
4. Discussion
As the natural, fibrous polymeric substrate for cells in vivo, collagen will play an important role as the base component of physiologically-relevant, fibril-based microenvironments that predictably direct cell fate both in vitro and in vivo. Indeed, the architecture of the collagen fibrils as well as the fibril material properties serve as critical determinants of the physicochemical properties of the matrix including interstitial fluid flow5, tensile mechanical properties27, and hierarchical 3D strain transfer properties33,34. In this way, an applied deformation whether externally applied or cell-induced may deviate substantially across the different size-scales (construct or tissue level down to cellular level)35. We and others have shown cells embedded within 3D collagen matrices are able to sense and respond to modulation of these physical parameters, resulting in instructive changes to cell morphology, cytoskeletal organization, contractility, differentiation, and proliferation30,36,37. As such, next generation collagen formulations should facilitate multifactorial investigations of cell-collagen interactions in which both biochemical and physical features can be user-control and defined. Indeed, it has long been known that purified collagen polymerizes in vitro to form hierarchical fibrillar structures that exhibit strong similarities to those found in vivo38. In addition, it is well documented that the nature of the fibrils (e.g., diameter, length, and density) formed is highly sensitive to polymerization reaction conditions, including temperature, phosphate ion concentration, ionic strength, and structural features of collagen molecules (e.g., presence of telopeptides)39–42. Despite this extensive body of literature, collagen formulations produced commercially or within individual laboratories are not routinely standardized in terms of their functional polymerization properties. Furthermore, implantable biomaterials have not included the polymeric and fibril self-assembly properties of collagen as part of their design features and therapeutic strategy. Herein, we describe a type I collagen formulation that is acid-solubilized from pig skin and specifically developed for engineering collagen fibril-based matrices. Characterization and comparison of PSC was expanded beyond traditional purity and polypeptide analyses to include relevant performance properties focused on polymerization kinetics as well as the fibril microstructure and mechanical properties of formed matrices, a perspective not established previously.
Despite the fact that type I collagen is highly conserved amongst animal species43, results obtained both in vitro and in vivo using animal derived collagens depend critically on the animal source (e.g., species, age), tissue source (e.g., skin, tendon), and isolation procedure employed44. In fact, the production and deposition of collagen in vivo involves a complex series of intracellular and extracellular events. Immediately following synthesis, procollagen-α chains undergo post-translational modification including hydroxylation and glycosylation. Propeptide regions on both ends of the procollagen-α chains then guide the formation of a procollagen triple-helix molecule within the endoplasmic reticulum. The procollagen molecule is then secreted into the extracellular space, where cleavage of the propeptides ends produces a molecule with a central triple helical domain flanked by non-helical telopeptide domains. Removal of propeptide ends enables collagen molecules (monomers) to undergo spontaneous self-assembly in a staggered conformation to form hierarchical fibril structures. Cross-linking reactions, which are regulated primarily by the hydroxylation pattern and aldehyde formation within telopeptide and triple-helix domains45, contributes to formation of covalent bonds between α-chains within the same and different molecules. These intra- and inter-molecular cross-links are thought to contribute to the variations in structural and mechanical properties amongst different connective tissue types46. Based upon collagen's hierarchical design, intra-molecular cross-links are thought to contribute primarily to the stiffness of individual collagen molecules, while inter-molecular cross-links between laterally associated molecules contribute more significantly to the stored energy and strength of assembled collagen fibrils47. While the classes of cross-links may differ between connective tissue sources, published reports indicate that the allysine pathway predominates in skin and rat-tail tendon48; however, the extent is known to vary with age and specific disease states49.
Collagen isolation from tissues is routinely carried out under acidic conditions in the presence or absence of proteolytic enzymes such as pepsin. Acid solubilization was selected as the isolation method for PSC so to maintain the integrity of the telopeptide regions of the collagen molecule, which are known to be critical elements of polymerization and important sites for cross-linking16. Similarly, rat tail collagen and calf skin collagens from BD and Sigma, respectively, represent acid-solubilized preparations. However, according to manufacturer's specifications different isolation protocols and acids are used to generate these two collagen formulations. In contrast, PureCol is derived from calf skin using limited pepsin proteolysis. Pepsin cleaves telopeptide regions of the collagen molecules, rendering it more soluble and improving yield50. Despite the solubilization method used, cross-linked collagen molecules persist giving rise to a soluble mixture comprising monomers (single collagen molecules) and oligomers (two or more covalently cross-linked collagen molecules). Pepsin treatment is known to dramatically reduce the oligomer content largely owing to its cleavage of the telopeptide regions (primary sites for intramolecular and intermolecular cross-linking). Interestingly, the commercial collagen sources used herein specify that they are primarily monomeric in composition; however, no specific post-processing details to minimize or eliminate the oligomer component are provided.
In the case of PSC, no specific processing was employed to minimize the contribution of oligomers. Following SDS-PAGE, a procedure most commonly used to assess collagen source purity and polypeptide chain composition, expected similarities between PSC collagen and commercial sources were observed in terms of α, β, and γ banding, with β and γ resulting from inherent intramolecular cross-links. Little to no contaminating GAGs and non-collagenous proteins were identified within PSC. Furthermore, significant levels of type III or type V collagens, which are also present in skin, were not apparent based upon interrupted gel electrophoresis analyses. The most striking difference was that PSC contained a prominent protein band between 250 and 280 kDa. The band stained positively for the collagen type I epitope suggesting that PSC contained a unique composition of cross-linked α chains. These findings and the fact that PSC had the greatest intrinsic viscosity and therefore average molecular weight, suggested that PSC possessed a unique and likely greater oligomer content compared to commercial sources. Analyses of polymerization kinetics and microstructure-mechanical properties of formed matrices further support this notion.
In addition to routine compositional analysis, detailed studies focused on the polymerization kinetics as well as the fibril microstructure and mechanical properties of polymerized matrices were performed. Collectively, results from these analyses clearly showed that commercial collagen sources were dissimilar with respect to polymerization potential. While all sources were polymerized under identical reaction conditions, including collagen concentration, each source demonstrated a unique turbidity profile and kinetic parameters. These results imply that the molecular composition of these sources exhibit different underlying assembly mechanisms as they transition from a soluble to an insoluble fibrillar state. PSC showed rapid polymerization which is a critical design requirement that facilitates rapid and homogenous cell entrapment and clinically-useful injectable formulations28,29. The short polymerization half-time coupled with the low net change in turbidity (A405) further supported the notion that PSC maintained its telopeptides and possessed a significant oligomer content51–53. On the other hand, PureCol, a collagen formulation where telopeptides have been partially eliminated by limited pepsin digestion, exhibited long polymerization half-times (41–53 min). Such findings are consistent with previous reports12,52 documenting the importance of telopeptide regions in the initiation phase or nucleation steps of fibril formation. It should be noted that, if present, small amounts of mucosaccharides or other contaminates can affect the polymerization kinetics40 and may also have contributed to observed differences between the sources54,55. Interestingly, application of the acid-solubilization methodology used to produce PSC to other connective tissues (e.g., bone and tendon) does not yield collagens with the same polymerization properties (data not shown). This is not surprising since the number and type of cross-links differ amongst tissues thereby endowing them with specific fibril architectures and mechanical properties56. As such it is expected that collagen extraction from different tissue sources would yield different collagen polymer compositions (e.g., types and amounts of oligomers). More in-depth characterization of the collagen polymer compositions derived from pig skin and other tissue sources is currently underway.
While turbidity analysis provides insights into kinetics of the sol-gel transition, no specific information regarding molecular assembly and fibril microstructure can be derived from this data20. Therefore, confocal reflection microscopy was used to assess 3D fibril microstructure of polymerized matrices in their native, hydrated state. Fibril density, as measured, did not change with source (except maybe slightly in the case of PureCol) and was linearly related to collagen concentration (for 0.5–3 mg/ml range). This linear relationship has been observed before27, but not shown to correlate between varied sources. Here, we also found that the average diameter of individual fibrils did not vary significantly with source or concentration. Although PSC and BD-RTC showed evidence of enhanced fibril-fibril coalescence or bundling, these events were not quantified. The range of fibril diameters measured (270–500 nm) and their concentration independence are consistent with previous reports (290–800 nm)20,27,57. It should be noted that, CRM diameters may over-estimate diameters due to diffraction artifacts at fibril edges and have resolution limitations comparable to fibril sizes (lateral 150–300 nm, axial 500 nm58). The limited resolution of CRM also does not account for relevant structural differences that may exist on smaller size scales (e.g., microfibrils). Our results suggest that additional differences in the hierarchical fibril morphology and organization may be detectable using more sensitive and alternative imaging techniques (e.g. SEM, AFM); however, many of these require extensive specimen processing which can induce artifacts25.
Functional assessment of the fibril networks was obtained through comprehensive mechanical analysis of polymerized matrices, which is not traditionally included as part of collagen characterization or comparison studies. Subjecting polymerized matrices to different loading formats, oscillatory shear, unconfined compression, and uniaxial extension, allowed differential assessment of solid (fibril) and fluid phases and their associated interactions18. From these results differences in the polymerization potential of PSC and the other collagen sources were most evident. Overall, PSC showed the greatest mechanical integrity, which overcomes a major limitation to the handling and application of commercial collagens to date5,59. PSC matrices prepared over the range of concentrations tested (0.5–4 mg/ml) covered the broadest range with stiffness values ranging from 27–1440 Pa in shear (G') and 33–277 kPa in extension (“engineering” ET). These values were significantly greater than those for other sources as measured here (2–343 Pa G', 1–57 kPa “engineering” ET) or reported elsewhere for similar collagen concentrations (0.1–150 Pa G', 1–60 kPa ET,5,18,37,60,61. These published ranges include values obtained previously for PureCol26,54,62, Sigma27, and BD-RTC63–65. It is interesting to note that both G' and ET, are primarily governed by the solid fibril phase of the matrix. In contrast, δ, which is used as a measure of the fluidity of a material was lowest for PSC matrices. Unconfined compression testing, as measured here, provided insight into the hydraulic permeability of the matrix. For purposes of comparison, Ec was calculated within the low strain region of the biphasic stress-strain curve. For all sources Ec increased with collagen concentration, these relationships were described by different linear relationships. The fact that Ec increased with increased collagen concentration is not surprising, considering the concomitant increase in fibril density. However, PSC yielded the broadest range of Ec values, a linear relationship between Ec and concentration with the greatest slope, and fibril densities similar to the other collagen sources. These data imply that the stiffness of the fibrils themselves and/or inter-fibril connectivity are responsible for these significant differences.
Collectively, the source dependent differences in ET, as well as G', EC, σU, and εF, share a common theme that PSC matrices, compared to matrices produced with commercial sources, show an enhanced ability to store elastic energy. This was obvious from the mode of failure observed during uniaxial extension. At failure, PSC matrices snapped and recoiled while BD-RTC/PureCol matrices merely dissociated/fell apart with no recoil. Although fibril diameter and length have been related to changes in tensile mechanical properties27,66, fibril rearrangements (e.g. sliding, realigning) are thought to be primarily responsible for shear and tensile responses18. Fibril branching (interfibril cross-links) and strong fibril-fibril interactions, which resist fibril slipping, are responsible for large elastic energy storage in tendons and collagen fibers54,67–69. In fact, the abrupt failure in extension relates to elastic energy storage in intermolecular cross-links not achievable in entanglements18,70. Here altered packing and alignment of collagen molecules that occurs in the presence of covalently cross-linked molecules (oligomers) during self-assembly may result in an overall stiffening of an individual collagen fibril or more likely distinct hierarchical fibril architectures (e.g., increased fibril-fibril branching or fibril-fibril bundling). This hypothesis is also supported by the fact that commercial collagens had a much lower Poisson's ratio than PSC (responsible for the difference between “engineering” and “true” stress and stiffness values), indicating that fibril-fibril interactions acted more like hinge points in PSC (leading to increased off-axis strain) rather than entanglements. While both fibril stiffening and connectivity would strengthen the matrix; our collective experience with different collagen sources and engineered collagen matrices strongly support the latter and will be the subject of future investigations.
We and others have found that commercial collagens are insufficient for precision-tuning “instructional” cell microenvironments because of the significant lot-to-lot variability in polymerization capacity as well as their ability to produce only a limited range of physical properties72. Here, proof-of-concept experiments in which MSC were embedded within PSC matrices prepared with varied physical properties documented that PSC not only was biocompatible but also provided a range of physical properties to which cells could sense and respond in a predictable and reproducible manner. In fact, it was apparent that modulation PSC matrix physical properties was sufficient to direct lineage specific differentiation of MSC down adipogenic and osteogenic pathways. While specific soluble factor cocktails were not sufficient to overcome matrix-induced MSC differentiation, it was apparent both soluble factor and physical based signaling worked synergistically to guide lineage specific differentiation of MSC. Such observations are consistent with work Engler and co-workers who showed that modulation of the elasticity (stiffness) of collagen-coated polyacrylamide gels was sufficient to direct differentiation of MSC down cultured on their surface71. It is important to note that the in-vitro response of MSC as well as other cell types to PSC matrices shows low intra- and inter-hide variability when lots are quality controlled on polymerization potential and matrix physical properties (e.g., G').
In conclusion, this work demonstrates that PSC has many critical design features that make it amenable as a collagen polymer platform for customizing and engineering 3D culture models as well as injectable or implantable cellular microenvironments that are precision-tuned in terms of molecular composition and relevant physical properties so to yield desirable and predictable cell fates. It is clear that polymerization properties amongst collagen sources are vastly different thereby yielding 3D matrices that are dramatically different in physical features, namely their fibril microstructure-mechanical properties relationships. This is an important problem because it is now increasingly recognized that physical features of matrices, specifically fibril density and stiffness, can serve as potent signals that direct the morphology, mechanics, and fate of embedded cells. Therefore, it is not surprising that conventional collagen formulations, which are often poorly characterized, show significant lot-to-lot and product-to-product variability thereby precluding meaningful comparisons of results between studies and laboratories. Furthermore, this study establishes that collagen concentration is a misleading descriptor for predicting and comparing performance of collagen preparations for these applications. We found that quality controlling PSC based upon polymerization potential, as determined by G' and fibril density, has provided a very effective means for obtaining robust collagen polymer formulation with low intra-hide and inter-hide variability in terms of physical properties, therefore contributing to high predictability and reproducibility in terms of cell response. Furthermore, this work suggests that the oligomeric content may be a critical design feature that effectively broadens the range of fibril microstructures and mechanical properties that are achievable with polymerization. Experiments to demonstrate a direct mechanistic linkage between oligomers and functional collagen properties are currently underway.
At present, cell biology is transitioning from conventional 2D to emerging 3D in-vitro cell and tissue culture formats which will drive significant advances in basic and translational research related to cell biology (e.g., stem cell and tumor biology), tissue engineering, and drug development. It is evident that new perspectives into collagen chemistry and collagen polymer engineering will allow this natural polymer to reach its potential as an effective 3D matrix that will advance basic research and next generation tissue engineering and regenerative medicine strategies.
Acknowledgements
This work was funded in part by the National Institute for Biomedical Imaging and Bioengineering (1R01EB000165).
References
- 1.Abraham LC, Zuena E, Perez-Ramirez B, Kaplan DL. J Biomed Mater Res B Appl Biomater. 2008;87B:264–285. doi: 10.1002/jbm.b.31078. [DOI] [PubMed] [Google Scholar]
- 2.Friess W. Eur J Pharm Biopharm. 1998;45:113–136. doi: 10.1016/s0939-6411(98)00017-4. [DOI] [PubMed] [Google Scholar]
- 3.Griffith LG, Swartz MA. Nat Rev Mol Cell Biol. 2006;7:211–224. doi: 10.1038/nrm1858. [DOI] [PubMed] [Google Scholar]
- 4.Rhee S, Grinnell F. Adv Drug Delivery Reviews. 2007;59:1299–1305. doi: 10.1016/j.addr.2007.08.006. [DOI] [PMC free article] [PubMed] [Google Scholar]
- 5.Pedersen JA, Swartz MA. Ann Biomed Eng. 2005;33:1469–1490. doi: 10.1007/s10439-005-8159-4. [DOI] [PubMed] [Google Scholar]
- 6.Chevallay B, Herbage D. Med Biol Eng Comput. 2000;38:211–218. doi: 10.1007/BF02344779. [DOI] [PubMed] [Google Scholar]
- 7.Kadler K. Birth Defects Res C Embryo Today. 2004;72:1–11. doi: 10.1002/bdrc.20002. [DOI] [PubMed] [Google Scholar]
- 8.Kadler KE, Baldock C, Bella J, Boot-Handford RP. J Cell Sci. 2007;120:1955–1958. doi: 10.1242/jcs.03453. [DOI] [PubMed] [Google Scholar]
- 9.Sims JR, Karp S, Ingber DE. J Cell Sci. 1992;103:1215–1222. doi: 10.1242/jcs.103.4.1215. [DOI] [PubMed] [Google Scholar]
- 10.Wang N, Ingber DE. Biophys J. 1994;66:2181–2189. doi: 10.1016/S0006-3495(94)81014-8. [DOI] [PMC free article] [PubMed] [Google Scholar]
- 11.Ingber DE, Prusty D, Sun Z, Betensky H, Wang N. J Biomech. 1995;28:1471–1484. doi: 10.1016/0021-9290(95)00095-x. [DOI] [PubMed] [Google Scholar]
- 12.Gelman RA, Poppke DC, Piez KA. J Biol Chem. 1979;254:11741–11745. [PubMed] [Google Scholar]
- 13.McPherson J, Wallace D, Sawamura S, Conti A, Condell R, Wade S, Piez K. Collagen Related Research. 1985;5:119–135. doi: 10.1016/s0174-173x(85)80034-0. [DOI] [PubMed] [Google Scholar]
- 14.Comper WD, Veis A. Biopolymers. 1977;16:2133–2142. doi: 10.1002/bip.1977.360161005. [DOI] [PubMed] [Google Scholar]
- 15.Gross J, Highberger JH, Schmitt FO. Proc Natl Acad Sci U S A. 1955;41:1–7. doi: 10.1073/pnas.41.1.1. [DOI] [PMC free article] [PubMed] [Google Scholar]
- 16.Kuznetsova N, Leikin S. J Biol Chem. 1999;274:36083–36088. doi: 10.1074/jbc.274.51.36083. [DOI] [PubMed] [Google Scholar]
- 17.Kadler KE, Holmes DF, Trotter JA, Chapman JA. Biochem J. 1996;316(Pt 1):1–11. doi: 10.1042/bj3160001. [DOI] [PMC free article] [PubMed] [Google Scholar]
- 18.Sander EA, Barocas VH. In: Collagen: Structure and Mechanics. Fratzl P, editor. Springer; New York: 2008. pp. 475–504. [Google Scholar]
- 19.Gallop PM, Seifter S. Methods Enzymol. 1963:635–641. [Google Scholar]
- 20.Brightman AO, Rajwa BP, Sturgis JE, McCallister ME, Robinson JP, Voytik-Harbin SL. Biopolymers. 2000;54:222–234. doi: 10.1002/1097-0282(200009)54:3<222::AID-BIP80>3.0.CO;2-K. [DOI] [PubMed] [Google Scholar]
- 21.Marotta M, Martino G. Anal Biochem. 1985;150:86–90. doi: 10.1016/0003-2697(85)90443-9. [DOI] [PubMed] [Google Scholar]
- 22.Sykes B, Puddle B, Francis M, Smith R. Biochem Biophys Res Commun. 1976;72:1472–1480. doi: 10.1016/s0006-291x(76)80180-5. [DOI] [PubMed] [Google Scholar]
- 23.Bjornsson S. Anal Biochem. 1993;210:282–291. doi: 10.1006/abio.1993.1197. [DOI] [PubMed] [Google Scholar]
- 24.Ananthanarayanan S, Veis A. Biopolymers. 1972;11:1365–1377. doi: 10.1002/bip.1972.360110706. [DOI] [PubMed] [Google Scholar]
- 25.Voytik-Harbin SL, Rajwa B, Robinson JP. Methods Cell Biol. 2001;63:583–597. doi: 10.1016/s0091-679x(01)63031-0. [DOI] [PubMed] [Google Scholar]
- 26.Knapp DM, Barocas VH, Moon AG, Yoo K, Petzold LR, Tranquillo RT. J Rheol. 1997;41:971–993. [Google Scholar]
- 27.Roeder BA, Kokini K, Sturgis JE, Robinson JP, Voytik-Harbin SL. J Biomech Eng. 2002;124:214–222. doi: 10.1115/1.1449904. [DOI] [PubMed] [Google Scholar]
- 28.Kolodney M, Elson E. J Biol Chem. 1993;268:23850–23855. [PubMed] [Google Scholar]
- 29.Voytik-Harbin SL, Roeder BA, Sturgis JE, Kokini K, Robinson JP. Microscopy Microanalysis. 2003;9:74–85. doi: 10.1017/S1431927603030046. [DOI] [PubMed] [Google Scholar]
- 30.Pizzo AM, Kokini K, Vaughn LC, Waisner BZ, Voytik-Harbin SL. J Appl Physiol. 2005;98:1909–1921. doi: 10.1152/japplphysiol.01137.2004. [DOI] [PubMed] [Google Scholar]
- 31.Zuk PA, Zhu M, Ashjian P, De Ugarte DA, Huang JI, Mizuno H, Alfonso ZC, Fraser JK, Benhaim P, Hedrick MH. Mol Biol Cell. 2002;13:4279–4295. doi: 10.1091/mbc.E02-02-0105. [DOI] [PMC free article] [PubMed] [Google Scholar]
- 32.Chomczynski P, Sacchi N. Anal Biochem. 1987;162:156–159. doi: 10.1006/abio.1987.9999. [DOI] [PubMed] [Google Scholar]
- 33.Roeder BA, Kokini K, Robinson JP, Voytik-Harbin SL. J Biomech Eng. 2004;126:699–708. doi: 10.1115/1.1824127. [DOI] [PubMed] [Google Scholar]
- 34.Roeder BA, Kokini K, Voytik-Harbin SL. J Biomech Eng. 2009;131:031004–031011. doi: 10.1115/1.3005331. [DOI] [PubMed] [Google Scholar]
- 35.Brown TD. J Biomech. 2000;33:3–14. doi: 10.1016/s0021-9290(99)00177-3. [DOI] [PubMed] [Google Scholar]
- 36.Byfield FJ, Reen RK, Shentu TP, Levitan I, Gooch KJ. J Biomech. 2009;42:1114–1119. doi: 10.1016/j.jbiomech.2009.02.012. [DOI] [PMC free article] [PubMed] [Google Scholar]
- 37.Karamichos D, Lakshman N, Petroll WM. Invest Ophthalmol Vis Sci. 2007;48:5030–5037. doi: 10.1167/iovs.07-0443. [DOI] [PMC free article] [PubMed] [Google Scholar]
- 38.Veis A, George A. In: Extracellular Matrix Assembly and Function. Yurchenco PD, Birk DE, Mecham RP, editors. Academic Press; San Diego: 1994. pp. 15–45. [Google Scholar]
- 39.Williams BR, Gelman RA, Poppke DC, Piez KA. J Biol Chem. 1978;253:6578–6585. [PubMed] [Google Scholar]
- 40.Wood GC. Biochem J. 1960;75:605–612. doi: 10.1042/bj0750605. [DOI] [PMC free article] [PubMed] [Google Scholar]
- 41.Wood GC, Keech MK. Biochem J. 1960;75:588–598. doi: 10.1042/bj0750588. [DOI] [PMC free article] [PubMed] [Google Scholar]
- 42.Cassel JM, Mandelkern L, Roberts DE. Journal of the American Leather Chemists Association. 1962;57:556–575. [Google Scholar]
- 43.Boot-Handford RP, Tuckwell DS. Bioessays. 2003;25:142–151. doi: 10.1002/bies.10230. [DOI] [PubMed] [Google Scholar]
- 44.Chandrakasan G, Torchia DA, Piez KA. J Biol Chem. 1976;251:6062–6067. [PubMed] [Google Scholar]
- 45.Eyre DR, Wu JJ. Collagen. 2005;247:207–229. [Google Scholar]
- 46.Eyre DR, Paz MA, Gallop PM. Annu Rev Biochem. 1984;53:717–748. doi: 10.1146/annurev.bi.53.070184.003441. [DOI] [PubMed] [Google Scholar]
- 47.Silver FH, a. L. WJ. In: Collagen Structure and Mechanics. Fratzl P, editor. Springer; New York: 2008. pp. 133–154. [Google Scholar]
- 48.Robins SP, Bailey AJ. Biochem J. 1975;149:381–385. doi: 10.1042/bj1490381. [DOI] [PMC free article] [PubMed] [Google Scholar]
- 49.Eyre DR, Weis MA, Wu JJ. Methods. 2008;45:65–74. doi: 10.1016/j.ymeth.2008.01.002. [DOI] [PMC free article] [PubMed] [Google Scholar]
- 50.Trelstad RL. Native Collagen Fractionation. CRC Press; Boca Raton: 1982. [Google Scholar]
- 51.Gelman RA, Williams BR, Piez KA. J Biol Chem. 1979;254:180–186. [PubMed] [Google Scholar]
- 52.Condell RA, Hanko VP, Larenas EA, Wallace G, McCullough KA. Anal Biochem. 1993;212:436–445. doi: 10.1006/abio.1993.1352. [DOI] [PubMed] [Google Scholar]
- 53.Na GC, Butz LJ, Carroll RJ. J Biol Chem. 1986;261:12290–12299. [PubMed] [Google Scholar]
- 54.Raeber GP, Lutolf MP, Hubbell JA. Biophys J. 2005;89:1374–1388. doi: 10.1529/biophysj.104.050682. [DOI] [PMC free article] [PubMed] [Google Scholar]
- 55.Rosner BI, Hang T, Tranquillo RT. Exp Neurol. 2005;195:81–91. doi: 10.1016/j.expneurol.2005.04.003. [DOI] [PubMed] [Google Scholar]
- 56.Eyre DR, Wu JJ. Top Curr Chem. 2005;247:207–229. [Google Scholar]
- 57.Friedl P, Maaser K, Klein CE, Niggemann B, Krohne G, Zanker KS. Cancer Res. 1997;57:2061–2070. [PubMed] [Google Scholar]
- 58.Friedl P. Histochem Cell Biol. 2004;122:183–190. doi: 10.1007/s00418-004-0682-0. [DOI] [PubMed] [Google Scholar]
- 59.Hadjipanayi E, Mudera V, Brown RA. Cell Motil Cytoskeleton. 2009;66:121–128. doi: 10.1002/cm.20331. [DOI] [PubMed] [Google Scholar]
- 60.Paszek MJ, Zahir N, Johnson KR, Lakins JN, Rozenberg GI, Gefen A, Reinhart-King CA, Margulies SS, Dembo M, Boettiger D, Hammer DA, Weaver VM. Cancer Cell. 2005;8:241–254. doi: 10.1016/j.ccr.2005.08.010. [DOI] [PubMed] [Google Scholar]
- 61.Kuntz RM, Saltzman WM. Biophys J. 1997;72:1472–1480. doi: 10.1016/S0006-3495(97)78793-9. [DOI] [PMC free article] [PubMed] [Google Scholar]
- 62.Barocas VH, Moon AG, Tranquillo RT. J Biomech Eng. 1995;117:161–170. doi: 10.1115/1.2795998. [DOI] [PubMed] [Google Scholar]
- 63.Sieminski AL, Hebbel RP, Gooch KJ. Exp Cell Res. 2004;297:574–584. doi: 10.1016/j.yexcr.2004.03.035. [DOI] [PubMed] [Google Scholar]
- 64.Stuart K, Panitch A. Biopolymers. 2008;89:841–851. doi: 10.1002/bip.21024. [DOI] [PubMed] [Google Scholar]
- 65.Krishnan L, Weiss JA, Wessman MD, Hoying JB. Tissue Eng. 2004;10:241–252. doi: 10.1089/107632704322791880. [DOI] [PubMed] [Google Scholar]
- 66.Christiansen DL, Huang EK, Silver FH. Matrix Biol. 2000;19:409–420. doi: 10.1016/s0945-053x(00)00089-5. [DOI] [PubMed] [Google Scholar]
- 67.Silver FH, Christiansen DL, Snowhill PB, Chen Y. Connect Tissue Res. 2000;41:155–164. doi: 10.3109/03008200009067667. [DOI] [PubMed] [Google Scholar]
- 68.Silver FH, Freeman JW, Seehra GP. J Biomech. 2003;36:1529–1553. doi: 10.1016/s0021-9290(03)00135-0. [DOI] [PubMed] [Google Scholar]
- 69.Seehra GP, Silver FH. Skin Res Technol. 2006;12:190–198. doi: 10.1111/j.0909-752X.2006.00150.x. [DOI] [PubMed] [Google Scholar]
- 70.Chandran PL, Barocas VH. J Biomech Eng. 2004;126:152–166. doi: 10.1115/1.1688774. [DOI] [PubMed] [Google Scholar]
- 71.Engler AJ, Sen S, Sweeney HL, Discher DE. Cell. 2006;126:677–689. doi: 10.1016/j.cell.2006.06.044. [DOI] [PubMed] [Google Scholar]
- 72.Johnson KR, Leight JL, Weaver VM. Methods Cell Biol. 2007;83:547–583. doi: 10.1016/S0091-679X(07)83023-8. [DOI] [PMC free article] [PubMed] [Google Scholar]