

Abstract
The suprachiasmatic nucleus (SCN) of the hypothalamus regulates daily rhythms in physiology and behavior. It is constituted of a heterogeneous population of cells which together form the circuits underlying its master clock function. Numerous studies suggest the existence of two regions that have been termed core and shell. At a gross level, differences between these regions map to distinct functional differences, though the specific role(s) of various peptidergic cellular phenotypes remains unknown. In mouse, gastrin releasing peptide (GRP) cells lie in the core, are directly retinorecipient and lack detectable rhythmicity in clock gene expression, raising interest in their role in the SCN. Here, we provide evidence that calbindin expressing cells of perinatal mouse SCN express GRP, identified by a green fluorescent protein (GFP+), but lack detectable calbindin later in development. To explore the intra-SCN network in which GRP neurons participate, individual GFP+ cells were filled with tracer and their morphological characteristics, processes, and connections, as well as those of their non-GFP containing immediate neighbors, were compared. The results show that GFP+ neurons form a dense network of local circuits within the core, revealed by appositions on other GFP+ cells and by the presence of dye-coupled cells. Dendrites and axons of GFP+ cells make appositions on arginine vasopressin neurons, while non-GFP cells have a less extensive fiber network, largely confined to the region of GFP+ cells. The results point to specialized circuitry within the SCN, presumably supporting synchronization of neural activity and reciprocal communication between core and shell regions.
Keywords: circadian rhythms, suprachiasmatic, gastrin releasing peptide, intra-SCN circuit
INTRODUCTION
The suprachiasmatic nucleus (SCN) of the hypothalamus is the locus of a biological clock that regulates daily rhythms in physiology and behavior. While individual cells of the nucleus produce circadian rhythms of electrical activity and clock gene expression (Reppert and Weaver, 2002), coherent rhythmicity of the circadian pacemaker’s function as a master clock emerges from the network of SCN connections (Liu et al., 1997; Yan et al., 2007). In proof, application of the Na+ channel blocker tetrodotoxin, desynchronizes cellular rhythms in Per1 expression, monitored by bioluminescence (Yamaguchi et al., 2003).
The SCN has long been divided into two distinct compartments based on cytoarchitecture (van den Pol, 1980). The terms core and shell were initially introduced by Miller, Morin, Schwartz and Moore (Miller et al., 1996) to characterize the hamster SCN and were subsequently extended to describe universal features of the SCN in other species where the precise localization of these compartments differ (Morin and Allen, 2006).
A puzzling aspect of intra-SCN communication has been the nature of core-shell communication. Tract tracing studies suggest one-way communication within SCN compartments with dense core-to-shell projections but only sparse shell-to-core connections (Daikoku et al., 1992; Leak et al., 1999). Ablation of the core in Syrian hamster results in loss of circadian rhythms in wheel running, drinking, gnawing and in hormonal rhythms of melatonin and corticosterone (Kriegsfeld et al., 2004b; LeSauter and Silver, 1999) indicating that this region is important for rhythmicity. Furthermore, the core receives a greater density of retinal input than does the shell (Morin and Allen, 2006). Finally, core cells are among the first to respond to a light pulse with increased expression of FOS, Per1 and Per2 (Hamada et al., 2001; Silver et al., 1996; Yan and Silver, 2002).
Understanding how core cells contribute to brain clock function requires knowledge of SCN circuitry. Gastrin-releasing peptide (GRP) cells are of interest as GRP acutely enhances and synchronizes molecular rhythms in otherwise arrhythmic SCN neurons of mice lacking the vasoactive intestinal peptide (VIP) receptor VPAC2 (Brown et al., 2005; Maywood et al., 2006). GRP receptors are concentrated in the dorsal SCN (Aida et al., 2002; Karatsoreos et al., 2006) and administration of GRP produces phase shifts (Antle et al., 2005). Such evidence suggests that GRP cells constitute a key component of SCN circuits.
In this study, we examined the morphology and projections of an identified SCN phenotype by filling cells with tracers and analyzing their somal morphology, dendritic arborization, axonal projections and appositions. A secondary goal was to understand the relationship, if any, between the hamster calbindin (CalB) cells and these putative GRP (pGRP) cells in mouse. CalB cells are sparse and widely distributed in the adult mouse SCN, but in the perinatal mouse, CalB cells are densely clustered in the core, as in adult hamster. In the transgenic CalB::GFP mouse, green fluorescent protein (GFP)-containing cells are localized within the SCN similarly to hamster CalB cells, setting the stage for asking whether the GRP in the adult mouse and CalB in the young mouse are being expressed in the same cells.
MATERIALS AND METHODS
Experimental animals and housing
The calbindin-D28K–bacterial artificial chromosome (BAC)::GFP transgenic mouse (termed here CalB::GFP, a gift from Dr. N. Heintz, Rockefeller University, New York, NY) used in this study was made by insertion of enhanced GFP (EGFP) (Yang et al., 1997) in the calbindin BAC (Research Genetics/Invitrogen, Carlsbad, CA) by homologous recombination. The homologous region was upstream of the start codon of the calbindin gene. The first stretch of the sequence included the calbindin-D28K promoter followed by the first linker sequence and then the EGFP construct followed by the second linker, with the tail sequence containing more of the calbindin gene, including the start codon (at position 1879). Animals were housed in translucent propylene cages under a 12:12 light:dark cycle. Food and water were available ad libitum. Mice aged postnatal day (PN) 7 were anesthetized (200 mg/kg pentobarbital) and perfused intracardially with 20 ml saline followed by 20 ml 4% paraformaldehyde in 0.1M phosphate buffer containing 15% picric acid. Brain were postfixed overnight, then cryoprotected in 20% sucrose in 0.1M PBS. Coronal sections (50 μm) were cut on a cryostat, washed in PBS, and processed for immunocytochemistry. Adult mice were deeply anesthetized with sodium pentobarbital (100 mg/kg, i.p.) and perfused intracardially with 100 ml of 0.9% saline followed by 200 ml of 4% paraformaldehyde in 0.1M PBS (pH 7.3). Brains were post-fixed 2 hours at room temperature before being sliced. All procedures were approved by the Columbia University Animal Care and Use Committee.
Identification of GFP cells
GFP is detected in most GRP cells (>90% of GRP cells) and GRP is detected in >90% of GFP containing cells (Karatsoreos et al., 2004). Because this number is very high, but not identical the GFP containing cells described here are termed putative GRP (pGRP) cells. The advantage of using this transgenic mouse is that it permits visualization of pGRP containing cell bodies which are otherwise completely obscured by a dense fiber plexus (Karatsoreos et al., 2004). In the CalB::GFP mouse, GFP is expressed in cells containing CalB (CalB+) in the cerebellum, but in the adult mouse SCN the dense cluster of GFP cells lacks detectable CalB. In contrast, in the pup, CalB cells are dense in the core SCN (Ikeda and Allen, 2003; Kriegsfeld et al., 2008).
Biocytin and biotin filling of neurons
Two methods either fixed tissue or acute slices, were used for filling cells in the region of GFP+ cells. In the first, mice at 30–60 days of age were used and neurons were filled at zeitgeber time (ZT) 20–22 with lucifer yellow cadaverin-biotin-X (biotin; molecular weight: 873.1; Molecular Probes, Carlsbad, CA). The lucifer yellow allows for visualization while filling the cell, biotin served as the tracer labeled by Cy2-streptavidin. In the second method, biocytin (ε-biotinoyl-L-lysine, molecular weight: 372.48; Molecular probes) was injected into cells in acute brain slices of 14–21 day old pups sacrificed at ZT 15:00 or ZT 16:30. Cells were filled at ZT 16–21.
Fixed tissue
In the fixed tissue preparation, hypothalamic coronal slices (250μm) containing the SCN were cut on a vibratome and collected in 1M PBS. Sections were incubated in 4′,6-diamidino-2-phenylindole (DAPI: Sigma-Aldrich; 1μg/ml) for two minutes before the cell filling procedure. Sharp electrodes were pulled from thin wall borosilicate filament glass (G150F-4, 1.5-mm outer diameter, Warner Instruments Inc, Hamden, CT) using a heater (pp-830, Narishige, JAPAN). The electrode was filled with lucifer yellow biotin-X (Molecular probes) mixed at 1% in distilled water. The brain slice was submerged in 0.1M PB and anchored. The electrode, angled about 30 degrees from horizontal, was advanced into the tissue using a micro-manipulator (model 200, Newport, Irvine, CA). GFP and DAPI stained cells were observed under a fluorescence microscope (Olympus BX50WI, Chicago, IL). The pipette was first positioned over the SCN and then advanced in the tissue toward a GFP cells. Membrane penetration was observed under UV filter as the DAPI-stained nucleus moves upon successful cell perforation. The flow of lucifer yellow was monitored and if no leakage appeared, a 10picoA negative current was applied (Microiontophoresis dual current generator 260, World Precision Instruments, Sarasota, FL) for 20 minutes. In cases where the dye diffused throughout the tissue, the slice was discarded (Pace et al., 2002).
Acute slice preparation
Pups were sacrificed by cervical dislocation. Brains were rapidly excised from the skull and placed in ice-cold, artificial cerebrospinal fluid cutting solution of the following composition (in mM): 110 choline Cl, 25 NaHCO3, 25 dextrose, 11.6 Na ascorbate, 3.1 Na pyruvate, 2.5 KCl, 1.25 NaH2PO4, 0.5 CaCl2, 7 MgSO4 (pH 7.3). The solution was saturated with 95% CO2–5% O2. A block of hypothalamic tissue placed into the cutting solution was cut with a vibratome into 250μm coronal slices containing the SCN. The slices were incubated at 30–32°C for 1 hour in oxygenated artificial cerebrospinal fluid consisting of (in mM): 126 NaCl, 3 KCl, 26 NaHCO3, 1 NaH2PO4, 10 dextrose, 2.4 CaCl2 and 1.3 MgSO4 saturated with 95% CO2–5% O2. Slices were transferred to the recording chamber and continuously perfused at a rate of 2 ml/min at 30–32°C. GFP containing neurons were visualized using fluorescent excitation with a narrow band GFP filter (480 nm, Chroma Technology Corp., Rockingham, VT). Patching was done with pipettes pulled from thin-wall borosilicate glass capillary tubing (1.5-mm outer diameter, GC150TF, Harvard Apparatus Ltd., Edenbridge, UK) on a vertical pipette puller. The tip resistance of the electrodes was 6–10 mOhms. The patch pipette solution contained (in mM): 135 potassium gluconate, 5 KCl, 5 NaCl, 10 Hepes, 2.5 MgATP, 0.3 GTP, 1% biocytin. Following membrane rupture the pipette was kept in place for about 20 minutes allowing biocytin diffusion into the neuron. During that time, recordings were made in current clamp mode. Slices were then placed in ice-cold 4% paraformaldehyde overnight at 4°C, and then transferred to phosphate buffered saline (PBS, pH 7.3). All slices were kept at 4°C until processed for immunocytochemistry.
Antibody Characterization
See Table 1 for a list of the antibodies used. The anti-GFP rabbit polyclonal IgG was purified by ion exchange chromatography from an antiserum generated against green fluorescent protein isolated from the jellyfish Aequorea victoria and affinity column purified. Its specificity has been confirmed in rat neurons transfected with GFP− expressing vectors (Billig et al., 2000). The GFP antibody recognizes native GFP, recombinant GFP and GFP fusion proteins by western blot analysis and by immunoprecipitation. On Western blot using the native protein, the antibody detects a 27kDa band corresponding to GFP (Molecular Probes Labeling and Detection Technologies). No staining is detected in wild type mice (results from our lab).
Table 1.
Antibody characteristics
| Antigen | Immunogen | Manufacturing | Dilution |
|---|---|---|---|
| Green Fluorescent Protein (GFP) | Purified GFP from Aequorea victoria | Molecular probes (Carlsbad, CA), rabbit polyclonal, #A6455 | 1:10 000 |
| Arginin Vasopressin (AVP) | H-Cys-Tyr-Phe_gln_Asn_Cys-Pro-Arg-GLy-NH2 (disulfide bond) | Peninsula Laboratories (San Carlos, CA), Guinea pig polyclonal, #T-5048 | 1:5,000 |
| Calbindin (CalB) | purified bovine kidney calbindin-D-28K | Sigma (St Louis, MO) Mouse monoclonal, #C-9848 | 1:5,000 |
The polyclonal AVP antibody is collected from guinea pigs immunized with a synthetic peptide as the immunogen. Radioimmunoassay shows that the cross reaction with (Arg8)-vasopressin is 100%; (d(CH2)51,D-Ile2,Ile4,Arg8)-Vasopressin 0.06%; (Lys8)-Vasopressin, 0.04%; (Desamino-Cys1, D-Arg8)-Vasopressin, 0.02%; PACAP-38 (human, mouse, ovine, porcine, rat), Met-Enkephalin and Oxytocin, 0% (Peninsula Labs Technical Service). Staining was eliminated by preincubation of the diluted antiserum (1:5000) with 2 micrograms/ml of the protein. No staining was detected in Brattleboro rats (results from our lab).
The monoclonal anti-calbindin-D-28K antibody (mouse IgG1 isotype) is derived from the CB-955 hybridoma produced by the fusion of mouse myeloma cells and splenocytes from BALB/c mice immunized with a purified bovine kidney calbindin-D-28K. The isotype is determined by a double diffusion immunoassay using Mouse Monoclonal Antibody Isotyping Reagents. The antibody recognizes a 28 kDa molecular weight on immunoblots using a whole cell extract of cultured Madin-Darby Bovine Kidney cells. The antibody does not react with other members of the EF-hand family such as calbindin-D-9K, calretinin, myosin light chain, parvalbumin, S-100a, S-100b, S100A2 (S100L) and S100A6 (calcyclin; Sigma-Aldrich Technical Service). CalB staining is not seen in CalB-KO animals (results from our lab).
Immunocytochemistry
Floating slices were washed in PBS at room temperature to remove any residual paraformaldehyde. All sections were triple-labeled for biotin or biocytin, GFP and AVP. To label biotin and biocytin, slices were incubated overnight at 4°C with Cy2 streptavidin (Jackson ImmunoResearch, West Grove, PA) in PBS containing 0.3% Triton X-100. Slices were then washed three times in PBS over 10 minutes. To label GFP and AVP, slices were incubated in normal donkey serum (Jackson ImmunoResearch) in PBS for 1 hour on a shaker at room temperature, then in anti-GFP and anti-AVP antibodies in PBS containing 0.3% triton for 48 hrs at 4°C. Slices were washed 10 minutes three times with PBS containing 0.1% triton. They were then incubated in secondary antibodies: Cy3 donkey anti-rabbit and Cy5 donkey anti-guinea-pig (Jackson ImmunoResearch) for 2 hours at room temperature. Finally, slices were washed with PBS three times over 10 minutes, mounted onto glass slide and dried overnight. Slides were dehydrated using alcohol and xylene baths and coverslipped with Krystalon (EMD chemicals, Gibbstown, NJ). For the PN 7 pups, the primary antibodies were against GFP and CalB, and the secondary antibodies, Cy2 donkey anti-rabbit and Cy3 donkey anti-mouse.
Confocal imaging
Tissue was analyzed with the Zeiss Axiovert 200 MOT fluorescence microscope (Carl Zeiss, Thornwood, NY, USA), Zeiss LSM 510 laser scanning confocal attachment and LSM 3.95 software. Sections were excited with an argon-krypton laser using the excitation wavelengths 488 nm for Cy2, 543 nm for Cy3 and 633nm for Cy5 (visualized in green, red and with the pseudo-color blue, respectively). To count the number of double-labeled CalB+ and GFP+ cells in PN 7 pups, each cell was examined through the entire cell in 1 μm optical images using the LSM 3.95 software (Zeiss).
Cells were captured in 1μm optical sections (z-axis). To avoid cross-talk among the three wavelengths, sequential excitation by each laser was used. Optical scans of the whole SCN were captured in serial 1.5 μm sections (z-axis). Each cell was examined to assess whether it was single or double labeled for biotin or biocytin (green) and GFP (red) or AVP (blue), and to examine its processes. To visualize a filled neuron or process in a three-dimensional field, stacks of confocal images were imported to the Volocity software (Improvision Inc, Lexington, MA, USA).
Morphological analysis
Biotin and biocytin-filled neurons (green) were identified as containing or lacking GFP (red) and AVP (blue). For each neuron, a two dimensional drawing of the cells with axonal and dendritic tree was done on a transparency from the confocal stacks of pictures. Axons were identified and soma shape characterized as in (van den Pol, 1980), dendrites were characterized as in (Stuart et al., 1999). Soma perimeter, axon and dendrite lengths were measured using NIH image (version 1.62). It should be noted that for fiber measurements, we did not include cells whose primary dendrites or axons were obviously cut. For Sholl analysis, a transparent grid with concentric circles at 10μm equivalent intervals was centered over the soma, and the number of dendritic intersections was counted.
To analyze the arborization of axons, a vector analysis was performed on a two dimensional grid. For each fiber, the vector was characterized by the linear distance from the point of origin of the axon to its termination. When a cell had a bifurcated axon, the vector was calculated as the relative sum of all its individual axonal branch vectors. The overall mean axonal vectors for the GFP+ and GFP− cells were calculated as the mean length and orientation (in degrees) of each cell’s vectors and plotted on a coordinate grid mapped onto a schematic of the SCN. To analyze dendritic arborization patterns, a polar plot was used to visualize where GFP+ and GFP− dendrites terminate using a two dimensional grid with each soma was placed on the center of the grid. The dendritic terminal was marked at the end of each major (>20 μm length) branch.
Dendritic protrusions with a head neck length ≥ 2μm were defined as spines and were counted. Protrusions longer than 2 μm were termed appendages (Stuart et al., 1999). Total spine density and density in relation to the distance from the soma were calculated for each neuron. The number of appositions of dendrites and/or axon with other GRP+ soma or fibers, AVP soma or fibers was counted. The number and phenotype of non-filled cells expressing biotin or biocytin (dye-coupled cells) were counted. Given that tracer leakage can occur in the vicinity of the injected cell (Björklund et al., 1990), we did not include in the analysis those dye-coupled cells that were closer than 20μm to the biotin filled soma.
Statistical analysis
Data were analyzed using the SigmaStat software (Systat Software Inc., Point Richmond, CA). For comparison between 2 groups, parametric t-test was used when data were normally distributed and non-parametric Mann-Whitney test otherwise. For comparison between several non-parametric Wilcoxon test otherwise. Comparison of proportions between two groups was groups, ANOVA followed by Tukey’s test was used when data were normally distributed and done using z-test. Raleigh’s test was used to determine significant directionality of dendrite projections.
Photomicrographs
The photomicrograph in Fig. 4 was taken with the Q-capture software, version 2.95.0 (Quantitative Imaging, Surrey, BC, Canada) connected to a Q-Imaging Retiga EXi, fast 1394 camera mounted on a Nikon E800 microscope. The tissue was observed with a Nikon Plan Apo 20x/0.75 objective (Nikon/Morrell, Melville, NY). The other photomicrographs were confocal images obtained from the LSM 3.95 software (Zeiss) as indicated above. LSM optical slices were exported to Photoshop 7.0 (Adobe Systems, San Jose, CA) and cropped to focus on the parts of interest. For montages (Fig. 2, 8) different optical slices from an LSM stack were exported into Photoshop, cropped and placed side by side to reconstruct the cells in 2D. For Fig. 5, confocal stacks were imported into Volocity software (Improvision) to create a 3D visualization of the cell or fibers. The 3D image was exported into Photoshop and cropped. For all photomicrographs, shadows and highlights were adjusted separately for each color, in the Image-Adjustment-Levels dialog box, by dragging the black and white Input Levels to the edge of the first group of pixels on either end of the histogram. For Fig. 7B and C, the blue color was enhanced by increasing its brightness.
Figure 4.

(A) Photomicrograph of a coronal section of the SCN immunostained for GRP. GRP cells and fibers are dense in the core and extend dorsolaterally to arborize in the dorsal SCN. Scale bar, 100 μm. (B) Traces of dendrites of GFP+ (left) and GFP− (right) biocytin-filled cells. The dendrites of GFP+ cells make a dense plexus region of GFP+ cells, and some extend into the region of AVP+ cells. Dendrites of GFP− cells are largely confined to the GFP+ region. Dashed lines delineate boundaries of SCN; dotted lines delineate boundaries of GFP+ region. (C) Polar plot showing the patterns of GFP+ (left) and GFP− (right) dendritic arborization. With each cell at the center of the grid, dendrites of both cell types end preferentially in the dorsolateral quadrant.
Figure 2.

Confocal images of biocytin-filled cells.
(A) Projection of confocal image scans showing a low magnification view of the SCN to reveal the biocytin-filled (green) cell lying within the region of GFP+ (red) cells (15 μm stack of 10 scans each 1.5 μm). The fibers of this cell initially project dorsally, then orient medially toward the region of AVP+ (blue) cells, scale bar =50 μm. The right insets are confocal scans of the same cell showing biocytin (green), GFP (red), AVP (blue) staining lacking here and the overlay, confirming the peptidergic identity of the cell (Z axis = 2 μm; scale bar =10 μm). (B) Montage of a monopolar GFP+ neuron bearing appendages arising directly from the soma. The axon (white arrows) and the spiny dendrite project dorsally to the AVP+ region (blue staining; z axis = 1 μm. The montage is made up of z axis 1 μm scans taken over a total depth of 24μm. Scale bar=10 μm). Cell location is shown in a drawing of the SCN on the right. Scale bar, 50 μm. (C) Montage of a bipolar GFP+ neuron. Its axon arises proximally from the ventral dendrite, projects laterally, then dorsally, is dye coupled to another cell (small arrow) and makes appositions onto GFP+ somata (large white arrows), turns toward the medial SCN region and bifurcates (arrowhead). One branch reaches the AVP+ region and ends making contact with AVP+ cells (large right arrow). The other branch extends ventrally among GFP+ cells. One dendrite extends ventrally among GFP+ cells, while the second extends dorsomedially among AVP+ cells. The montage is made up of z axis = 1 μm scans taken over total depth of 31μm, scale bar, 10 μm. Cell location is shown in a drawing of the SCN on the right. biotin=green, GFP=red and AVP=blue. Scale bar for drawing, 50 μm. The insets above show appositions of the axon (green) of the cell in C onto an AVP+ cell (blue) and onto a GFP+ cell (red), scale bar, 10 μm.
Figure 8.

(A) Montage of confocal scans of an immunostained section showing a yellow cell double-labeled for biocytin (green) and GFP (red, small arrow) with a dendrite extending to the left and contacting a dye-coupled GFP− cell (large arrow). (B) Average number of dye coupled cells of tracer-filled pGRP+ and GFP− neurons. Most of these cells are of unknown phenotype. (*p<0.02, scale bar 10 μm; z axis= 1μm).
Figure 5.

(A) Three dimension confocal picture from a GFP+ dendrite portion bearing simple spines (scale bar 10 μm). (B) Three dimension confocal image from a GFP+ soma bearing appendages (a). The dendrite bears spines (b) and the axon has spine-like protrusions (c, scale bar 5 μm). (C, D, E) Confocal pictures showing different type of spines: varicosities (D) simple spine (E) branched spine (dashed arrow) and racemose appendage (continuous arrow; scale bar 10 μm). (F) Percentage of neurons in relation to their spine density. Most GFP+ and GFP− cells have 1–5 spines/100 μm. (G) Spine density of filled cells relative to the distance from the soma.
Figure 7.

A) Confocal scan of a dendrite (green) from a tracer-filled GFP+ cell making appositions on a GFP+ soma (red; scale bar 5 μm; z axis= 1 μm). B) Confocal scan of a tracer-filled dendrite (green) apposed to an AVP+ soma and fiber (blue, scale bar 5μm; z axis= 1 μm). (C) Confocal scan of an axon (green) from a GFP+ tracer-filled cell apposed to an AVP+ fiber (blue; scale bar 1μm; z axis= 1 μm). (D, E) Bar graph showing number of appositions made by tracer-filled dendrites and axons on other GFP+ somata, GFP+ fibers, AVP+ somata or AVP+ fibers. *p<0.05.
RESULTS
Identification of GFP+ cells in the perinatal mouse
As noted in the “Introduction”, there are developmental changes in SCN expression of CalB. At postnatal day 3–6, CalB is primarily localized to the core. In the adult it is sparse and scattered throughout the nucleus (Ikeda and Allen, 2003; Kriegsfeld et al., 2008). There are several parallels between mouse GRP cells and hamster CalB cells: specifically, both are localized to a core region of SCN, both are retinorecipient, and both lack detectable rhythmic expression of clock genes (Antle and Silver, 2005). Finally, in hamster, about half the CalB cells colocalize GRP and half the GRP cells colocalize CalB (LeSauter et al., 2002).
We sought to determine whether GFP and CalB are coexpressed in core SCN neurons of the perinatal mouse. To this end, we performed double-label immunochemistry for GFP and CalB in the PN 7 mouse. At this age, when CalB is still expressed in a dense cluster of cells in the core, the majority (86.7%) of GFP+ cells are CalB+ and 87.2% CalB+ cells are GFP+. This can be seen at low magnification in the overlap in the distribution of GFP+ and CalB+ cells (Fig. 1). The high magnification inset of a confocal scan (1μm, z axis) reveals that both peptides are expressed in the same cell.
Figure 1.

The panel on the left shows a low magnification confocal scan of mouse SCN at postnatal day 7, double-labeled for GFP (green) and CalB (red); z axis = 6μm; scale bar = 50 μm). The right panels show a high magnification view of double-labeled cells, immunostained for GFP (upper) CalB (middle), and the overlay (lower), indicating that these proteins are colocalized. (z axis = 1μm, scale bar,10 μm).
Morphology of tracer-filled neurons
Sixty seven cells were filled with either biotin in fixed slices (39 cells) or biocytin tracer in fresh tissue (28 cells). The data were combined as there were no significant differences between the results obtained by the two methods (t-test done on each measure shown in Table 2). Of the 67 cells, 46 (69%) were GFP+ and 21 were GFP−. In the paragraphs below, the results for GFP+ cells are described first, followed by the results for the GFP− cells, along with a comparison of the two cell types. The measurements in Table 2 are probably an underestimation of length, as some dendritic and axonal branches were probably cut.
Table 2.
Quantifications of morphological parameters of GFP+ and GFP− filled cells. Comparisons between the two groups of filled cells were done using the parametric t-test when the normal test passed or the non-parametric Mann-Whitney test when the normal test failed.
| GFP+ filled neurons | GFP− filled neurons | ||
|---|---|---|---|
| Cell body perimeter (μm) | 33.0±0.8 (n=46) | 30.6±1.2 (n=21) | N.S. |
| Number of dendrites | 3.5±0.3 (n=46) | 2.9±0.5 (n=21) | N.S. |
| Total dendritic length (μm) | 664.9±77.3 (n=28) | 330.1±56.1 (n=14) | p=0.003 |
| Mean axonal length (μm) | 275.4±57.7 (n=19) | 116.5±46.8 (n=5) | p=0.02 |
| Dendritic branching number/cell | 11.7±1.5 (n=28) | 6.0±1.4 (n=14) | p<0.02 |
| Number of dye-coupled cells/cell | 3.8±0.6 (n=28) | 1.3±0.3 (n=14) | p=0.02 |
| Spines/cell | 19.4±4.2 (n=28) | 11.8+±2.8 (n=14) | N.S. |
The methods used to identity the location and phenotype of the biocytin/biotin-labeled cells and two representative GFP+ filled cells are shown in Fig 2. The location of the biocytin-filled cell within the SCN can be seen in a low magnification view of a representative triple labeled SCN within a brain slice (Fig. 2A). The high magnification insets immediately on the right shows that this biocytin-labeled cell (green) expresses GFP (red) but lacks AVP (blue). Two other GFP+ cells are shown, along with a drawing indicating their location within the SCN. In Fig. 2B a monopolar GFP+ cell is seen with several appendages arising from a round perikaryon. Spines are present all along the dendrite. The axon does not branch. In Fig. 2C a GFP+ bipolar cell with two non-spiny dendrites is seen extending from an ovoid perikaryon. The axon branches into two collaterals and makes appositions on both GFP+ and AVP+ cells (insets in Fig. 2C). In both of these GFP+ neurons, dendrites and axons extend within the AVP+ region.
Morphological features of the GRP+ cells
Soma
The perimeter of GFP+ cells were on average 33.0μm (Table 2). The majority were ovoid (n=22) or round (n=18), while few were conical (n=6) and none were polygonal. Somatic appendages, 2 to 15μm long, protruded from the perikaryon of 21/37 cells. Nine cells were either close to the surface or adjacent to biotin-labeled cells preventing visualization of the whole soma. GFP+ cells bearing somatic appendages were significantly larger than those lacking these appendages (perimeter: 36.3±1.10μm vs. 29.8±0.6μm respectively, t-test p<0.001), and cell size was positively correlated with the number of appendages (r=0.7, p<0.001).
Dendrites
Dendritic morphology was assessed in 35/46 GFP+, tracer-filled cells. The remaining 11 cells were not included either because closely apposed cells contained biotin, preventing determination of the origin of the fibers (n=4), or because the filled cell was close to the surface and primary dendrites may be missed (n=7). Most GFP+ cells were multipolar (24/35) and had, on average, 4.2±0.2 dendrites arising from the soma. Most GFP+ multipolar cells displayed stellate radiation (14/24) with 4.6±0.3 dendrites/cell (Fig. 3D); the other ten had partial radiation (Fig. 3C) with 3.6±0.3 dendrites extending either dorsally (6/10; average dendrites number: 3.3±0.2), medially (3/10; average dendrites number: 4.0±1.0) or ventrally (1/10 with 4 dendrites). Nine of the 35 cells were bipolar cells (Fig. 3B); 8 of these had two dendrites extending in opposite directions, along either the dorsoventral axis (4/8), the mediolateral axis (3/8) or had one oriented dorsomedially and the other ventrolaterally (1/8); one cell had two dendrites extending in a common dorsolateral direction. Every cell had at least one dendrite arborizing within the AVP+ region. The remaining two GFP+ cells were monopolar (Fig. 3A); one had a dendrite extending dorsolaterally without branching; the other had a dendrite extended medially, branching 4 times. For both monopolar cells, the dendrite extended within the AVP+ region. Sholl analysis indicates that dendrites of GFP+ cells display most of the intersections at distances less than 100μm from the soma (Fig. 3E), and that dendritic branching occurs close to the soma (20–100 μm; Fig. 3F).
Figure 3.

Morphology of GFP+ neurons. (A) Monopolar neuron with axon of soma origin projecting dorsally. The dendrite projects dorsally. (B) Bipolar cell with axon originating from a dendrite and projecting first laterally, then dorsally and turning ventromedially to bifurcate. Both branches then project dorsomedially. One dendrite extends ventrally, the other dorsomedially. (C) Multipolar cell with partial dorsal radiation of the dendrites; the axon was not identified. (D) Multipolar cell with stellate radiation of its dendrites, although they project to a greater extend in the dorsal/dorsomedial direction; its axon of somatic origin projects dorsally. Scale bars, 20 μm. (E) Sholl analysis showing intersection points for GFP+ and GFP− dendrites relative to the distance for the soma. (F) Number of branch points for GFP+ and GFP− dendrites relative to their distance form the soma.
GRP staining reveals dense axonal and dendritic fibers concentrated in the ventral region and extending to the dorsal most aspect of the SCN (Fig. 4A). Dendrites of individual tracer-labeled GFP+ cells are shown in Fig. 4B, while axons are seen in Fig 6A, and reveal a similar pattern. The SCN is about 300 μm wide, and GFP+ cells extend about 210 μm at their widest point. From the Sholl analysis, we estimate that 89.6% of the dendrite’s intersection points are within 100 μm of the cell body of origin. Dendritic arborization of individual cells was assessed in 27/35 GFP+ filled cells analyzed above. In the remaining 8 cells, primary dendritic branches were cut and these were not analyzed. The results show that GFP+ cells had dendritic length of 664.9±77.3μm (Table 2). GFP+ dendrites arborized within the GFP+ region and all cells had at least one dendrite extending into the AVP+ region. Three cells had a dendrite extending outside the SCN (two dorsolaterally in the sPVZ area and one laterally in the peri-SCN; Fig. 4B, left). The polar plot shows that dendrites arborize preferentially, and extend further in the dorsolateral direction. Ninety six of 176 terminals are dorsal to their cell body, 52 are in the dorsolateral, 39 in the dorsomedial, 37 in the ventrolateral and 34 in the ventromedial quadrant (Fig. 4C left). Raleigh’s test for directionality indicates a significant mean dorsolateral direction at 313.5° (z=3.4, p=0.03).
Figure 6.
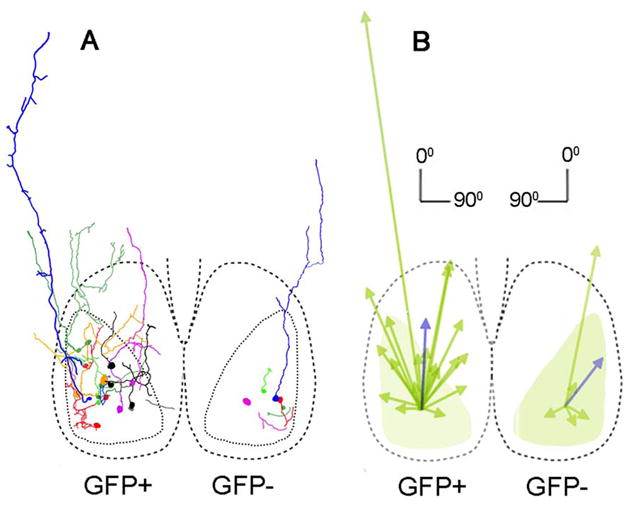
(A) Tracing of axons of GFP+ and GFP− filled cells. GFP+ axons project mostly in the dorsal direction, innervating part of the core, the shell and some extending outside the SCN. Dashed lines delineate boundaries of SCN; dotted lines delineate boundaries of GFP+ region. (B) Vector analysis showing GFP+ and GFP− individual (green) and average (blue) vectors.
Spines
Dendritic spine density and morphology was analyzed for the 27 cells discussed above. Fig. 5A shows a representative portion of a GFP+ dendrite bearing multiple simple spines. Fig 5B shows a GFP+ soma with somal appendages (a), dendrites bearing spines (b) and an axon with spine-like protrusions (c). GFP+ dendrites frequently (25/27) display varicosities (Fig. 5C) and simple spines (Fig. 5D) and more rarely racemose appendages (2/27) and branched spine (Fig. 5E). On average, GFP+ filled cells have 19.4±4.2 spines/cell (Table 2). Most of the GFP+ cells had <5 spines/100μm (Fig. 5F). Spines were generally located close to the soma, with most lying within 10–50μm (Fig. 5G). More specifically, 23/27 cells had spines exclusively localized within 130μm from the soma and none beyond this distance.
Axons
Axons were identified in 19/35 GFP+ cells by their fine process with small diameter along the entire length. Twelve axons originated from the soma, the others originated from a dendrite. The mean axon length for GFP+ filled neurons was 275.4±57.7μm. These axons terminated primarily in the AVP+ region (n=10), but also in the GFP+ region (n=5) or outside the SCN (sPVZ: n=3; reuniens of the thalamus: n=1; (Fig. 6A left). Many axons have small branches restricted mainly to the SCN. GFP+ axonal average vector was 155.6±34.3μm long and 2.3±10.6 degrees of orientation (Fig. 6B left, blue arrow). For axons that remain within the SCN, the average vector was 99.9±10.6μm long and 3.5±13.3 degrees of orientation.
Appositions
Both axons and dendrites of GFP+ cells make appositions with other SCN soma and fibers (Fig. 7). Representative examples are provided, as follows: A dendrite from a GFP+ tracer-filled cell (green) is seen making appositions on a GFP+ soma (red, Fig. 7A). A dendrite from a GFP+ tracer-filled cells (green) is apposed to an AVP+ cell (blue, Fig. 7B) and a GFP+ tracer-filled axon (green) contacts an AVP+ fiber (blue, Fig. 7C). Note that axonal appositions to GFP+ and AVP+ cells are also shown for the cell in Fig. 2C. Dendrites of tracer-filled GFP+ neurons make significantly more appositions on GFP+ perikarya and AVP+ fibers than on GFP+ fibers or AVP+ perikarya respectively (6.4±0.9; 5.6±0.8; 2.3±0.6; 2.8±0.6, Anova, p<0.001). Finally, axons from GFP+ tracer-filled cells make more appositions on AVP+ fibers than on AVP+ somata or GFP+ fibers (3.4±0.7; 0.7±0.3; 1.3±0.4 respectively, Anova, p=<0.001).
Dye coupling
Of the tracer filled GFP+ cells bearing dendritic arbors, dye coupling was seen in 20/27 instances (Fig. 8A). These neurons contacted an average of 3.8±0.6 dye-coupled cells. The dye-coupled cells were located primarily in the GFP+ region (67% vs. 33% in the AVP+ region). They were infrequently dye-coupled to other GFP+ or to AVP+ cells and more frequently to cells of unknown phenotype (0.4±0.2; 0.1±0.1; vs. 3.3±0.6, Fig. 8B; Fig 2C, small arrow).
Morphological features of the GFP− cells
The methods used for filling the cells involved aiming the electrode at GFP+ cells under the microscope. In some cases, an immediately adjacent cell was filled, rather than the intended cell. These are not random SCN cells as in each case they are cells that are immediately adjacent to the GFP+ cells in the SCN core.
Soma
As summarized in Table 2, tracer-filled GFP− neurons (N=21), have an average soma perimeter of 30.6±1.2μm. Cell bodies were mostly ovoid (11/21), some were round (7/21) or conical (3/21), no polygonal cell was seen. Some GFP− somata (6/16) displayed up to 10 appendages ranging from 1μm to 15μm of length. Five cells were either close to the surface or adjacent to biotin-filled cells preventing visualization of protrusions from the whole soma. For the GFP− cells, there was no correlation between number of appendages and cell size r=0.2, p=0.4. There were no differences between GFP+ and GFP− somata in perimeter (t-test; p=0.09), shape (z-test; p>0.8) or number of appendages (z-test; p=0.77).
Dendrites
Dendritic morphology was assessed in 16/21 GFP− neurons. 5/21 cells were not included because an apposed cell was biotin-immunoreactive and the cell of origin could not be identified (2/21) or because the dendrites were directed toward the surface and were cut (3/21). GFP− neurons were either monopolar (5/16), bipolar (3/16), or multipolar (8/16) and had no consistent pattern of arborization. There were no differences in the numbers of dendrites arising from the soma of GFP+ vs. GFP− neurons (Mann-Whitney test, p=0.20).
Dendritic arborization was analyzed in 14/21 GFP− neurons. The remaining 7/21 GFP− neurons bore cut primary processes and were not analyzed. GFP− filled cells had an average total dendritic length of 330.1±56.1 μm (Table 2). GFP− and GFP+ filled cells had a similar number of dendrites originating from the soma, but the GFP+ dendrites had more nodes and significantly more intersection points between 20μm and 80μm from the soma (Table 2; Fig. 3; Mann-Whitney test; p<0.05). Dendritic branching occurs close to the soma (20–50 μm; Fig. 3F). Overall, GFP+ dendrites had more branch points per cell than GFP− dendrites (p<0.02). Most GFP− cells had sparse dendritic arbors largely confined to the GFP+ region with a few terminating in the AVP-GFP border and none extending outside the SCN (Fig 4B). Terminals of GFP− dendrites lie preferentially in the dorsal direction from the soma (N=35 dorsally vs. 15 ventrally; Fig. 4C right). Raleigh’s test for directionality indicate a significant mean dorsolateral direction at 350.5° (z=5.1, p=0.006).
Spines
Spine density and morphology in GFP− and GFP+ neurons were similar (Fig. 5; z-test; p>0.4), with an average of 11.8±2.8 spines/cell and ~1–5 spines/100μm (Table 2; Fig. 5F). The average number of spines in relation to distance from the soma was the same for GFP+ and GFP− dendrites (Mann-Whitney test; p>0.1; Fig 5G).
Axons
Axons were identified in 5/14 GFP− cells. Three axons originated from the soma and 2 from a dendrite. Four axons projected within the GFP+ region, while one axon projected to the subparaventricular zone (Fig. 6A right). GFP− axons are significantly shorter than GFP+ axons (Table 2) and project dorsolaterally (Fig. 6B right, blue arrow). When all axons are included, there are no significant differences between cell types in orientation (Mann-Whitney test; p=0.23) or in normalized vector lengths (Mann-Whitney test; p=0.1). If the axon projecting outside the SCN is excluded, the average vector was 48.1±3.4μm of length, a value significantly different from the GFP+ vector of axons remaining within the SCN (t-test, p=0.03).
Appositions
Dendrites of filled GFP− neurons make more appositions on AVP+ fibers than on GRP+ fibers or AVP+ perikarya respectively (3.9±0.8; 1.3±0.4; 1.1±0.4, Anova, p=0.001). In comparison to GRP+ filled dendrites, those of GFP− cells have fewer appositions on GFP+ soma (Mann-Whitney test, p=0.02; Fig. 7C). Also, compared to those of GFP+ cells the axons of GFP− cells had fewer appositions on AVP+ fibers (p=0.05; Fig. 7D).
Dye coupling
Dye coupling was seen in cell bodies remote from the site of injection for 9/14 filled cells for which dendritic arborization was analyzed. In contrast to biocytin filled GFP+ cells, GFP− neurons were dye-coupled to significantly fewer cells (3.8 vs. 1.3±0.3 respectively; Mann-Whitney test, p<0.02). These dye-coupled cells were located primarily in the GFP+ region (85% vs. 15% in the AVP+ region). On average, GFP− neurons were dye-coupled to few GFP+ or AVP+ cells (each 0.1±0.1) as were GFP+ cells, but had significantly fewer coupled cells of unknown phenotype than did GFP+ filled cells (1.1±0.3 vs. 3.3±0.6; Mann-Whitney, p<0.02; Fig. 8, bottom).
DISCUSSION
The SCN consists of two distinct neuronal populations, one of which is localized largely to the core of the nucleus and contains neurons that are directly retinorecipient, and the other is localized to the shell, and bears cells that oscillate with a high amplitude but lack dense input from the retinohypothalamic tract (Abrahamson and Moore, 2001; Antle and Silver, 2005). These compartments are made up of several different peptidergic cell types, whose functions are not known (Abrahamson and Moore, 2001; Moore et al., 2002). Specifically, the role of various peptides in SCN circuits has not been delineated.
GRP-containing cells in the core of the mouse SCN are a particularly interesting phenotype within the brain clock insofar as they integrate information from the external milieu, such as light input from the retina (Abrahamson and Moore, 2001; Bryant et al., 2000; Karatsoreos et al., 2004) and the internal milieu, such as hormonal input through androgen receptors (Karatsoreos et al., 2007), but lack detectable circadian rhythms in expression of the clock proteins PER1 and PER2 (Karatsoreos et al., 2004). Injection of GRP induces phase shifts similar to those induced by light (Antle et al., 2005; Gamble et al., 2007; Kallingal and Mintz, 2006; Piggins et al., 1995). In animals lacking the VIP receptor, GRP administration promotes SCN electrical rhythms (Brown et al., 2005) and synchronizes gene expression rhythms in otherwise asynchronous neurons in SCN slices (Maywood et al., 2006).
In general, the analysis of intra-SCN connections has been hampered by the size of SCN neurons, which are among the smallest in the brain, and by the very fine caliber of their fibers (Abrahamson and Moore, 2001; Moore et al., 2002; van den Pol, 1980). These problems were overcome in the present study by injecting cells with biotin or by whole cell membrane perforation and infusion of biocytin. A novel finding of this study is that pGRP cells differ from their non-pGRP neighbors in the core in that they bear a dendritic tree with more branches, longer axonal arbors, and more dye-coupled cells. To our knowledge, there are no other studies available for comparison of dendritic and axonal arborization of specific peptidergic cell type in the mouse SCN, though AVP cells in rat (Pennartz et al., 1998) and CalB cells in hamsters have been examined (Jobst et al., 2004).
Within core and within shell connections
There is evidence of segregation of connections within each of the two compartments of the SCN. Following localized intra-SCN iontophoretic injections of biotinylated dextran amine (BDA) to the SCN shell of the Syrian hamster, the anterograde tracer was seen throughout the shell on the ipsi- and contralateral side, but it was entirely absent in the core (Kriegsfeld et al., 2004a). In keeping with this result, we report here that pGRP neurons form a dense network of local circuits within the SCN core, indicated by the number of appositions, and by branching patterns. By these measures, fibers of adjacent non-pGRP cells have fewer arbors and do not form as dense a network, though they too are largely restricted to the core.
A second line of evidence characterizing communication within SCN subregions is dye-coupling of pGRP neurons. Previous studies have revealed gap-junctions in the SCN (Colwell, 2000; Long et al., 2005; Rash et al., 2001; Shinohara et al., 2000). We show here that pGRP containing cells have a three-fold greater number of dye-coupled cells compared to adjacent non-pGRP core neurons. Furthermore, for both pGRP and non-pGRP cells, the dye coupling is predominant in the core (67% for pGRP and 87% for non-pGRP). While it is possible that dye coupled cells are filled following the uptake of biotin or biocytin through cut processes, this is unlikely an explanation for the dye coupling revealed here as we demonstrate processes extending from the patched to the coupled cell (Fig. 8). Similar findings have been reported in hamster, where CalB cells show dye-coupling to other cells in the core region of the SCN (Jobst et al., 2004). We suggest that gap-junctions may be involved in synchronizing photic resetting information among light responsive neurons. In this view, pGRP neurons are not merely a relay for the photic information to oscillator cells but also serve to integrate information from the environment.
Characterizing two-way core-shell connections in the SCN
Though one-way communication from core to shell was previously suggested, based on viral tracing and immuno-electron microscopy (Daikoku et al., 1992; Leak et al., 1999), the present results reveal potential for reciprocal communication through dendritic arbors of pGRP cells. GFP+ fibers extend to the AVP+ region of the SCN, where they make appositions on AVP+ cells (Fig 5). This communication may be somatodendritic from AVP+ cells to GFP+ cell through the GFP+ dendrites. Dendrosomatic signaling could also occur through dendritic peptidergic release, as has been described in other hypothalamic regions (Ludwig and Leng, 2006). This result is consistent with studies in rats and mice, showing GRP fibers projecting towards the shell, though in this latter work axons and dendrites could not be distinguished (Abrahamson and Moore, 2001; Mikkelsen et al., 1991). A cell-filling study of CalB in the hamster SCN demonstrates a dorsomedial orientation of the dendrites (Jobst et al., 2004). While appositions from AVP onto GRP cells have been observed in rats, it is unclear whether these are axo-somatic or dendro-somatic. Although the authors assumed that all labeled processes were axons (Romijn et al., 1997), electron microscopic evidence of immunostained material indicates that the peptidergic label does occur within dendritic fibers of SCN AVP cells (van den Pol and Gorcs, 1986).
Modeling and biological data come together
The present anatomical evidence for reciprocal shell-to-core communication potentially resolves a problem in understanding the contribution of non-rhythmic cells to pacemaker function of the brain clock. In constant conditions, non rhythmic neurons of the SCN are thought to synchronize the free-running periods of cell autonomous oscillators and to elaborate an average signal of phase (Antle et al., 2003; Antle et al., 2007). In the gate and oscillator model, synchrony requires feedback from the shell to the core to account for coherent rhythmicity in constant conditions. We hypothesize that the extensively branching dendritic arbors of pGRP cells, and their contacts with AVP neurons may provide an anatomical basis for this input. The estimated number of synaptic contacts for an SCN neuron is ~300–1200, pointing to a greater synaptic density than described for other regions (Moore and Bernstein, 1989). The present analysis indicates that these contacts include dendrites of core neurons that arborize in the shell.
Comparison of mouse GRP and hamster CalB neurons
The mouse used here to reveal the morphology of pGRP cells was made by insertion of EGFP in the calbindin BAC by homologous recombination. The GFP reporter is seen in the same core region of SCN as CalB+ neurons of the adult hamster, yet the adult mouse SCN lacks CalB cells (Ikeda and Allen, 2003; Kriegsfeld et al., 2008). Adding to the puzzle, CalB cells of the hamster and GRP cells of the mouse share common functional properties in that they lack detectable rhythms in PER1 and PER2 and are directly retinorecipient (reviewed in (Antle and Silver, 2005). The present results address this issue in revealing that in the young mouse the CalB cells co-express GFP in this CalB::GFP transgenic mouse (Fig. 1). It is possible that CalB is produced at undetectable levels in the adult mouse, as suggested in GENSAT web site home page (http://www.gensat.org/login.jsp), and that the dynamics of GFP expression permit visualization of an otherwise undetectable protein. In this view it is not surprising that there are notable similarities in these cells of mouse and hamster. Morphologically, most of GFP+ neurons are multipolar cells that are characterized by an extensive dendritic arborization while adjacent, non-GFP cells have a reduced dendritic arborization. Similarly, in the hamster, CalB cells in the core have a more extensive arborization compared to adjacent core cells (Jobst et al., 2004). In contrast, AVP neurons of the dorsolateral SCN are mainly monopolar or bipolar with only a few branches (Pennartz et al., 1998). While the specific function of CalB leading to these species differences is not known, there is evidence that the CalB cells respond to photoperiod (Menet et al., 2003), a response lacking in mice.
Compare GRP cells to other cells of the SCN
Several specialized features of pGRP neurons have been identified in the present work. The total dendritic length, mean axonal length, number of dendritic nodes and number of dye coupled cells is greater for the pGRP phenotype compared to immediately adjacent cells of the core (Table 2). On the other hand, other features of pGRP cells are not unique. The somal size and number of dendrites do not differ between pGRP and non-pGRP cells. Furthermore, each of the cell types identified in the SCN in Golgi impregnated material in rat (simple bipolar, monopolar curly, radial multipolar, and spiny neuron (van den Pol, 1980) is also seen in pGRP cells. This shows that peptidergic phenotype is not a constraint of cellular morphology. In keeping with studies based on immunocytochemistry, the results indicate that GRP cell bodies are localized to the core (Gundlach and Knobe, 1992; Mikkelsen et al., 1991; Silver et al., 1999). GFP+ fibers are most dense in the region of cell bodies, and are heterogeneously distributed in the rest of the nucleus. Techniques used in the foregoing studies can not distinguish axons and dendrites nor resolve dendritic spines.
A comparison of GRP cells with other cells of the SCN is constrained by the paucity of data that results from poor SCN axonal and dendritic staining with conventional histological methods (van den Pol, 1980). The general features of pGRP cells resemble that seen in SCN stained with Golgi material (van den Pol, 1980). In Golgi material, about half the axons originate from a proximal dendrite, although in a few cases axons arise from a large secondary dendrite. Here, 7/19 of the pGRP axons originate from a dendrite. Both methods show that axons have many branch points and the Golgi material reveals both boutons en passant and terminal boutons. In the case of pGRP cells, most of the dendritic arborization and axonal projections and branching are confined to the SCN. This is consistent with evidence that following surgical isolation of the SCN from the adjacent hypothalamus (rat), up to 80% of the synaptic endings survive (cited in (van den Pol, 1991). Golgi impregnation of rat SCN indicates that most cells have relatively simple dendritic arbors, few of which travel into the adjacent hypothalamus.
Summary and conclusion
Many mechanisms have been proposed to underlie oscillator cell synchronization in the SCN, from neurotransmission to electrical coupling and paracrine and endocrine signaling (for review, see (Aton and Herzog, 2005). To our knowledge there are but three prior studies focused on intra-SCN connections, and none were done on mouse (Jobst et al., 2004; Leak et al., 1999; Pennartz et al., 1998). We show here that pGRP axons project mainly to the dorsal region of the SCN, making close appositions on AVP cells. GRP dendrites extend within the same shell regions and contact AVP neurons. pGRP cells differ from their immediate neighbors in that their dendritic arbors are longer and more extensive. They form a dense network of local circuits, indicated by the number of dye-coupled cells and appositions on other pGRP cells. These results expand our understanding of SCN connectivity by demonstrating that in the mouse, pGRP cells are positioned to integrate information from the internal and external environment and to support reciprocal communication between the core and the shell.
Footnotes
This work was supported by NIH Grants 37919 and 075045 to RS, NSF grant DBI320988 (to Barnard College), Fondation Medicale de France to ED and FP6-EUCLock to Howard Cooper, INSERM, France. We also thank the anonymous reviewer for exceptional careful reading of the manuscript.
LITERATURE CITED
- Abrahamson EE, Moore RY. Suprachiasmatic nucleus in the mouse: retinal innervation, intrinsic organization and efferent projections. Brain Res. 2001;916(1–2):172–191. doi: 10.1016/s0006-8993(01)02890-6. [DOI] [PubMed] [Google Scholar]
- Aida R, Moriya T, Araki M, Akiyama M, Wada K, Wada E, Shibata S. Gastrin-releasing peptide mediates photic entrainable signals to dorsal subsets of suprachiasmatic nucleus via induction of Period gene in mice. Mol Pharmacol. 2002;61(1):26–34. doi: 10.1124/mol.61.1.26. [DOI] [PubMed] [Google Scholar]
- Antle MC, Foley DK, Foley NC, Silver R. Gates and oscillators: a network model of the brain clock. J Biol Rhythms. 2003;18(4):339–350. doi: 10.1177/0748730403253840. [DOI] [PMC free article] [PubMed] [Google Scholar]
- Antle MC, Foley NC, Foley DK, Silver R. Gates and oscillators II: zeitgebers and the network model of the brain clock. J Biol Rhythms. 2007;22(1):14–25. doi: 10.1177/0748730406296319. [DOI] [PMC free article] [PubMed] [Google Scholar]
- Antle MC, Kriegsfeld LJ, Silver R. Signaling within the master clock of the brain: localized activation of mitogen-activated protein kinase by gastrin-releasing peptide. J Neurosci. 2005;25(10):2447–2454. doi: 10.1523/JNEUROSCI.4696-04.2005. [DOI] [PMC free article] [PubMed] [Google Scholar]
- Antle MC, Silver R. Orchestrating time: arrangements of the brain circadian clock. Trends Neurosci. 2005;28(3):145–151. doi: 10.1016/j.tins.2005.01.003. [DOI] [PubMed] [Google Scholar]
- Aton SJ, Herzog ED. Come together, right…now: synchronization of rhythms in a mammalian circadian clock. Neuron. 2005;48(4):531–534. doi: 10.1016/j.neuron.2005.11.001. [DOI] [PMC free article] [PubMed] [Google Scholar]
- Billig I, Foris JM, Enquist LW, Card JP, Yates BJ. Definition of neuronal circuitry controlling the activity of phrenic and abdominal motoneurons in the ferret using recombinant strains of pseudorabies virus. J Neurosci. 2000;20(19):7446–7454. doi: 10.1523/JNEUROSCI.20-19-07446.2000. [DOI] [PMC free article] [PubMed] [Google Scholar]
- Björklund A, Hökfelt T, Wouterlood FG, Van den Pol AN. Analysis of neuronal microcircuits and synaptic interactions. Amsterdam: Elsevier Science Publishers B.V; 1990. [Google Scholar]
- Brown TM, Hughes AT, Piggins HD. Gastrin-releasing peptide promotes suprachiasmatic nuclei cellular rhythmicity in the absence of vasoactive intestinal polypeptide-VPAC2 receptor signaling. J Neurosci. 2005;25(48):11155–11164. doi: 10.1523/JNEUROSCI.3821-05.2005. [DOI] [PMC free article] [PubMed] [Google Scholar]
- Bryant DN, LeSauter J, Silver R, Romero MT. Retinal innervation of calbindin-D28K cells in the hamster suprachiasmatic nucleus: ultrastructural characterization. J Biol Rhythms. 2000;15(2):103–111. doi: 10.1177/074873040001500204. [DOI] [PMC free article] [PubMed] [Google Scholar]
- Colwell CS. Rhythmic coupling among cells in the suprachiasmatic nucleus. J Neurobiol. 2000;43(4):379–388. doi: 10.1002/1097-4695(20000615)43:4<379::aid-neu6>3.0.co;2-0. [DOI] [PMC free article] [PubMed] [Google Scholar]
- Daikoku S, Hisano S, Kagotani Y. Neuronal associations in the rat suprachiasmatic nucleus demonstrated by immunoelectron microscopy. J Comp Neurol. 1992;325(4):559–571. doi: 10.1002/cne.903250408. [DOI] [PubMed] [Google Scholar]
- Gamble KL, Allen GC, Zhou T, McMahon DG. Gastrin-releasing peptide mediates light-like resetting of the suprachiasmatic nucleus circadian pacemaker through cAMP response element-binding protein and Per1 activation. J Neurosci. 2007;27(44):12078–12087. doi: 10.1523/JNEUROSCI.1109-07.2007. [DOI] [PMC free article] [PubMed] [Google Scholar]
- Gundlach AL, Knobe KE. Preprogastrin-releasing peptide messenger ribonucleic acid: neuroanatomical localization in rat brain by in situ hybridization with synthetic oligodeoxynucleotide probes. Neurosci Lett. 1992;137(1):123–128. doi: 10.1016/0304-3940(92)90313-v. [DOI] [PubMed] [Google Scholar]
- Hamada T, LeSauter J, Venuti JM, Silver R. Expression of Period genes: rhythmic and nonrhythmic compartments of the suprachiasmatic nucleus pacemaker. J Neurosci. 2001;21(19):7742–7750. doi: 10.1523/JNEUROSCI.21-19-07742.2001. [DOI] [PMC free article] [PubMed] [Google Scholar]
- Ikeda M, Allen CN. Developmental changes in calbindin-D28k and calretinin expression in the mouse suprachiasmatic nucleus. Eur J Neurosci. 2003;17(5):1111–1118. doi: 10.1046/j.1460-9568.2003.02515.x. [DOI] [PubMed] [Google Scholar]
- Jobst EE, Robinson DW, Allen CN. Potential pathways for intercellular communication within the calbindin subnucleus of the hamster suprachiasmatic nucleus. Neuroscience. 2004;123(1):87–99. doi: 10.1016/j.neuroscience.2003.08.059. [DOI] [PubMed] [Google Scholar]
- Kallingal GJ, Mintz EM. Glutamatergic activity modulates the phase-shifting effects of gastrin-releasing peptide and light. Eur J Neurosci. 2006;24(10):2853–2858. doi: 10.1111/j.1460-9568.2006.05165.x. [DOI] [PubMed] [Google Scholar]
- Karatsoreos IN, Romeo RD, McEwen BS, Silver R. Diurnal regulation of the gastrin-releasing peptide receptor in the mouse circadian clock. Eur J Neurosci. 2006;23(4):1047–1053. doi: 10.1111/j.1460-9568.2006.04633.x. [DOI] [PMC free article] [PubMed] [Google Scholar]
- Karatsoreos IN, Wang A, Sasanian J, Silver R. A role for androgens in regulating circadian behavior and the suprachiasmatic nucleus. Endocrinology. 2007;148(11):5487–5495. doi: 10.1210/en.2007-0775. [DOI] [PMC free article] [PubMed] [Google Scholar]
- Karatsoreos IN, Yan L, LeSauter J, Silver R. Phenotype matters: identification of light-responsive cells in the mouse suprachiasmatic nucleus. J Neurosci. 2004;24(1):68–75. doi: 10.1523/JNEUROSCI.1666-03.2004. [DOI] [PMC free article] [PubMed] [Google Scholar]
- Kriegsfeld LJ, Leak RK, Yackulic CB, LeSauter J, Silver R. Organization of suprachiasmatic nucleus projections in Syrian hamsters (Mesocricetus auratus): An anterograde and retrograde analysis. J Comp Neurol. 2004a;468(3):361–379. doi: 10.1002/cne.10995. [DOI] [PMC free article] [PubMed] [Google Scholar]
- Kriegsfeld LJ, LeSauter J, Silver R. Targeted microlesions reveal novel organization of the hamster suprachiasmatic nucleus. J Neurosci. 2004b;24(10):2449–2457. doi: 10.1523/JNEUROSCI.5323-03.2004. [DOI] [PMC free article] [PubMed] [Google Scholar]
- Kriegsfeld LJ, Mei DF, Yan L, Witkovsky P, Lesauter J, Hamada T, Silver R. Targeted mutation of the calbindin D28K gene disrupts circadian rhythmicity and entrainment. Eur J Neurosci. 2008;27(11):2907–2921. doi: 10.1111/j.1460-9568.2008.06239.x. [DOI] [PMC free article] [PubMed] [Google Scholar]
- Leak RK, Card JP, Moore RY. Suprachiasmatic pacemaker organization analyzed by viral transynaptic transport. Brain Res. 1999;819(1–2):23–32. doi: 10.1016/s0006-8993(98)01317-1. [DOI] [PubMed] [Google Scholar]
- LeSauter J, Kriegsfeld LJ, Hon J, Silver R. Calbindin-D(28K) cells selectively contact intra-SCN neurons. Neuroscience. 2002;111(3):575–585. doi: 10.1016/s0306-4522(01)00604-2. [DOI] [PMC free article] [PubMed] [Google Scholar]
- LeSauter J, Silver R. Localization of a suprachiasmatic nucleus subregion regulating locomotor rhythmicity. J Neurosci. 1999;19(13):5574–5585. doi: 10.1523/JNEUROSCI.19-13-05574.1999. [DOI] [PMC free article] [PubMed] [Google Scholar]
- Liu C, Weaver DR, Strogatz SH, Reppert SM. Cellular construction of a circadian clock: period determination in the suprachiasmatic nuclei. Cell. 1997;91(6):855–860. doi: 10.1016/s0092-8674(00)80473-0. [DOI] [PubMed] [Google Scholar]
- Long MA, Jutras MJ, Connors BW, Burwell RD. Electrical synapses coordinate activity in the suprachiasmatic nucleus. Nat Neurosci. 2005;8(1):61–66. doi: 10.1038/nn1361. [DOI] [PubMed] [Google Scholar]
- Ludwig M, Leng G. Dendritic peptide release and peptide-dependent behaviours. Nat Rev Neurosci. 2006;7(2):126–136. doi: 10.1038/nrn1845. [DOI] [PubMed] [Google Scholar]
- Maywood ES, Reddy AB, Wong GK, O’Neill JS, O’Brien JA, McMahon DG, Harmar AJ, Okamura H, Hastings MH. Synchronization and maintenance of timekeeping in suprachiasmatic circadian clock cells by neuropeptidergic signaling. Curr Biol. 2006;16(6):599–605. doi: 10.1016/j.cub.2006.02.023. [DOI] [PubMed] [Google Scholar]
- Menet JS, Vuillez P, Pevet P. Calbindin expression in the hamster suprachiasmatic nucleus depends on day-length. Neuroscience. 2003;122(3):591–598. doi: 10.1016/j.neuroscience.2003.08.020. [DOI] [PubMed] [Google Scholar]
- Mikkelsen JD, Larsen PJ, O’Hare MM, Wiegand SJ. Gastrin releasing peptide in the rat suprachiasmatic nucleus: an immunohistochemical, chromatographic and radioimmunological study. Neuroscience. 1991;40(1):55–66. doi: 10.1016/0306-4522(91)90174-m. [DOI] [PubMed] [Google Scholar]
- Miller JD, Morin LP, Schwartz WJ, Moore RY. New insights into the mammalian circadian clock. Sleep. 1996;19(8):641–667. doi: 10.1093/sleep/19.8.641. [DOI] [PubMed] [Google Scholar]
- Moore RY, Bernstein ME. Synaptogenesis in the rat suprachiasmatic nucleus demonstrated by electron microscopy and synapsin I immunoreactivity. J Neurosci. 1989;9(6):2151–2162. doi: 10.1523/JNEUROSCI.09-06-02151.1989. [DOI] [PMC free article] [PubMed] [Google Scholar]
- Moore RY, Speh JC, Leak RK. Suprachiasmatic nucleus organization. Cell Tissue Res. 2002;309(1):89–98. doi: 10.1007/s00441-002-0575-2. [DOI] [PubMed] [Google Scholar]
- Morin LP, Allen CN. The circadian visual system, 2005. Brain Res Brain Res Rev. 2006;51(1):1–60. doi: 10.1016/j.brainresrev.2005.08.003. [DOI] [PubMed] [Google Scholar]
- Pace CJ, Tieman DG, Tieman SB. Intracellular injection in fixed slices: obtaining complete dendritic arbors of large cells. J Neurosci Methods. 2002;119(1):23–30. doi: 10.1016/s0165-0270(02)00152-8. [DOI] [PubMed] [Google Scholar]
- Pennartz CM, Bos NP, Jeu MT, Geurtsen AM, Mirmiran M, Sluiter AA, Buijs RM. Membrane properties and morphology of vasopressin neurons in slices of rat suprachiasmatic nucleus. J Neurophysiol. 1998;80(5):2710–2717. doi: 10.1152/jn.1998.80.5.2710. [DOI] [PubMed] [Google Scholar]
- Piggins HD, Cutler DJ, Rusak B. Ionophoretically applied substance P activates hamster suprachiasmatic nucleus neurons. Brain Res Bull. 1995;37(5):475–479. doi: 10.1016/0361-9230(95)00027-c. [DOI] [PubMed] [Google Scholar]
- Rash JE, Yasumura T, Dudek FE, Nagy JI. Cell-specific expression of connexins and evidence of restricted gap junctional coupling between glial cells and between neurons. J Neurosci. 2001;21(6):1983–2000. doi: 10.1523/JNEUROSCI.21-06-01983.2001. [DOI] [PMC free article] [PubMed] [Google Scholar]
- Reppert SM, Weaver DR. Coordination of circadian timing in mammals. Nature. 2002;418(6901):935–941. doi: 10.1038/nature00965. [DOI] [PubMed] [Google Scholar]
- Romijn HJ, Sluiter AA, Pool CW, Wortel J, Buijs RM. Evidence from confocal fluorescence microscopy for a dense, reciprocal innervation between AVP−, somatostatin-, VIP/PHI−, GRP−, and VIP/PHI/GRP-immunoreactive neurons in the rat suprachiasmatic nucleus. Eur J Neurosci. 1997;9(12):2613–2623. doi: 10.1111/j.1460-9568.1997.tb01691.x. [DOI] [PubMed] [Google Scholar]
- Shinohara K, Funabashi T, Mitushima D, Kimura F. Effects of gap junction blocker on vasopressin and vasoactive intestinal polypeptide rhythms in the rat suprachiasmatic nucleus in vitro. Neurosci Res. 2000;38(1):43–47. doi: 10.1016/s0168-0102(00)00141-3. [DOI] [PubMed] [Google Scholar]
- Silver R, Romero MT, Besmer HR, Leak R, Nunez JM, LeSauter J. Calbindin-D28K cells in the hamster SCN express light-induced Fos. Neuroreport. 1996;7(6):1224–1228. doi: 10.1097/00001756-199604260-00026. [DOI] [PubMed] [Google Scholar]
- Silver R, Sookhoo AI, LeSauter J, Stevens P, Jansen HT, Lehman MN. Multiple regulatory elements result in regional specificity in circadian rhythms of neuropeptide expression in mouse SCN. Neuroreport. 1999;10(15):3165–3174. doi: 10.1097/00001756-199910190-00008. [DOI] [PubMed] [Google Scholar]
- Stuart G, Spruston N, Haüsser M. Dendrites. Oxford: Oxford University Press; 1999. [Google Scholar]
- van den Pol A. The suprachiasmatic nucleus: Morphological and cytochemical substrates for cellular interaction. In: Klein RYM DC, Reppert SM, editors. Suprachiasmatic nucleus. New York: Oxford U. Press; 1991. [Google Scholar]
- van den Pol AN. The hypothalamic suprachiasmatic nucleus of rat: intrinsic anatomy. J Comp Neurol. 1980;191(4):661–702. doi: 10.1002/cne.901910410. [DOI] [PubMed] [Google Scholar]
- van den Pol AN, Gorcs T. Synaptic relationships between neurons containing vasopressin, gastrin-releasing peptide, vasoactive intestinal polypeptide, and glutamate decarboxylase immunoreactivity in the suprachiasmatic nucleus: dual ultrastructural immunocytochemistry with gold-substituted silver peroxidase. J Comp Neurol. 1986;252(4):507–521. doi: 10.1002/cne.902520407. [DOI] [PubMed] [Google Scholar]
- Yamaguchi S, Isejima H, Matsuo T, Okura R, Yagita K, Kobayashi M, Okamura H. Synchronization of cellular clocks in the suprachiasmatic nucleus. Science. 2003;302(5649):1408–1412. doi: 10.1126/science.1089287. [DOI] [PubMed] [Google Scholar]
- Yan L, Karatsoreos I, Lesauter J, Welsh DK, Kay S, Foley D, Silver R. Exploring spatiotemporal organization of SCN circuits. Cold Spring Harb Symp Quant Biol. 2007;72:527–541. doi: 10.1101/sqb.2007.72.037. [DOI] [PMC free article] [PubMed] [Google Scholar]
- Yan L, Silver R. Differential induction and localization of mPer1 and mPer2 during advancing and delaying phase shifts. Eur J Neurosci. 2002;16(8):1531–1540. doi: 10.1046/j.1460-9568.2002.02224.x. [DOI] [PMC free article] [PubMed] [Google Scholar]
- Yang XW, Model P, Heintz N. Homologous recombination based modification in Escherichia coli and germline transmission in transgenic mice of a bacterial artificial chromosome. Nat Biotechnol. 1997;15(9):859–865. doi: 10.1038/nbt0997-859. [DOI] [PubMed] [Google Scholar]