

Abstract
The ability of cortical neurons to accurately encode the temporal pattern of their inputs has important consequences for cortical function and perceptual acuity. Here we identify cellular mechanisms underlying the sensitivity of cortical neurons to the timing of sensory-evoked synaptic inputs. We find that temporally coincident inputs to layer 4 neurons in primary visual cortex evoke an increase in spike precision and supralinear spike summation. Underlying this nonlinear summation are changes in the evoked excitatory conductance and the associated membrane potential response, and a lengthening of the window between excitation and inhibition. Furthermore, fast-spiking inhibitory interneurons in layer 4 exhibit a shorter window of temporal sensitivity compared with excitatory neurons. In contrast to the enhanced response to synchronous inputs by layer 4 neurons, sensory input integration in downstream cortical layers is more linear and less sensitive to timing. Neurons in the input layer of cortex are thus uniquely optimized to detect and encode synchronous sensory-evoked inputs.
Introduction
Basic cortical functions, such as the faithful transmission of information between neurons, may depend on the ability of cortical neurons to detect the temporal pattern of their synaptic inputs. Temporal sensitivity may take several forms, including encoding the pattern of synaptic inputs as the presence or absence of individual spike events in an ongoing train. Alternatively, temporally coincident synaptic inputs may evoke a greater number of spikes than do temporally dispersed inputs, producing a nonlinearity in the neuron's input–output function. Work in vitro and in vivo has demonstrated that cortical neurons are capable of spike output with millisecond-level precision (Mainen and Sejnowski, 1995; Kara et al., 2000; Wehr and Zador, 2003; Higley and Contreras, 2006; Kumbhani et al., 2007). Responding with high temporal precision to sensory inputs, and therefore accurately encoding their timing, may allow groups of neurons to fire together within short time windows and thus achieve repetitive, rhythmic synchronization (Konig et al., 1996; Singer, 1999). Such rhythmic activity is implicated in binding distributed representations together to permit grouping and other higher-order perceptual phenomena (Konig et al., 1995; Fries et al., 1997; Castelo-Branco et al., 1998).
Previous work in the visual system suggests that primary visual cortex neurons may be highly sensitive to the relative timing of inputs evoked by stimuli in their receptive fields. Visual and somatosensory stimuli evoke synchronous spiking among groups of thalamic neurons with similar receptive field properties (Dan et al., 1998; Reinagel and Reid, 2000, 2002; Swadlow and Gusev, 2001; Bruno and Sakmann, 2006). In turn, synchronization of pairs of spikes from multiple afferents within a short window increases their postsynaptic efficacy in evoking spikes in target layer 4 visual cortex neurons (Alonso et al., 1996; Usrey et al., 2000), suggesting a high degree of sensitivity to input timing. However, the temporal sensitivity of visual cortex neurons to sensory-evoked synaptic inputs has not been explored, and the cellular mechanisms underlying the enhanced efficacy of synchronous synaptic inputs remain unclear. In addition, it is unknown whether sensitivity to the timing of visually evoked inputs varies among neural cell classes or across downstream levels of cortical processing.
Here we identify cellular processes underlying the increased efficacy of closely timed sensory inputs to cortical neurons in vivo and identify two main biophysical mechanisms responsible for the consequent enhanced precision and magnitude of the evoked spike response. Using intracellular recordings throughout all layers of cat primary visual cortex, we find that cells in layer 4 robustly signal the occurrence of temporally coincident sensory inputs by producing a supralinear spike output. Coincident inputs are also associated with an increase in the precision of spike timing and a temporal advance in the spike response. Underlying this response to synchronous events is faster membrane depolarization and a lengthening of the window between excitatory and inhibitory synaptic conductances. Inhibitory interneurons in layer 4 have a restricted window of sensitivity to sensory input timing, whereas local excitatory neurons exhibit a more permissive temporal profile. However, sensitivity to visually evoked input timing decreases with each successive stage of cortical processing, indicating that this form of coincidence detection is most prominent in the input layer of cortex.
Materials and Methods
Surgical protocol.
Experiments were conducted in accordance with the ethical guidelines of the National Institutes of Health and with the approval of the Institutional Animal Care and Use Committee of the University of Pennsylvania. Surgical and recording methods were as reported previously (Cardin et al., 2007, 2008). Briefly, adult cats (2.5–3.5 kg) were anesthetized with an initial intraperitoneal injection of thiopental (25 mg/kg) and supplemental isoflurane (2–4% in a 70:30 mixture of N2O and O2). Subsequently, the animal was paralyzed with gallamine triethiodide (Flaxedil), and anesthesia was maintained during surgery with intravenous thiopental as needed for the duration of the experiment (14–16 h) with a continuous infusion (3–10 mg/kg/h). Heart rate, blood pressure, and EEG were monitored throughout the experiment. The end-tidal CO2 concentration was kept at 3.7 ± 0.2%, and the rectal temperature was kept at 37–38°C with a heating pad.
The surface of the visual cortex was exposed with a craniotomy centered at Horsley Clarke coordinates posterior 4.0 and lateral 2.0. The stability of the recordings was improved by performing a bilateral pneumothorax, drainage of the cisterna magna, and hip suspension, and by filling the cranial defect with a solution of 4% agar. Intracellular recordings were performed with glass micropipettes (50–80 MΩ) filled with 3 m potassium acetate. All cells had a stable resting membrane potential (Vm) more negative than −60 mV, coupled with overshooting action potentials. The results described here are based on intracellular recordings from 76 cells in layers 2–6 of cat primary visual cortex (n = 35 from layer 4, 16 from layer 2/3, 25 from layer 5/6). Regular-spiking (RS) and fast-spiking (FS) cells were distinguished by spike waveform characteristics, frequency–current curves, and firing rate accommodation, as described previously by Cardin et al. (2007). Laminar location was initially estimated from the position of the electrode and confirmed post hoc by morphological reconstruction as described previously (Cardin et al., 2007).
Visual stimulation.
The corneas were protected with contact lenses after dilating the pupils with 1% ophthalmic atropine and retracting the nictitating membranes with phenylephrine (Neosynephrine). Spectacle lenses were chosen by the tapetal reflection technique to optimize the focus of stimuli on the retina. The position of the monitor was adjusted with an x–y stage so that the area centralae were centered on the screen.
Stimuli were presented on an Image Systems model M09LV monochrome monitor operating at 125 frames per second at a spatial resolution of 1024 × 786 pixels and a mean luminance of 47 cd/m2. Custom software allowed for stimulus control, on-line displays of acquired signals (Vm and spikes), and a graphical user interface for controlling all stimulus parameters. In addition to this on-line control, all data were stored on a Nicolet Vision (LDS) for off-line analyses. Vm and stimulus marks were sampled at 10 kHz with 16 bit analog-to-digital converters. Computer-assisted hand-plotting routines were used with every cell to provide initial estimates of the optimal orientation and spatial and temporal frequencies, and to determine the receptive field dimensions. Tuning curves for orientation and spatial frequency were determined on-line with a series of drifting sinusoidal gratings spanning the initial estimates. The resolution of the orientation measurement was 22.5° for broadly tuned cells and, more often, 5° for narrowly tuned cells.
Cells were classified as simple or complex based on two criteria. First, the relative modulation of spike trains evoked by an optimized patch of drifting sinusoidal grating was measured. If the response at the fundamental temporal frequency of the stimulus exceeded the average (DC) response, the cell was classified as simple. Otherwise, the cell was classified as complex. Second, we estimated the one-dimensional spatiotemporal weighting function (see Fig. 1). Cells exhibiting nonoverlapping regions excited by bright and dark stimuli were classified as simple. Cells showing excitation to bright and dark stimuli throughout their receptive fields were classified as complex. These two measures yielded the same functional classification in every case.
Figure 1.

Comparison of one-dimensional and two-dimensional receptive field maps. The receptive field of this simple layer 4 regular-spiking cell was first mapped using a Gaussian-filtered noise stimulus, which generated a detailed two-dimensional map (left). The receptive field was then mapped by presenting individual optimally oriented bright and dark bars in 16 positions covering the same area of visual space, generating the corresponding one-dimensional map (right). The two sets of stimulus responses identified the same set of receptive field subregions, indicating good correspondence between the one- and two-dimensional maps.
Flashed bar stimuli.
We first measured the orientation tuning curve of each cell by presenting a series of oriented drifting gratings at the optimal spatial frequency, as described previously (Cardin et al., 2007). We then mapped the receptive field of the cell with a Gaussian-filtered-noise movie (SD of filter, 0.82 pixels) (Niell and Stryker, 2008). We then estimated the one-dimensional spatiotemporal weighting function by averaging the membrane potential and spike responses to bright and dark bars (n = 16) of 128 ms duration distributed across the receptive field at the optimal orientation. The one- and two-dimensional receptive field maps agreed in each case (see Fig. 1). We chose two receptive field locations in which to present paired flashed bar stimuli. For simple cells, the two locations were always in separate subregions of the receptive field. For complex cells, the locations were chosen to be as far apart as possible while still evoking strong responses. Pairs of locations whose response latencies did not match were not used so that at an interstimulus interval (ISI) of 0 ms, the two evoked responses always coincided. Test stimuli were bars of 90% or −90% contrast, flashed for 16 ms in each selected location, presented independently (A or B), and interstimulus intervals determined by integral multiple of the display frame rate (A plus B; −8, 0, 8, 16, 24, 32, and 40 ms). A minimum of 30 trials was presented for each stimulus condition, and all stimulus conditions were randomly interleaved throughout the experiment. In a subset of cells, lidocaine N-ethyl bromide (QX-314) was included in the pipette, and the flashed bar stimuli were presented while holding the cell briefly at various membrane potentials.
Measurements.
Timing of the spike threshold was determined from the peak of the second derivative of the spike waveform. For membrane potential measurements, spikes were removed by first determining the time at which spike threshold was reached and then extrapolating the membrane potential values from that point to when the spike repolarized back to the spike threshold level. This was followed by smoothing with a three-point running average. Measurements of the peak amplitude and timing of Vm responses were made after subtracting spikes from traces and averaging the responses across all trials. For each cell, measurements were restricted to a window defined by the onset of the response to flashed stimuli at an ISI of 0 ms and the end of the responses to A and B presented independently (see Fig. 2). The dV/dt was measured from the first 5 ms of the averaged Vm response. Mean instantaneous firing rate and number of spikes were measured for each trial, and the timing of the spike response was measured as the median spike latency across all trials. Precision of spike timing was calculated as the interquartile range of the time of the first evoked spike in each trial. For both Vm and spikes, the responses to individual flashed bars A and B were used to predict the response to paired bars (A plus B), assuming algebraic summation.
Figure 2.

Temporally coincident stimuli in the receptive field evoke supralinear spike output and changes in spike timing. A, Optimally oriented bright and dark bars were flashed (128 ms) in 16 positions across the receptive field of a layer 4 simple cell, generating a one-dimensional map. Bar positions A and B were chosen as sites in two discrete receptive field subregions that evoked strong bright and dark responses, respectively. B, Bars A and B each evoked spike output when briefly presented alone (16 ms), but evoked more spikes with a narrower temporal distribution when presented simultaneously. Each example is generated from 10 overlaid traces. C, PSTHs from 30 presentations of A and B alone. D, PSTHs of recorded responses to 30 presentations of A and B together presented at varying interstimulus intervals (black) were compared to predicted PSTHs calculated as the linear sum of the responses to A and B alone (gray). The summed responses were measured within a window bounded by the beginning of the response at an ISI of 0 ms and the end of the responses to A and B alone (dashed line). E, Distributions of the first spike evoked by each of 30 presentations of A and B as a function of their temporal asynchrony.
Conductance estimates.
All conductance calculations were performed on data obtained using QX-314, which eliminates fast sodium spikes, in the pipette. For each pair of bar stimuli, the bars were presented separately and at varying interstimulus intervals while holding the cell at 4 or 5 Vm levels with brief somatic current pulses. Visual stimulus conditions and Vm levels were randomly interleaved. Only data sets with stable baseline Vm activity were included. Conductance onset was measured from the first derivative of the estimated conductance curve.
The total membrane conductance at each point during a postsynaptic potential (PSP) was calculated as follows (Higley and Contreras, 2006): Cm ∗ dVm/dt = − gT(Vm − Vrev) + Iinj, where Cm is the cell's membrane capacitance, calculated by measuring the time constant from short hyperpolarizing current pulses, gT is the total membrane conductance, Vrev is the weighted combined reversal potential of all membrane conductances, and Iinj is the injected current. This equation can be rewritten as Vm = 1/gT ∗ (Iinj − Icap) + Vrev, where Vm is a linear function of the injected current, corrected for the capacitative current (Icap = Cm ∗ dVm/dt). Evoking a synaptic response while holding the cell at multiple Vm levels with varying Iinj gives a voltage–current (V–I) plot where the inverse slope of the best line fit is gT. Subtracting the gT calculated during a preceding baseline period (resting leak conductance) from the gT calculated during the synaptic response gives a measure of the total evoked synaptic conductance, gsyn. The following simplification can be used to estimate the contributions of excitatory and inhibitory conductances to the total gsyn: Isyn = gE(Vm − VE) + gI(Vm − VI), where Isyn is the total synaptic current, gE and gI are the total excitatory and inhibitory conductances, respectively, and VE and VI are the reversal potentials for excitation and inhibition, respectively. At the synaptic reversal potential (Vrev), Isyn = 0, giving 0 = gE(Vrev − VE) + gI(Vrev − VI). If gsyn = gE + gI, then gI = gsyn(VE − Vrev)/(VE − VI) gE = gsyn(VI − Vrev)/(VE − VI). Vrev was then calculated as the Y value of the intersection of the V–I plot made at baseline with the V–I plot made at each point in the synaptic response. VE and VI were set at 0 mV and −80 mV, respectively.
Results
Temporal sensitivity in layer 4
After first measuring the optimal orientation (see Materials and Methods), we used optimally oriented individual flashed bars (128 ms duration) to map the receptive field of each cell. Across the population of cells, the resulting one-dimensional line weighting function (Movshon et al., 1978; Palmer and Davis, 1981; Jones and Palmer, 1987) corresponded well to the two-dimensional map of the receptive field (Fig. 1). The layer 4 simple cell shown in Figure 2 illustrates the spike output evoked by the flashed bar stimuli, shown as peristimulus time histograms (PSTHs) of spike responses in each portion of the receptive field (Fig. 2A).
Two test bar positions were chosen in separate receptive field subregions, one bright (bar A) and one dark responsive (bar B), thus activating nonoverlapping pools of thalamic afferents (Hubel and Wiesel, 1962; Reid and Alonso, 1995; Usrey et al., 2000; Alonso et al., 2001) (Fig. 2A). We then presented bars A and B individually and at varying ISIs. Each test bar presentation (16 ms duration) evoked a robust synaptic and spike response when presented alone (Fig. 2B), as shown by the PSTHs of responses to 30 stimulus presentations (Fig. 2C). The responses to bars A and B alone were used to generate a predicted linear output in response to paired bars (A plus B) at ISIs of 0 to 40 ms. Spike count and firing rate were measured within a narrow window (Fig. 2D) (see Materials and Methods). The observed responses of the cell differed from the linear predictions in two primary ways (Fig. 2D). First, temporally coincident stimuli (ISIs, ≤16 ms) evoked more spikes than expected. Second, the response to the paired bars occurred earlier than expected. In addition to the supralinear spike output and change in response timing, coincident stimuli also evoked increased spike precision, as measured by the timing of the first evoked spike in each trial (Fig. 2E). Data from an additional layer 4 simple cell is shown in supplemental Figure 1 (available at www.jneurosci.org as supplemental material).
Population averages from layer 4 (n = 19) (Fig. 3) showed that temporally coincident flashed bar stimuli at ISIs of ≤16 ms evoked a significantly supralinear spike output, both in number of spikes per trial (Fig. 3A) and instantaneous firing rate (Fig. 3B) (one sample t test; p < 0.001 at ISIs of −8, 0, and 8 ms; p < 0.05 at ISI of 16 ms). Within that same time window, coincident stimuli also evoked a significant decrease in the median spike latency (Fig. 3C) (p < 0.001 at ISIs of −8, 0, and 8 ms). The latency to the first evoked spike in each trial decreased from 51.8 ± 2.4 in response to A or B alone to 46.1 ± 1.8 at an ISI of 0 ms (p < 0.01). In addition, the precision of the timing of the first evoked spike in each trial was significantly increased at short ISIs (Fig. 3D) (p < 0.001 at an ISI of 0 ms; p < 0.05 at ISIs of −8 or 8 ms). At intervals >16 ms, summation of spike output was consistently linear. These findings were consistent, even when the order of stimulus presentation was changed (ISI, −8 ms). Furthermore, the supralinearity of summation in response to flashed bar pairs was consistent, regardless of the spatial separation of the bars in the receptive field (supplemental Fig. 2, available at www.jneurosci.org as supplemental material). Our findings were not altered by the use of intracellular recording techniques, as extracellular recordings of regular-spiking layer 4 simple cells demonstrated similar results (n = 28) (supplemental Fig. 3, available at www.jneurosci.org as supplemental material). In addition to the population of simple cells described above, five layer 4 complex cells showed similarly nonlinear responses to coincident input (data not shown). Increasing effective stimulus strength by increasing the contrast of individual bars did not result in supralinear spike output (supplemental Fig. 4, available at www.jneurosci.org as supplemental material), suggesting that the nonlinear summation is specific to temporal integration. In summary, we observed that synchronous inputs from nonoverlapping pools of thalamic cells consistently resulted in supralinear response summation, an increase in spike precision, and an advance in the overall timing of the response.
Figure 3.

Temporally coincident stimuli result in nonlinear summation of spike responses in layer 4. A, For each cell (n = 19 layer 4 simple cells), the number of spikes on each stimulus trial was compared to the expected spikes per trial, assuming linear summation. Within an ISI of 0 to 16 ms, coincident stimuli evoked significantly more spikes per trial than expected. Beyond 16 ms, responses to paired stimuli were linear. B, Similarly, the mean instantaneous firing rate was significantly supralinear within the same 16 ms time window. C, Median spike latency was significantly advanced in response to stimuli at short intervals. D, Precision of the timing of the first evoked spike on each trial, measured as the median interquartile range of spike times (IQR), was significantly increased at short interstimulus intervals. Dashed lines indicate mean precision in response to A and B alone. Error bars indicate SEM. *p < 0.05; **p < 0.01.
We next explored the summation of inputs at the subthreshold level. The Vm responses of an example layer 4 simple cell to the flashed bar stimuli are shown in Figure 4. The responses to bars A and B alone (Fig. 3A) were used to calculate predicted Vm responses to paired stimuli (A plus B), assuming linear summation (Fig. 4B). Paired bar stimuli evoked a sublinear Vm response when the ISI was <16 ms, but the Vm response to A plus B at an ISI of 0 ms was larger than that to either A or B alone (Fig. 4C). The membrane potential trajectory in response to bar pairs with ISIs of <16 ms was of greater velocity (dVm/dt) than expected from the linear prediction (Fig. 4D).
Figure 4.

Sublinear summation of synaptic potentials underlying supralinear spike output. A, Membrane potential responses to bars A and B in an example layer 4 simple cell. Spikes have been removed. B, Average PSPs in response to A and B together at varying intervals (black) compared to the predicted responses calculated as the linear sum of the responses to A and B alone (dashed). At short intervals, the observed responses were smaller in amplitude than the expected responses and were advanced in time. C, Expanded traces of the observed responses to A and B individually and A and B together at an ISI of 0 ms are shown with the linear prediction of A and B (dashed). The response to A and B together was larger than the responses to either A or B alone. D, Expanded traces from the box in B of the observed (black) and expected (dashed) responses to A and B together at an ISI of 0 ms. The membrane potential trajectory (dVm/dt) of the observed response was faster than that of the expected response.
These observations were consistent across the population of 19 layer 4 simple cells. The amplitude of the PSP evoked by temporally coincident stimuli (≤16 ms) was significantly sublinear (Wilcoxon signed rank test; p < 0.001 at ISIs of 0 and 8 ms) (Fig. 5A). Like the spike response, the peak of the underlying Vm response to coincident stimuli was advanced in time (p < 0.001 at ISIs of 0 and 8 ms) (Fig. 5B). At short ISIs, the initial evoked dVm/dt was significantly increased (p < 0.01 at an ISI of 0 ms; p < 0.05 at an ISI of 8 ms) (Fig. 5C). In association with the increased dVm/dt, the apparent spike threshold of the first evoked spike in each trial was significantly decreased at short interstimulus intervals (p < 0.001 at ISIs of 0 and 8 ms) (Fig. 5D).
Figure 5.

Coincident stimuli evoke sublinear Vm summation and faster membrane potential trajectory. A, For each cell (n = 19 layer 4 simple cells), average observed Vm responses were compared to expected responses, assuming linear summation. Vm summation was significantly sublinear at short ISIs, and became linear at ISIs of >16 ms (filled circles). This sublinearity is partially attributable to the presence of spikes, as cells recorded with QX-314 demonstrated decreased, but still significantly sublinear, summation (n = 9 layer 4 simple cells; open circles). B, Timing of the peak of the evoked PSP was significantly advanced in responses to paired stimuli at short intervals. C, The dVm/dt of the Vm responses to coincident stimuli within a short window was significantly increased (filled circles). This increase was eliminated in the presence of QX-314 (open circles). The dashed line denotes mean dVm/dt in response to bars A and B presented individually. The dotted line denotes mean dVm/dt in response to A and B in the presence of QX-314. D, Apparent spike threshold of the first evoked spike in each trial was significantly decreased in response to temporally coincident stimuli. Error bars indicate SEM. *p < 0.05; **p < 0.01.
The presence of the sodium channel blocker QX-314 significantly decreased the synaptic response sublinearity at an ISI of 0 ms from 25.4 ± 4.2% to 14.9 ± 3.6%, suggesting that the presence of spike activity contributes to sublinear Vm summation (p < 0.05; n = 9 layer 4 simple cells) (Fig. 5A). However, a significant degree of sublinearity remained, even in the absence of spikes (p < 0.05) (Fig. 5A). One possible explanation for the remaining sublinearity is a reduction in driving force attributable to depolarization (Higley and Contreras 2006). Indeed, we found that the summation of Vm responses was close to linear when accounting for the reduction of driving force and the presence of spikes (supplemental Fig. 5, available at www.jneurosci.org as supplemental material).
To assess the contribution of intrinsic membrane properties to the increased dVm/dt evoked by temporally coincident stimuli, we compared the membrane potential trajectory in the presence and absence of QX-314. QX-314 completely eliminated the observed increase in dVm/dt at short ISIs (p < 0.01) (Fig. 5C). These data suggest that the enhanced impact of temporally coincident inputs is partially caused by increased recruitment of sodium channels.
Restricted window for temporal sensitivity in fast-spiking inhibitory interneurons
Previous work has suggested that the membrane time constant may regulate the length of the window for detection of coincident synaptic inputs (Konig et al., 1996; Shadlen and Newsome, 1998). We therefore tested the hypothesis that layer 4 FS inhibitory interneurons, which have a short membrane time constant (Cardin et al., 2007), exhibit a narrower window for coincidence detection than do RS excitatory neurons. Indeed, fast-spiking (n = 6), putative inhibitory interneurons in layer 4 showed only an 8 ms window for nonlinear synaptic (Fig. 6A) and spike (Fig. 6B) summation, significantly narrower than the window of layer 4 RS (n = 11), putative excitatory neurons (p < 0.05 in both cases). In response to both individual and paired flashed bars, FS cells exhibited faster dVm/dt than did RS cells (p < 0.01; two-way ANOVA with Bonferroni's post tests). However, FS cells showed increased dVm/dt only in response to synchronous inputs at an ISI of 0 ms, whereas RS cells showed dVm/dt increases in response to inputs at ISIs of ≤16 ms (p < 0.05) (Fig. 6C). Underlying these differences in the window for coincidence detection was a corresponding difference in the membrane time constant. RS cells had a mean time constant of 7.2 ± 1.0 ms, whereas FS cells had a mean time constant of 4.9 ± 0.8 ms (p < 0.05). These results suggest that nonlinear summation mechanisms in layer 4 FS cells are engaged only by very synchronous inputs, whereas layer 4 RS cells are sensitive to a broader range of temporal patterns.
Figure 6.

Fast-spiking inhibitory interneurons have a shorter window for temporal sensitivity. The population of layer 4 simple cells was divided into RS, putative excitatory neurons and FS, putative inhibitory interneurons. A, In both cell types, coincident inputs at an ISI of 0 ms evoked a sublinear summation of Vm responses. However, summation in FS cells returned to linearity at all other interstimulus intervals, whereas RS cells showed significant nonlinearity in response to all inputs at ≤16 ms intervals. B, Similarly, FS cells showed a much narrower window for supralinear summation of spike responses. FS cells demonstrated supralinear summation of spike responses only at very short ISIs, whereas RS cells showed supralinearity over a much wider range. Single asterisks denote significant difference between the degree of nonlinearity between RS and FS cell responses at each time interval (p < 0.05). C, FS cells showed an increase in dVm/dt only in response to paired bars at an ISI of 0 ms, whereas RS cells showed increases in dVm/dt at ISIs of ≤16 ms. Dotted and dashed lines indicate FS and RS dVm/dt values in response to single flashed bars, respectively. Error bars indicate SEM.
Cellular mechanisms of nonlinear summation and response timing
To further explore the cellular processes underlying temporal sensitivity, we estimated the synaptic conductances underlying the responses to each set of flashed bars (see Materials and Methods) (supplemental Fig. 6, available at www.jneurosci.org as supplemental material). Flashed bar stimuli in excitatory receptive field subregions evoked a characteristic series of conductances underlying robust membrane potential and spike responses (supplemental Fig. 7, available at www.jneurosci.org as supplemental material). As observed in other cortical areas in response to brief sensory stimuli (Wehr and Zador, 2003; Wilent and Contreras, 2005a; Higley and Contreras, 2006), individual flashed bars of appropriate contrast evoked a characteristic conductance response, with initial excitatory conductances (gE) rapidly overtaken by inhibitory conductances (gI) (Fig. 7A; supplemental Fig. 7, available at www.jneurosci.org as supplemental material), as reflected by a decrease in input resistance and changes in reversal potential (Fig. 7C). The responses to the individual bars were used to predict the excitatory and inhibitory conductances expected in response to paired bars, assuming linear summation of inputs.
Figure 7.

Visual stimulus synchrony changes the relative timing of evoked excitatory and inhibitory conductances. A, Estimates of the excitatory (green) and inhibitory (black) conductances underlying the Vm responses to bars A and B alone. These data were acquired using QX-314 in the pipette. B, Estimates of the excitatory and inhibitory conductances evoked by A and B together at an ISI of 0 ms (solid lines) and predicted conductances, assuming linear summation of the responses to A and B alone. Squares represent the time of the peak of each conductance. The onset and peak of the observed excitatory, but not inhibitory, conductance occurred earlier than predicted, as shown by the vertical arrows. This generated a prolonged period of excitatory dominance before the onset of the subsequent inhibition. C, Reversal potential (black) and input resistance (gray) during the Vm response (blue) of this cell to A and B together at an ISI of 0 ms. D, Excitation–inhibition (E–I) delay, measured as the time between the peaks of the excitatory and inhibitory conductances, was significantly longer at ISIs of 0 and 8 ms than in response to A or B alone. At longer ISIs, the E–I delay decreased to baseline levels. Error bars indicate SEM. *p < 0.05; **p < 0.01.
We calculated the delay between the peaks of the excitatory and inhibitory conductances (E–I delay) during each stimulus condition for a population of layer 4 simple cells (n = 11). The excitatory conductance evoked by simultaneous stimuli peaked earlier than expected, resulting in an extended window between excitation and inhibition (Fig. 7B). The E–I peak delay was significantly longer in response to bar pairs at short intervals (ISI of 0, p < 0.01; ISI of 8 ms, p < 0.05) than in response to individual bars, but at longer intervals the E–I delay was similar to that evoked by individual flashed bars (Fig. 7D). Neither the excitatory nor inhibitory conductance peak magnitude in response to presentation of bars A and B at an ISI of 0 ms differed significantly from the predicted magnitude (n = 11 layer 4 simple cells; p > 0.05 for gE and gI; Mann–Whitney test), suggesting a linear summation of conductance amplitudes. Similarly, the onsets of the excitatory and inhibitory conductances did not differ from the predicted times (mean difference from predicted time: gE, −0.3 ± 1.5 ms; gI, 0.4 ± 1.3 ms; p > 0.05 in both cases). However, the time from onset to the peak of gE was significantly shorter than expected (−2.5 ± 0.4 ms; Wilcoxon signed rank test; p < 0.01), whereas the time to peak of gI was unchanged (0.1 ± 0.3 ms; p > 0.05). Together, these data suggest that the extended window between the peaks of gE and gI results from a faster rate of rise of gE in response to coincident inputs.
Comparison across cortical layers
Together, these results reveal a powerful set of cellular mechanisms for the temporal sensitivity of cells in layer 4, the major site of thalamocortical input. However, little is known about temporal processing in downstream cortical layers. We therefore compared synaptic integration across layers (n = 19 layer 4 cells, 16 layer 2/3 cells, 25 layer 5/6 cells) to determine whether this form of nonlinear integration is a feature specific to layer 4 or common to all cortical circuits.
There were no differences in the response amplitude to individual flashed bars across cortical layers (p > 0.05; two-way ANOVA with Bonferroni's post tests). However, we found significant differences in the temporal sensitivity of spike output across layers (p < 0.01) (Fig. 8A). Layer 2/3 cells demonstrated only a small supralinearity of the spike response to temporally coincident stimuli, whereas cells in layer 5/6 showed linear summation regardless of stimulus interval. At ISIs between −8 and 8 ms, the supralinearity of spike output in layer 4 was significantly greater than in layers 2/3 (p < 0.05) and 5/6 (p < 0.01). Similarly, at short ISIs, the supralinearity of layer 2/3 responses was greater than those in layer 5/6 (p < 0.05). The timing of responses to paired stimuli was also significantly different across the layers (p < 0.001), with slightly advanced responses at short intervals in both layers 2/3 and 5/6 compared to the large shift in response timing in layer 4 (Fig. 8B). At ISIs between −8 and 8 ms, the advance in response timing in layer 4 was significantly greater than in layer 2/3 (p < 0.05) or layer 5/6 (p < 0.001). There was no significant difference between the advances in timing in layers 2/3 and 5/6 at ISIs between −8 and 8 ms (p < 0.05). The precision of spike timing of each of the three populations was also significantly different (p < 0.001) (Fig. 8C). At an ISI of 0 ms, layer 4 cells showed significantly greater precision than layer 2/3 (p < 0.01) or layer 5/6 cells (p < 0.05). Cells in layer 5/6 demonstrated significantly higher spike-timing precision than cells in layer 2/3 (p < 0.05), likely as a result of the inclusion of thalamorecipient cells in layer 6. Overall, these data suggest that layer 4 is specialized for detecting and encoding the temporal pattern of synaptic inputs and that this feature is reduced or absent in successive downstream cortical layers.
Figure 8.
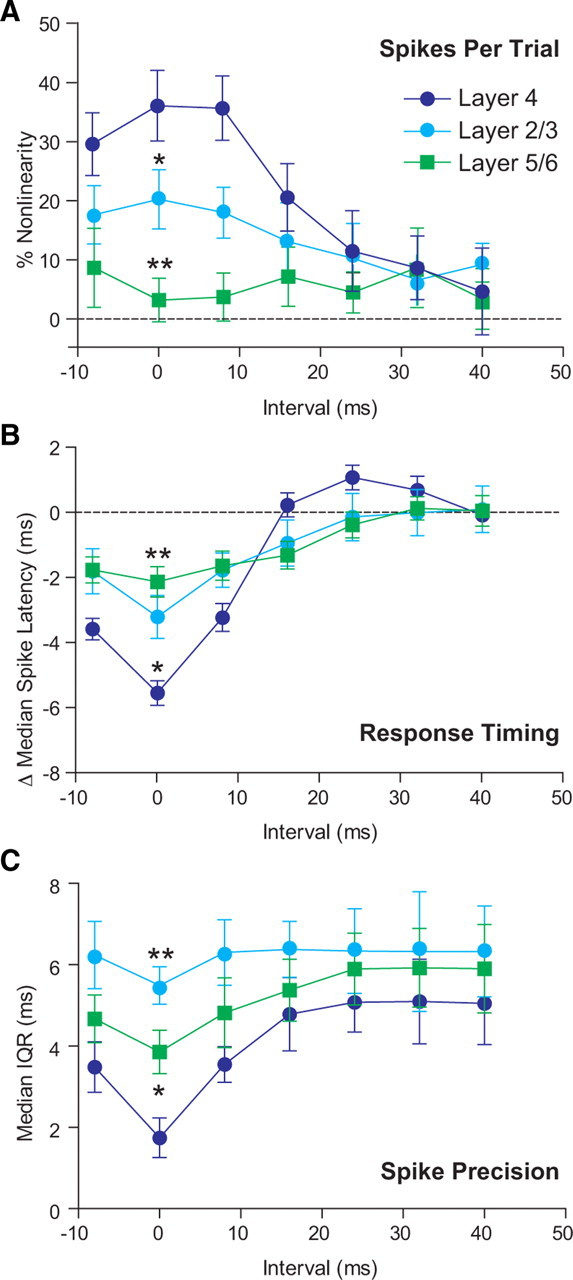
Sensitivity to coincident inputs decreases in downstream cortical layers. A, Layer 4 cells (dark blue) showed the largest spike output supralinearity in response to coincident stimuli. Layer 2/3 cells (light blue) showed less summation nonlinearity, and layer 5/6 cell (green) responses summed linearly regardless of stimulus timing. B, Similarly, the shift in timing of the spike response to coincident stimuli was most advanced in layer 4, and much less so in downstream layers. C, Precision of the timing of the first evoked spike in layer 4 cells was significantly increased in response to coincident stimuli, but less so in layers 2/3 or 5/6. Overall, spike precision was greatest in layer 4, and least in layer 2/3. In each case, statistical significance is shown here only for comparisons between layer 4 and downstream layers at an ISI of 0 ms. *p < 0.05; **p < 0.01.
Discussion
Temporal sensitivity in cortical neurons
Previous work has suggested that cortical neurons can accurately encode the temporal pattern of their inputs (Mainen and Sejnowski, 1995; Konig et al., 1996; Galarreta and Hestrin, 2001), but little is known about mechanisms underlying the ability of cortical neurons to detect the precise timing of sensory-evoked inputs under the characteristically active network conditions observed in vivo. The highly active state of cortical networks in vivo profoundly changes neuronal integration properties on a moment-to-moment basis (Bernander et al., 1991; Destexhe and Pare, 1999; Cardin et al., 2007, 2008). The presence of background synaptic noise like that observed in visual cortex cells in vivo (Anderson et al., 2000; Cardin et al., 2008) may lead to faster neural responses and enhanced temporal discrimination (Rudolph and Destexhe, 2003; Zsiros and Hestrin, 2005; Prescott et al., 2006), suggesting that the level and pattern of network synaptic input tunes the sensitivity of cortical neurons to coincident inputs. Indeed, previous work using computational models has found that the degree of synchrony between synaptic inputs may shift cortical neurons along a spectrum of behavior from integration to coincidence detection (Bernander et al., 1991; Abeles et al., 1993; Softky and Koch, 1993; Rudolph and Destexhe, 2003; Prescott et al., 2006). Synchronization of activity across the cortical network varies with sensory context (Castelo-Branco et al., 2000; Kohn and Smith, 2005; Poulet and Petersen, 2008) and behavioral state (Steriade et al., 1996; Destexhe et al., 1999; Steriade et al., 2001), and contributes to visual processing (Gray and Singer, 1989; Vaadia et al., 1995; Singer, 1999; Steinmetz et al., 2000).
Our data indicate that thalamorecipient neurons at the first stage of visual cortical processing are highly sensitive to synchronous inputs generated by pairs of stimuli in the receptive field. We found that temporally coincident visual stimuli evoked an increase in both the precision of the timing of the first evoked spike and the overall magnitude of the spike response. The length of the window for detection of coincident inputs was similar for both intracellular and extracellular recordings (<16 ms), and was of the same general magnitude as those suggested previously by extracellular recordings in the visual [7 ms (Alonso et al., 1996), 8 ms (Kumbhani et al., 2007)] and somatosensory [6–8 ms (Roy and Alloway, 2001)] systems. Previous recordings in the somatosensory system have similarly suggested that synchronous inputs to barrel cortex exhibit a high degree of efficacy (Pinto et al., 2000; Bruno and Sakmann, 2006).
Layer 4 fast-spiking, putative inhibitory interneurons showed a significantly shorter window for coincidence detection than did layer 4 regular-spiking, putative excitatory cells. These findings agree well with previous observations that FS cells exhibit a high degree of temporal response fidelity to their synaptic inputs (Galarreta and Hestrin, 2001). In addition, our data suggest that the pattern of incoming temporal information is represented differently in the spike trains of layer 4 excitatory and inhibitory neurons. Because interneurons show a very limited window for supralinear summation, incoming near-synchronous synaptic events may recruit a robust excitatory cell response and less feedforward inhibition. The limited window for supralinear summation by interneurons may restrict the dynamic range of feedforward inhibition evoked by synchronous activity. Underlying this difference in temporal sensitivity was a significant difference in the membrane time constant of the two cell populations (Cardin et al., 2007), highlighting the importance of the time constant in placing biophysical constraints on the initial window for detection and integration of coincident synaptic events (Konig et al., 1995; Koch et al., 1996; Shadlen and Newsome, 1998). However, biophysical membrane properties are not the sole determinant of the window for synaptic integration. Previous work has shown that the critical window for sensory input integration in somatosensory and auditory cortex is limited at 5–7 ms by powerful feedforward inhibition (Wehr and Zador, 2003; Wilent and Contreras, 2004, 2005a; Higley and Contreras, 2006). Our current results suggest a similar excitatory–inhibitory interaction in visual cortex neurons, although a complete examination is beyond the scope of this study.
Integration of synchronous visually evoked inputs varied significantly across cortical layers. In contrast to the striking supralinearity and increase in temporal precision of layer 4 responses, the responses of cells in layers 2/3 and 5/6 were more linear and showed little enhancement of spike precision. Our 8 ms temporal resolution precluded us from quantifying the precise nature of the relationship between response latency and temporal sensitivity across layers. It is possible that spike-timing precision may be affected by anesthesia state. However, response amplitudes were consistent across layers, suggesting a lack of any layer-specific effect of anesthesia. Overall, our data suggest that the temporal sensitivity observed here contributes significantly to information processing in layer 4, but may not play a functional role in downstream cortical layers.
Cellular mechanisms underlying nonlinear summation of coincident inputs
We observed two fundamental cellular mechanisms underlying the nonlinear summation of coincident synaptic inputs to layer 4 neurons. First, we found that temporally coincident inputs were associated with increases in the rate of rise of the evoked excitatory conductance. This faster increase in excitation resulted in enhanced recruitment of fast sodium channels, which are distributed throughout the soma and dendrites of cortical neurons (Schwindt and Crill, 1995; Mittmann et al., 1997). The downstream impact of this quicker gE trajectory was seen in the increase in dVm/dt in the membrane potential response, which was sensitive to sodium channel blockade, and the consequent lowering of apparent spike threshold (Nowak et al., 1997; Azouz and Gray, 2000; Wilent and Contreras, 2005b). Previous work has shown that increasing the speed of the dVm/dt contributes to increased precision of spike timing (Fetz and Gustafsson, 1983; Fricker and Miles, 2000; Harsch and Robinson, 2000; Axmacher and Miles, 2004), suggesting that the faster gE rise and associated increase in dVm/dt underlie the observed increase in precision of the first spike evoked by coincident inputs. These results are in agreement with earlier predictions of the existence of cortical mechanisms to maintain the level of precision inherent in thalamic inputs (Kumbhani et al., 2007). Studies of information content in cortical spike trains indicate that the timing of sensory-evoked spikes contains significant information (Mechler et al., 1998; Petersen et al., 2001, 2002; Reich et al., 2001), suggesting that the regulation of spike precision observed here may play a key role in encoding the time course of compound visual events.
Second, we found that the faster rise caused gE to peak earlier than expected, resulting in a longer window between the peaks of gE and gI. Our results suggest that the supralinear spike output in response to coincident sensory inputs is generated by an extended period of excitation-driven spiking before inhibition becomes dominant. A similar increase in the period of excitatory dominance contributes to direction tuning in somatosensory cortical neurons (Wilent and Contreras, 2005a). The earlier peak in gE and the associated increase in dVm/dt and lowering of the spike threshold likely contribute to the overall advance in timing of the spike response to coincident inputs.
Our findings suggest a cortical origin for the increases in both spike precision and response magnitude. The increase in the rate of membrane depolarization was blocked intracellularly by QX-314, indicating that the underlying mechanism is intrinsic to the cortical cell. Furthermore, if the shift in response timing and magnitude were attributable to a nonlinear change in thalamic input, we would expect the onset time of the evoked excitatory conductances to be affected. However, we observed that the onset times of gE and gI were the same for both the individual and paired sensory inputs. Similarly, if the supralinear output was the result of nonlinear enhancement of the magnitude of thalamocortical inputs, we would expect the underlying excitatory conductances to sum nonlinearly. Instead, we found that the excitatory conductance amplitudes summed linearly, indicating no change in the magnitudes of the thalamic inputs evoked by the flashed bars.
Conclusions
In vitro studies have identified a number of cellular mechanisms for detection of temporally coincident synaptic inputs that may operate at varying temporal and spatial scales, including local coincidence detection within active dendrites (Softky, 1994; Golding et al., 2002; Williams and Stuart, 2002; Schmidt-Hieber et al., 2007) and interactions between EPSPs and backpropagating action potentials (Higley and Sabatini, 2008; Spruston, 2008). In addition, dendritic branching patterns contribute to the expression of coincidence detection (Schaefer et al., 2003), suggesting that morphological differences may play a role in the variation in temporal sensitivity we observed between cells in layer 4 and downstream layers. Although these mechanisms may contribute to the results observed here, a detailed investigation is beyond the scope of this study.
Our results demonstrate a powerful set of mechanisms for the detection and encoding of the temporal pattern of sensory-evoked synaptic inputs to visual cortex neurons. This temporal sensitivity is mostly specific to layer 4, suggesting that a global property of these cells is to encode the temporal characteristics of the ongoing stream of sensory input (Wehr and Zador, 2003; Higley and Contreras, 2006). The differing windows of temporal sensitivity in excitatory and inhibitory neurons may confer computational flexibility to local network interactions driven by sensory stimulation.
By virtue of their biophysical properties and synaptic position in the cortical network, layer 4 neurons are optimized for the detection of synchronous inputs, especially under phasic stimulus conditions such as those at the end of saccadic eye movements. This temporal sensitivity may contribute to perceptual acuity. Indeed, previous work has found that the human visual system can make use of small timing differences in stimuli, on the order of 3–10 ms, for spatial (Georgeson and Georgeson, 1985) and temporal (Westheimer, 1983) discrimination and for figure–ground segregation (Fahle, 1993). However, the interpretation of this temporal detection signal by downstream stages of cortical processing remains to be explored.
Footnotes
This work was supported by National Institutes of Health–National Eye Institute Grants R01 EY013984 (D.C.), R01 EY016430 (L.A.P.), F32 EY017501 (J.A.C.), and K99 EY018407 (J.A.C.). We thank M. J. Higley for helpful discussions and comments on this manuscript.
References
- Abeles M, Bergman H, Margalit E, Vaadia E. Spatiotemporal firing patterns in the frontal cortex of behaving monkeys. J Neurophysiol. 1993;70:1629–1638. doi: 10.1152/jn.1993.70.4.1629. [DOI] [PubMed] [Google Scholar]
- Alonso JM, Usrey WM, Reid RC. Precisely correlated firing in cells of the lateral geniculate nucleus. Nature. 1996;383:815–819. doi: 10.1038/383815a0. [DOI] [PubMed] [Google Scholar]
- Alonso JM, Usrey WM, Reid RC. Rules of connectivity between geniculate cells and simple cells in cat primary visual cortex. J Neurosci. 2001;21:4002–4015. doi: 10.1523/JNEUROSCI.21-11-04002.2001. [DOI] [PMC free article] [PubMed] [Google Scholar]
- Anderson JS, Carandini M, Ferster D. Orientation tuning of input conductance, excitation, and inhibition in cat primary visual cortex. J Neurophysiol. 2000;84:909–926. doi: 10.1152/jn.2000.84.2.909. [DOI] [PubMed] [Google Scholar]
- Axmacher N, Miles R. Intrinsic cellular currents and the temporal precision of EPSP-action potential coupling in CA1 pyramidal cells. J Physiol. 2004;555:713–725. doi: 10.1113/jphysiol.2003.052225. [DOI] [PMC free article] [PubMed] [Google Scholar]
- Azouz R, Gray CM. Dynamic spike threshold reveals a mechanism for synaptic coincidence detection in cortical neurons in vivo. Proc Natl Acad Sci U S A. 2000;97:8110–8115. doi: 10.1073/pnas.130200797. [DOI] [PMC free article] [PubMed] [Google Scholar]
- Bernander O, Douglas RJ, Martin KA, Koch C. Synaptic background activity influences spatiotemporal integration in single pyramidal cells. Proc Natl Acad Sci U S A. 1991;88:11569–11573. doi: 10.1073/pnas.88.24.11569. [DOI] [PMC free article] [PubMed] [Google Scholar]
- Bruno RM, Sakmann B. Cortex is driven by weak but synchronously active thalamocortical synapses. Science. 2006;312:1622–1627. doi: 10.1126/science.1124593. [DOI] [PubMed] [Google Scholar]
- Cardin JA, Palmer LA, Contreras D. Stimulus feature selectivity in excitatory and inhibitory neurons in primary visual cortex. J Neurosci. 2007;27:10333–10344. doi: 10.1523/JNEUROSCI.1692-07.2007. [DOI] [PMC free article] [PubMed] [Google Scholar]
- Cardin JA, Palmer LA, Contreras D. Cellular mechanisms underlying stimulus-dependent gain modulation in primary visual cortex neurons in vivo. Neuron. 2008;59:150–160. doi: 10.1016/j.neuron.2008.05.002. [DOI] [PMC free article] [PubMed] [Google Scholar]
- Castelo-Branco M, Neuenschwander S, Singer W. Synchronization of visual responses between the cortex, lateral geniculate nucleus, and retina in the anesthetized cat. J Neurosci. 1998;18:6395–6410. doi: 10.1523/JNEUROSCI.18-16-06395.1998. [DOI] [PMC free article] [PubMed] [Google Scholar]
- Castelo-Branco M, Goebel R, Neuenschwander S, Singer W. Neural synchrony correlates with surface segregation rules. Nature. 2000;405:685–689. doi: 10.1038/35015079. [DOI] [PubMed] [Google Scholar]
- Dan Y, Alonso JM, Usrey WM, Reid RC. Coding of visual information by precisely correlated spikes in the lateral geniculate nucleus. Nat Neurosci. 1998;1:501–507. doi: 10.1038/2217. [DOI] [PubMed] [Google Scholar]
- Destexhe A, Pare D. Impact of network activity on the integrative properties of neocortical pyramidal neurons in vivo. J Neurophysiol. 1999;81:1531–1547. doi: 10.1152/jn.1999.81.4.1531. [DOI] [PubMed] [Google Scholar]
- Destexhe A, Contreras D, Steriade M. Spatiotemporal analysis of local field potentials and unit discharges in cat cerebral cortex during natural wake and sleep states. J Neurosci. 1999;19:4595–4608. doi: 10.1523/JNEUROSCI.19-11-04595.1999. [DOI] [PMC free article] [PubMed] [Google Scholar]
- Fahle M. Figure-ground discrimination from temporal information. Proc Biol Sci. 1993;254:199–203. doi: 10.1098/rspb.1993.0146. [DOI] [PubMed] [Google Scholar]
- Fetz EE, Gustafsson B. Relation between shapes of post-synaptic potentials and changes in firing probability of cat motoneurones. J Physiol. 1983;341:387–410. doi: 10.1113/jphysiol.1983.sp014812. [DOI] [PMC free article] [PubMed] [Google Scholar]
- Fricker D, Miles R. EPSP amplification and the precision of spike timing in hippocampal neurons. Neuron. 2000;28:559–569. doi: 10.1016/s0896-6273(00)00133-1. [DOI] [PubMed] [Google Scholar]
- Fries P, Roelfsema PR, Engel AK, Konig P, Singer W. Synchronization of oscillatory responses in visual cortex correlates with perception in interocular rivalry. Proc Natl Acad Sci U S A. 1997;94:12699–12704. doi: 10.1073/pnas.94.23.12699. [DOI] [PMC free article] [PubMed] [Google Scholar]
- Galarreta M, Hestrin S. Spike transmission and synchrony detection in networks of GABAergic interneurons. Science. 2001;292:2295–2299. doi: 10.1126/science.1061395. [DOI] [PubMed] [Google Scholar]
- Georgeson MA, Georgeson JM. On seeing temporal gaps between gratings: a criterion problem for measurement of visible persistence. Vision Res. 1985;25:1729–1733. doi: 10.1016/0042-6989(85)90145-2. [DOI] [PubMed] [Google Scholar]
- Golding NL, Staff NP, Spruston N. Dendritic spikes as a mechanism for cooperative long-term potentiation. Nature. 2002;418:326–331. doi: 10.1038/nature00854. [DOI] [PubMed] [Google Scholar]
- Gray CM, Singer W. Stimulus-specific neuronal oscillations in orientation columns of cat visual cortex. Proc Natl Acad Sci U S A. 1989;86:1698–1702. doi: 10.1073/pnas.86.5.1698. [DOI] [PMC free article] [PubMed] [Google Scholar]
- Harsch A, Robinson HP. Postsynaptic variability of firing in rat cortical neurons: the roles of input synchronization and synaptic NMDA receptor conductance. J Neurosci. 2000;20:6181–6192. doi: 10.1523/JNEUROSCI.20-16-06181.2000. [DOI] [PMC free article] [PubMed] [Google Scholar]
- Higley MJ, Contreras D. Balanced excitation and inhibition determine spike timing during frequency adaptation. J Neurosci. 2006;26:448–457. doi: 10.1523/JNEUROSCI.3506-05.2006. [DOI] [PMC free article] [PubMed] [Google Scholar]
- Higley MJ, Sabatini BL. Calcium signaling in dendrites and spines: practical and functional considerations. Neuron. 2008;59:902–913. doi: 10.1016/j.neuron.2008.08.020. [DOI] [PubMed] [Google Scholar]
- Hubel DH, Wiesel TN. Receptive fields, binocular interaction and functional architecture in the cat's visual cortex. J Physiol. 1962;160:106–154. doi: 10.1113/jphysiol.1962.sp006837. [DOI] [PMC free article] [PubMed] [Google Scholar]
- Jones JP, Palmer LA. The two-dimensional spatial structure of simple receptive fields in cat striate cortex. J Neurophysiol. 1987;58:1187–1211. doi: 10.1152/jn.1987.58.6.1187. [DOI] [PubMed] [Google Scholar]
- Kara P, Reinagel P, Reid RC. Low response variability in simultaneously recorded retinal, thalamic, and cortical neurons. Neuron. 2000;27:635–646. doi: 10.1016/s0896-6273(00)00072-6. [DOI] [PubMed] [Google Scholar]
- Koch C, Rapp M, Segev I. A brief history of time (constants) Cereb Cortex. 1996;6:93–101. doi: 10.1093/cercor/6.2.93. [DOI] [PubMed] [Google Scholar]
- Kohn A, Smith MA. Stimulus dependence of neuronal correlation in primary visual cortex of the macaque. J Neurosci. 2005;25:3661–3673. doi: 10.1523/JNEUROSCI.5106-04.2005. [DOI] [PMC free article] [PubMed] [Google Scholar]
- Konig P, Engel AK, Singer W. Relation between oscillatory activity and long-range synchronization in cat visual cortex. Proc Natl Acad Sci U S A. 1995;92:290–294. doi: 10.1073/pnas.92.1.290. [DOI] [PMC free article] [PubMed] [Google Scholar]
- Konig P, Engel AK, Singer W. Integrator or coincidence detector? The role of the cortical neuron revisited. Trends Neurosci. 1996;19:130–137. doi: 10.1016/s0166-2236(96)80019-1. [DOI] [PubMed] [Google Scholar]
- Kumbhani RD, Nolt MJ, Palmer LA. Precision, reliability, and information-theoretic analysis of visual thalamocortical neurons. J Neurophysiol. 2007;98:2647–2663. doi: 10.1152/jn.00900.2006. [DOI] [PubMed] [Google Scholar]
- Mainen ZF, Sejnowski TJ. Reliability of spike timing in neocortical neurons. Science. 1995;268:1503–1506. doi: 10.1126/science.7770778. [DOI] [PubMed] [Google Scholar]
- Mechler F, Victor JD, Purpura KP, Shapley R. Robust temporal coding of contrast by V1 neurons for transient but not for steady-state stimuli. J Neurosci. 1998;18:6583–6598. doi: 10.1523/JNEUROSCI.18-16-06583.1998. [DOI] [PMC free article] [PubMed] [Google Scholar]
- Mittmann T, Linton SM, Schwindt P, Crill W. Evidence for persistent Na+ current in apical dendrites of rat neocortical neurons from imaging of Na+-sensitive dye. J Neurophysiol. 1997;78:1188–1192. doi: 10.1152/jn.1997.78.2.1188. [DOI] [PubMed] [Google Scholar]
- Movshon JA, Thompson ID, Tolhurst DJ. Spatial summation in the receptive fields of simple cells in the cat's striate cortex. J Physiol. 1978;283:53–77. doi: 10.1113/jphysiol.1978.sp012488. [DOI] [PMC free article] [PubMed] [Google Scholar]
- Niell CM, Stryker MP. Highly selective receptive fields in mouse visual cortex. J Neurosci. 2008;28:7520–7536. doi: 10.1523/JNEUROSCI.0623-08.2008. [DOI] [PMC free article] [PubMed] [Google Scholar]
- Nowak LG, Sanchez-Vives MV, McCormick DA. Influence of low and high frequency inputs on spike timing in visual cortical neurons. Cereb Cortex. 1997;7:487–501. doi: 10.1093/cercor/7.6.487. [DOI] [PubMed] [Google Scholar]
- Palmer LA, Davis TL. Receptive-field structure in cat striate cortex. J Neurophysiol. 1981;46:260–276. doi: 10.1152/jn.1981.46.2.260. [DOI] [PubMed] [Google Scholar]
- Petersen RS, Panzeri S, Diamond ME. Population coding of stimulus location in rat somatosensory cortex. Neuron. 2001;32:503–514. doi: 10.1016/s0896-6273(01)00481-0. [DOI] [PubMed] [Google Scholar]
- Petersen RS, Panzeri S, Diamond ME. The role of individual spikes and spike patterns in population coding of stimulus location in rat somatosensory cortex. Biosystems. 2002;67:187–193. doi: 10.1016/s0303-2647(02)00076-x. [DOI] [PubMed] [Google Scholar]
- Pinto DJ, Brumberg JC, Simons DJ. Circuit dynamics and coding strategies in rodent somatosensory cortex. J Neurophysiol. 2000;83:1158–1166. doi: 10.1152/jn.2000.83.3.1158. [DOI] [PubMed] [Google Scholar]
- Poulet JF, Petersen CC. Internal brain state regulates membrane potential synchrony in barrel cortex of behaving mice. Nature. 2008;454:881–885. doi: 10.1038/nature07150. [DOI] [PubMed] [Google Scholar]
- Prescott SA, Ratte S, De Koninck Y, Sejnowski TJ. Nonlinear interaction between shunting and adaptation controls a switch between integration and coincidence detection in pyramidal neurons. J Neurosci. 2006;26:9084–9097. doi: 10.1523/JNEUROSCI.1388-06.2006. [DOI] [PMC free article] [PubMed] [Google Scholar]
- Reich DS, Mechler F, Victor JD. Temporal coding of contrast in primary visual cortex: when, what, and why. J Neurophysiol. 2001;85:1039–1050. doi: 10.1152/jn.2001.85.3.1039. [DOI] [PubMed] [Google Scholar]
- Reid RC, Alonso JM. Specificity of monosynaptic connections from thalamus to visual cortex. Nature. 1995;378:281–284. doi: 10.1038/378281a0. [DOI] [PubMed] [Google Scholar]
- Reinagel P, Reid RC. Temporal coding of visual information in the thalamus. J Neurosci. 2000;20:5392–5400. doi: 10.1523/JNEUROSCI.20-14-05392.2000. [DOI] [PMC free article] [PubMed] [Google Scholar]
- Reinagel P, Reid RC. Precise firing events are conserved across neurons. J Neurosci. 2002;22:6837–6841. doi: 10.1523/JNEUROSCI.22-16-06837.2002. [DOI] [PMC free article] [PubMed] [Google Scholar]
- Roy SA, Alloway KD. Coincidence detection or temporal integration?: What the neurons in somatosensory cortex are doing. J Neurosci. 2001;21:2462–2473. doi: 10.1523/JNEUROSCI.21-07-02462.2001. [DOI] [PMC free article] [PubMed] [Google Scholar]
- Rudolph M, Destexhe A. Tuning neocortical pyramidal neurons between integrators and coincidence detectors. J Comput Neurosci. 2003;14:239–251. doi: 10.1023/a:1023245625896. [DOI] [PubMed] [Google Scholar]
- Schaefer AT, Larkum ME, Sakmann B, Roth A. Coincidence detection in pyramidal neurons is tuned by their dendritic branching pattern. J Neurophysiol. 2003;89:3143–3154. doi: 10.1152/jn.00046.2003. [DOI] [PubMed] [Google Scholar]
- Schmidt-Hieber C, Jonas P, Bischofberger J. Subthreshold dendritic signal processing and coincidence detection in dentate gyrus granule cells. J Neurosci. 2007;27:8430–8441. doi: 10.1523/JNEUROSCI.1787-07.2007. [DOI] [PMC free article] [PubMed] [Google Scholar]
- Schwindt PC, Crill WE. Amplification of synaptic current by persistent sodium conductance in apical dendrite of neocortical neurons. J Neurophysiol. 1995;74:2220–2224. doi: 10.1152/jn.1995.74.5.2220. [DOI] [PubMed] [Google Scholar]
- Shadlen MN, Newsome WT. The variable discharge of cortical neurons: implications for connectivity, computation, and information coding. J Neurosci. 1998;18:3870–3896. doi: 10.1523/JNEUROSCI.18-10-03870.1998. [DOI] [PMC free article] [PubMed] [Google Scholar]
- Singer W. Neuronal synchrony: a versatile code for the definition of relations? Neuron. 1999;24:49–65. doi: 10.1016/s0896-6273(00)80821-1. [DOI] [PubMed] [Google Scholar]
- Softky W. Sub-millisecond coincidence detection in active dendritic trees. Neuroscience. 1994;58:13–41. doi: 10.1016/0306-4522(94)90154-6. [DOI] [PubMed] [Google Scholar]
- Softky WR, Koch C. The highly irregular firing of cortical cells is inconsistent with temporal integration of random EPSPs. J Neurosci. 1993;13:334–350. doi: 10.1523/JNEUROSCI.13-01-00334.1993. [DOI] [PMC free article] [PubMed] [Google Scholar]
- Spruston N. Pyramidal neurons: dendritic structure and synaptic integration. Nat Rev Neurosci. 2008;9:206–221. doi: 10.1038/nrn2286. [DOI] [PubMed] [Google Scholar]
- Steinmetz PN, Roy A, Fitzgerald PJ, Hsiao SS, Johnson KO, Niebur E. Attention modulates synchronized neuronal firing in primate somatosensory cortex. Nature. 2000;404:187–190. doi: 10.1038/35004588. [DOI] [PubMed] [Google Scholar]
- Steriade M, Amzica F, Contreras D. Synchronization of fast (30–40 Hz) spontaneous cortical rhythms during brain activation. J Neurosci. 1996;16:392–417. doi: 10.1523/JNEUROSCI.16-01-00392.1996. [DOI] [PMC free article] [PubMed] [Google Scholar]
- Steriade M, Timofeev I, Grenier F. Natural waking and sleep states: a view from inside neocortical neurons. J Neurophysiol. 2001;85:1969–1985. doi: 10.1152/jn.2001.85.5.1969. [DOI] [PubMed] [Google Scholar]
- Swadlow HA, Gusev AG. The impact of ‘bursting’ thalamic impulses at a neocortical synapse. Nat Neurosci. 2001;4:402–408. doi: 10.1038/86054. [DOI] [PubMed] [Google Scholar]
- Usrey WM, Alonso JM, Reid RC. Synaptic interactions between thalamic inputs to simple cells in cat visual cortex. J Neurosci. 2000;20:5461–5467. doi: 10.1523/JNEUROSCI.20-14-05461.2000. [DOI] [PMC free article] [PubMed] [Google Scholar]
- Vaadia E, Haalman I, Abeles M, Bergman H, Prut Y, Slovin H, Aertsen A. Dynamics of neuronal interactions in monkey cortex in relation to behavioural events. Nature. 1995;373:515–518. doi: 10.1038/373515a0. [DOI] [PubMed] [Google Scholar]
- Wehr M, Zador AM. Balanced inhibition underlies tuning and sharpens spike timing in auditory cortex. Nature. 2003;426:442–446. doi: 10.1038/nature02116. [DOI] [PubMed] [Google Scholar]
- Westheimer G. Temporal order detection for foveal and peripheral visual stimuli. Vision Res. 1983;23:759–763. doi: 10.1016/0042-6989(83)90197-9. [DOI] [PubMed] [Google Scholar]
- Wilent WB, Contreras D. Synaptic responses to whisker deflections in rat barrel cortex as a function of cortical layer and stimulus intensity. J Neurosci. 2004;24:3985–3998. doi: 10.1523/JNEUROSCI.5782-03.2004. [DOI] [PMC free article] [PubMed] [Google Scholar]
- Wilent WB, Contreras D. Dynamics of excitation and inhibition underlying stimulus selectivity in rat somatosensory cortex. Nat Neurosci. 2005a;8:1364–1370. doi: 10.1038/nn1545. [DOI] [PubMed] [Google Scholar]
- Wilent WB, Contreras D. Stimulus-dependent changes in spike threshold enhance feature selectivity in rat barrel cortex neurons. J Neurosci. 2005b;25:2983–2991. doi: 10.1523/JNEUROSCI.4906-04.2005. [DOI] [PMC free article] [PubMed] [Google Scholar]
- Williams SR, Stuart GJ. Dependence of EPSP efficacy on synapse location in neocortical pyramidal neurons. Science. 2002;295:1907–1910. doi: 10.1126/science.1067903. [DOI] [PubMed] [Google Scholar]
- Zsiros V, Hestrin S. Background synaptic conductance and precision of EPSP-spike coupling at pyramidal cells. J Neurophysiol. 2005;93:3248–3256. doi: 10.1152/jn.01027.2004. [DOI] [PubMed] [Google Scholar]