Abstract
The mechanical properties of a cell's environment can alter behavior such as migration and spreading, and control the differentiation path of stem cells. Here we describe a technique for fabricating substrates whose rigidity can be controlled locally without altering the contact area for cell spreading. The substrates consist of elastomeric pillar arrays in which the top surface is uniform but the pillar height is changed across a sharp step. Preliminary results demonstrate the effects on cell migration and morphology at the step boundary.
Introduction
Cells generate traction forces in the nanonewton range during adhesion and migration.1–5 They respond to many environmental cues including substrate physical attributes such as geometry, density and stiffness.6 In order to quantify the mechanical interaction of cells with their environment, it is important to control the mechanical properties of the cell’s environment, and measure the forces exerted by the cell.
Previous work has demonstrated the importance of the rigidity of the cell environment in numerous cellular processes, ranging from migration to adhesion and cell differentiation.6–8 It has already been demonstrated that cellular response to rigidity is characteristic of the difference between normal and transformed (cancerous) cells. In addition, Engler et al.7 have shown that the rigidity of the extracellular matrix plays a role in stem cell differentiation, by examining differentiation on substrates whose stiffnesses range from that of brain tissue to that of bone. The complex interplay between the rigidity of the substrate and the cells’ force response is still poorly understood. In order to explore how cells can detect their environments and study the effect of rigidity, a system is needed that can mimic biological stiffness.
To this end, high-density microfabricated arrays of vertical elastomeric posts have been used to both control the rigidity of the substrate and to measure cellular forces. In the linear bending regime, the force exerted by the cell on a single post can be determined by measuring the lateral deflection of the post in an optical microscope. Linear elastic theory of a bending beam gives the force-displacement relationship as:
| (1) |
where E, r, L, Δx are the Young’s modulus, radius, length and the deflection of the post, respectively.9 From Eq. 1 it can readily be seen that the post stiffness is strongly dependent on geometry, and can be modified either by changing the diameter or the height. (Note that Eq. 1 applies to cylindrical beams. Deviations from a perfect cylinder will slightly modify the result.)
A question of primary importance is the behavior of cells at the boundary between regions of substrate with different rigidities. Measurements of cells behavior and force generation in this peculiar state will shed new light on the mechanisms at play in cellular rigidity response. In order to isolate the effect of rigidity, the top surface of the substrate should be uniform (both geometrically and chemically) across the boundary, while the underlying stiffness changes. To accomplish such a goal, we use arrays of posts with the same diameter and spacing, but different heights.
In this work, we describe fabrication and initial testing of structures that provide multiple stiffness surfaces in a single substrate. The structures are hexagonal arrays of posts in which the post diameter is kept constant and the top surface of the posts lies in one plane but the height of the posts in selected areas is varied, resulting in a change in stiffness. These arrays are designed to probe the effect of a sharp rigidity change on the mechanical interaction of cells with their underlying substrate.
Fabrication Process
A. Fabrication of Arrays of Deep Holes
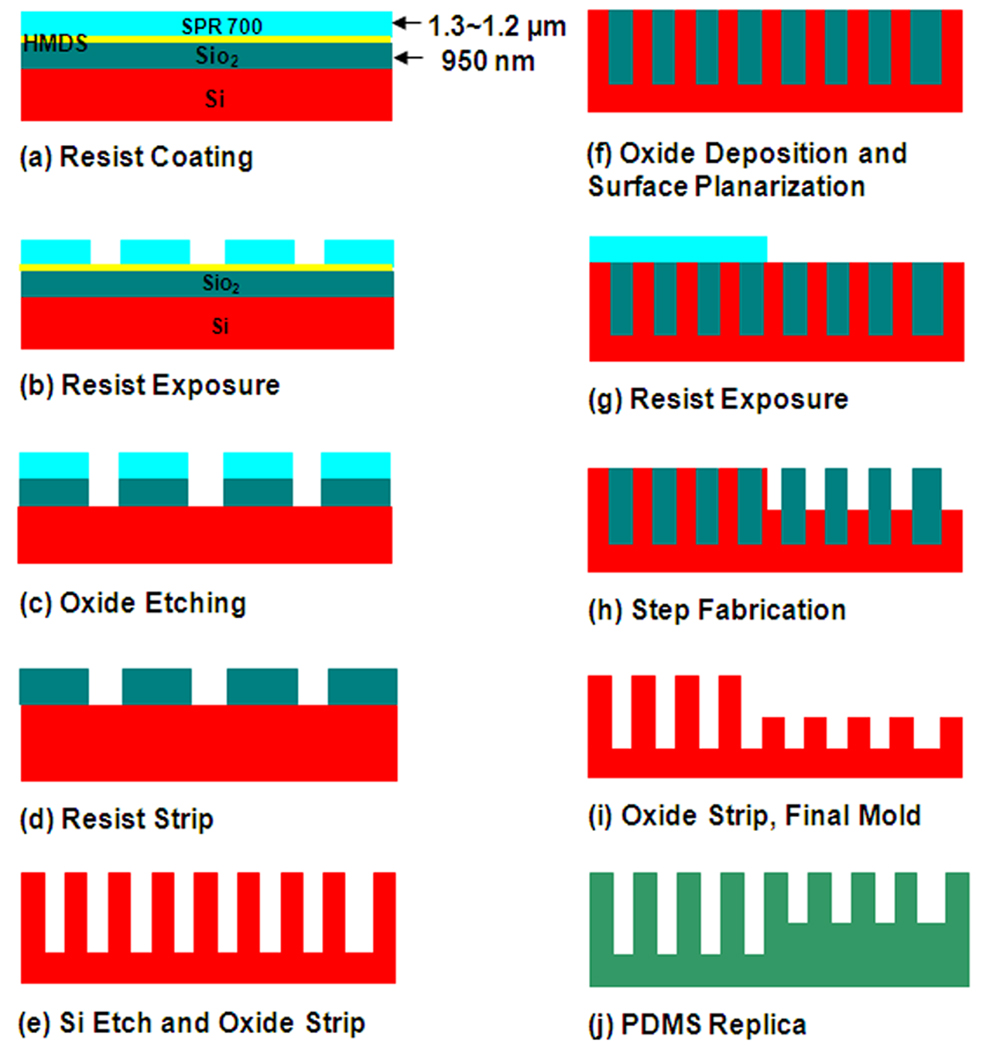
The central part of the work described below involves fabrication of a Si structure, which is then used as a mold for fabrication of the elastomer posts. The mold is made by first etching a uniform array of holes into a wafer, then performing a second etch that reduces the height of the Si substrate over half of the array while leaving the hole bottoms at the same level. Molding silicone elastomer into the structure yields the reverse structure, namely an array of posts with a uniform top surface but with a step in the underlying substrate (Fig. 1j).
Figure 1.
Schematic process flow for drawing fabrication of arrays of PDMS posts with variable height and constant top surface topology.
The fabrication process is illustrated in Fig.1. RCA-cleaned Si wafers were oxidized at 1100 °C for 2 h. to form a 950 nm-thick SiO2 film. The wafers were coated with 1.2 µm-thick photoresist (Shipley SPR 7000) using HMDS as an adhesion promoter. The resist was then soft-baked on a hot plate at 90 °C for 60 s, followed by another bake at 115 °C for 60 s to remove residual solvent and mechanical stress in the film.
The wafers were patterned by conventional UV photolithography (Fig. 1b). A photomask, with hexagonal arrays of holes, was fabricated using a Heidelberg DWL 66 laser pattern generator. After exposing the photoresist in a GCA Autostep 200 system, the wafer was post exposure baked at 90 °C for 60 s on the hotplate and developed with AZ 300 MIF developer. The patterned resist was then treated with a long post-development bake at 90 °C for one hour in order to smooth the sidewalls, followed by O2 plasma descum for one minute.
Using the patterned resist as a mask, the SiO2 was etched by RIE (Oxford PlasmaLab 80+) (Fig. 1c). Using gas flow rates of 2 sccm O2, 50 sccm CHF3, 40 mTorr pressure and 200 W RF power, the etch rate of the silicon dioxide was measured to be about 29 nm/min. A 20% overetch was applied in order to ensure a clean sidewall. The oxide etch has an important impact on the final result since the etch profile of the underlying Si depends critically upon the profile of the oxide hard mask. A non-vertical or rough masking will result in non-vertical wells. Another important factor is the thickness of the oxide mask. If the oxide mask is not thick enough, the final etch profile of the etched Si will be tapered.
The next fabrication step involved etching Si using the SiO2 as a hard mask (Fig. 1d–e). First, the resist was removed in a PlasmaTherm 770 ICP-RIE system. The Si holes were then etched to the desired depth in a Chlorine based ICP-RIE system under the following condition: 70 sccm Cl2, 2 sccm BCl3, 2 sccm H2; 20 mTorr pressure; 85 W RF power and 800 W ICP power. The etch rate of the silicon was about 300 nm/min. The resulting wafer was then immersed in BOE to remove the oxide mask.
B. Fabrication of the Multi-Height Step
The next step involved the step fabrication, which consists of etching the Si in selected areas. In order to protect areas that were not to be etched, SiO2 with a thickness of 2 µm was deposited conformally over the entire wafer by plasma enhanced chemical vapor deposition (PECVD) (Fig. 1f). The deposition thickness was chosen so that the resulting film would protect the holes from subsequent etching. The surface of the wafer was then planarized using a chemical-mechanical polishing (CMP) process.
After planarization, the wafer was coated with photoresist (Shipley 1813) and soft-baked on a hot plate at 110 °C for 60 s. The photoresist was then exposed in a HTG System III-HR Contact Aligner for 85 s using a mask that defined large areas in which the Si would undergo further etching (Fig. 1g). The photoresist was developed with AZ 300 MIF developer. The exposed Si was then etched in a fluorine based Bosch process to the desired height step (Fig. 1h).
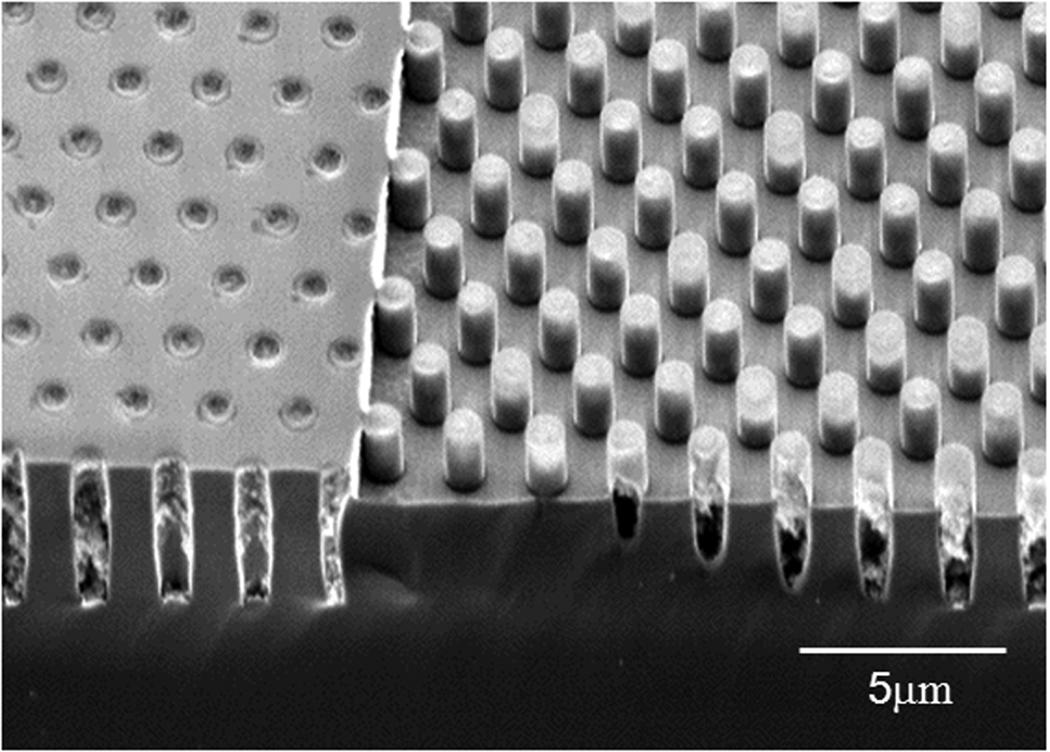
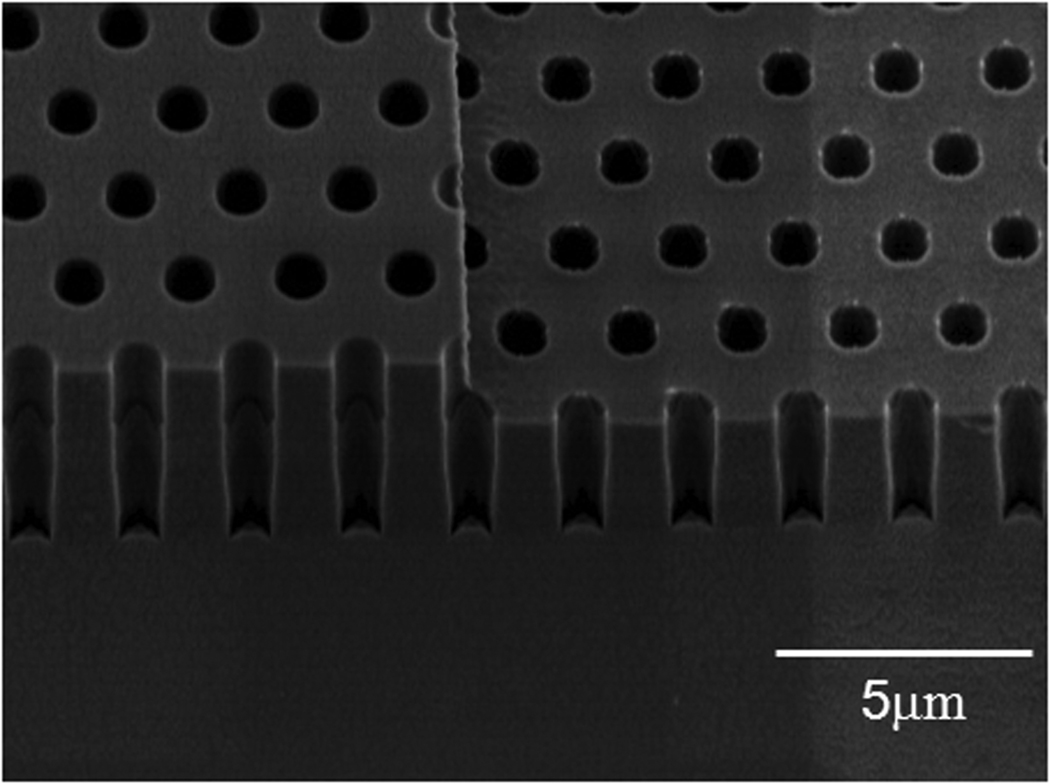
Figure 2 shows a sample that underwent all the processing steps described above. The fabricated step height and subsequent change in depth of the holes can be observed. The holes are still filled with the oxide, which protects them from the second Si etch. This oxide is subsequently removed in BOE. Figure 3 shows the final Si mold. The etch process results in a smooth and vertical sidewall profile which is critical for the release of PDMS, Poly(dimethylsiloxane), from the mold as well as determining the profile of PDMS posts.
Figure 2.
SEM image of double height holes in silicon substrate after fabrication of the step height and before removing of the oxide. The thickness of the deposited oxide is 2 µm. The deposition thickness is chosen such that the resulting film protects the holes from further fabrication process.
Figure 3.
SEM image of double height holes in silicon substrate. The diameter of the holes is 1 µm and the pitch size is 2 µm. The height of the deeper hole is 6.6 µm and the height of the shallower hole is 3.9 µm.
Using the process described above, samples were fabricated with a range of hole diameters as well as different heights. The diameter of the holes varied from 0.7 to 3 µm, although the diameter was kept constant for each substrate. The pillar height was varied from 2 – 8 µm. Since the stiffness varies inversely with the cube of the height (Eq. 1), this height range results in a modulation of the pillar stiffness by a factor of 64, thereby covering a wide range of rigidities on a single substrate.
C. Elastomer Pillars, Surface Chemistry, and Cell Culture
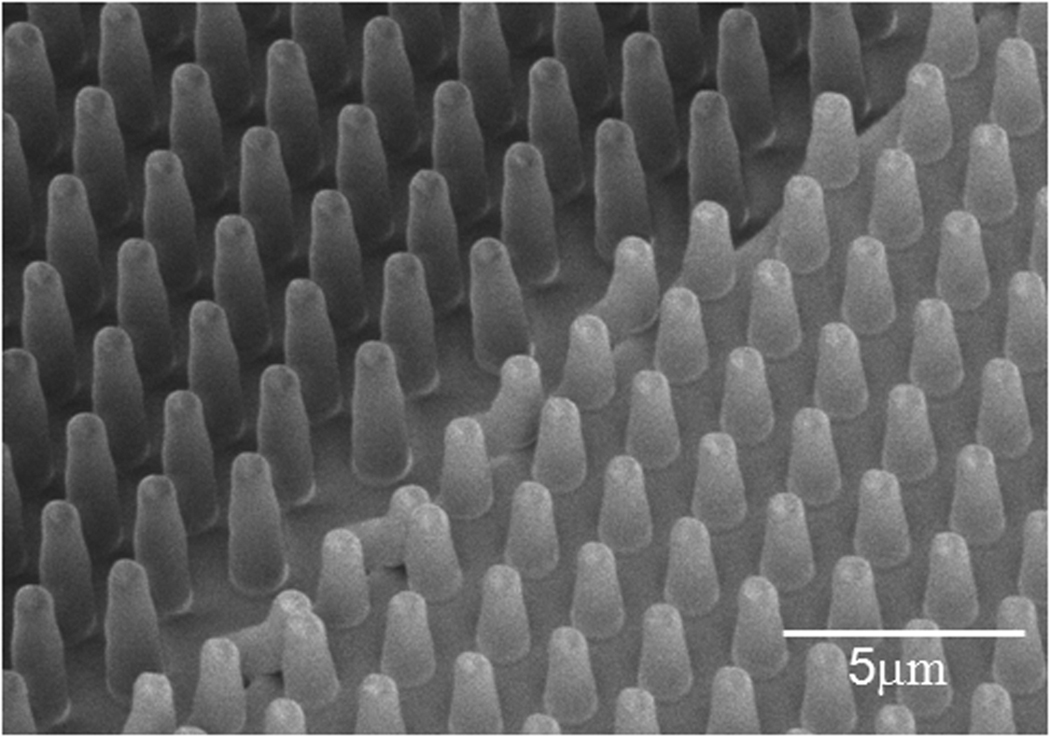
The Si structures were used as molds for fabrication of post arrays using a liquid silicone prepolymer, Poly(dimethylsiloxane) (Dow Corning Sylgard). Prior to PDMS molding, the patterned wafers were piranha cleaned for 6 h at room temperature, followed by a one minute O2 plasma clean and overnight silanization in vapor phase tridecafluoro-trichlorosilane in vacuum (100 µL in a glass vial inside the vacuum jar). This facilitates the subsequent release of elastomer from the wafer after curing. The PDMS was mixed with its curing agent, was then poured over the silicon mold and cured at 70 °C for 12 h, in order to achieve a Young’s modulus of 2 ± 0.1 MPa. The PDMS was then peeled off of the mold while immersed in ethanol. Use of ethanol is critical to this step considering the high aspect ratio of the posts (diameter smaller than 6 times the height). If the pillars are allowed to dry, they tend to irreversibly adhere to one another. Figure 4 shows a scanning electron micrograph of a uniform array of PDMS posts with two different heights (3 µm and 7 µm). Using Eq. 1, we estimate the stiffness of the short posts to be ~ 10.7 nN / µm, as compared to ~ 0.9 nN / µm for the tall posts respectively, assuming a perfectly cylindrical geometry. Since our posts are slightly tapered, the actual stiffness is numerically calculated to be approximately 8.2 nN / µm and 0.6 nN / µm, respectively. For applications requiring more precise determination of the pillar stiffness, independent calibration using microplates is possible2.
Figure 4.
Scanning electron micrograph of double height PDMS posts. The diameter of posts is constant but the height is different such that the top contact area of the posts lies in one plane. This will generate controlled step increase in substrate stiffness. The diameter of the posts is 1 µm and the pitch is 2 µm. The shorter posts are about 13 times stiffer than the taller posts.
To promote cellular adhesion, the substrates were immersed in 50 µg/ml fibronectin in PBS (Phosphate Buffered Saline) for one hour prior to plating. NIH 3T3 mouse fibroblast cells were cultured in DMEM (Dulbecco’s Modified Eagle Medium) supplemented with 10% FBS (Fetal Bovine Serum). Immortalized mesenchymal stem cells10 were cultured in DMEM supplemented with 5% FBS. The substrates were washed three times with PBS and the cells were plated on the substrate overnight. Images of 3T3 cells were collected using an inverted microscope with a 20× objective with a rate of one image every 10 seconds. The immortalized mesenchymal stem cells were fixed in paraformaldehyde, dried using a critical point dryer, and then observed by scanning electron microscopy.
Preliminary Biological Results
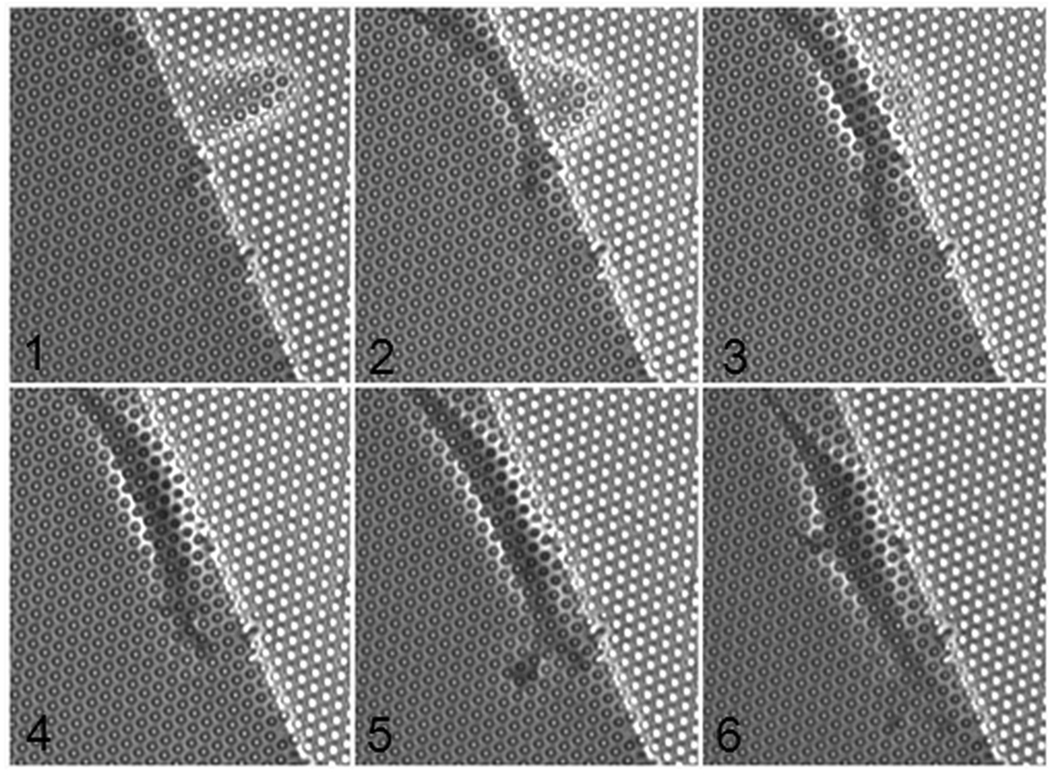
In order to investigate the effect of rigidity on the migration of cells, 3T3 cells were plated on elastomer pillars with diameters of 1 and 2 µm and two different heights of 6.6 and 3.9 µm, and therefore a range of stiffnesses from 0.85 to 170 nN / µm. In order to avoid the effect of cell-to-cell interaction, cells were plated at sub-confluent density. The cells were left to spread overnight and then were imaged for about two hours. Bright field microscopy was used to follow the cell movement on the substrate. Ten different cells were observed to spread across the boundary between areas of different rigidity. In nine of these cases, the cells migrated towards the stiffer area and never returned to the soft part. Figure 5 shows a time series of images of one 3T3 cell plated on the boundary between posts of heights 3.9 and 6.6 µm. The cell initially spread across the boundary and then migrated toward the stiffer area. This behavior is typical for 3T3 cells responding to different rigidity of the substrate.6 These preliminary results demonstrate that these substrates can be used to probe the rigidity sensing response of individual cells.
Figure 5.
Time-lapse optical micrograph of migration of 3T3 cells on a double rigidity substrate. The stiff part (left side) is about 5 times stiffer than the soft part. The cell on the boundary is migrating towards the rigid part (time interval 10 s between frames).
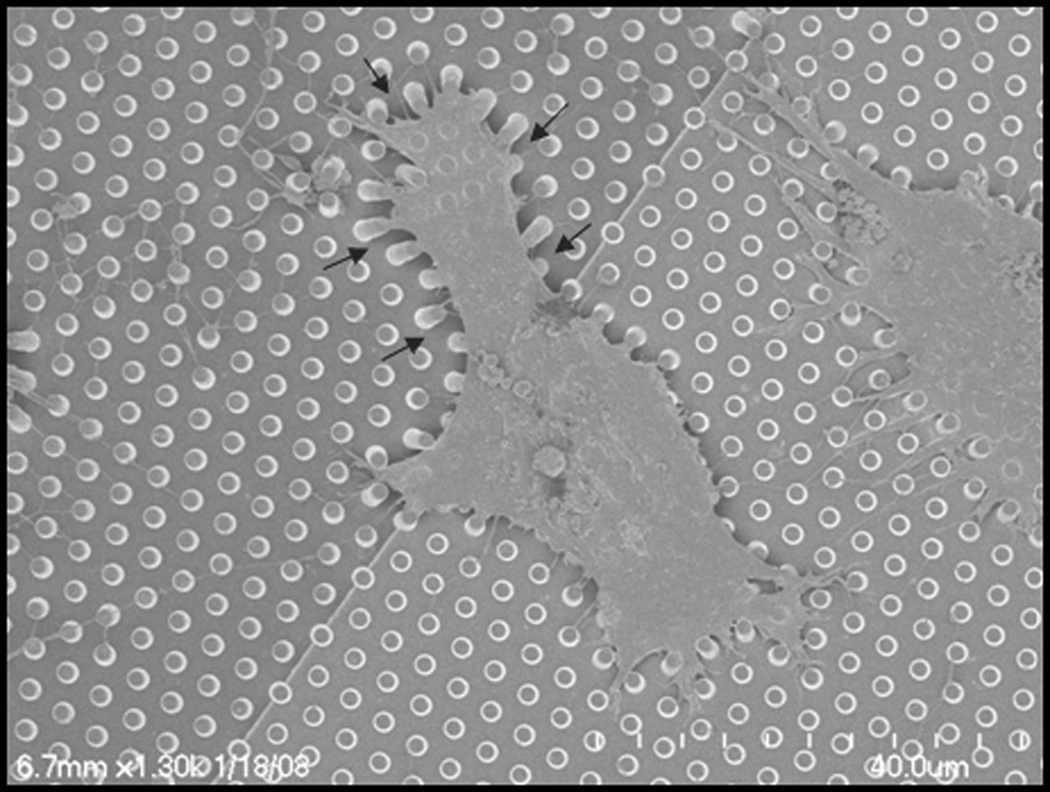
Another observation was made with mesenchymal stem cells plated on elastomer pillars with different heights and therefore different rigidity A marked difference in phenotype can be observed on either side: they look more round on the soft part and more spread out on the stiff part (Fig. 6). This behavior could lead to different differentiation paths in the two areas, as indicated by the work of Engler et al.7
Figure 6.
SEM image of an immortalized mesenchymal stem cell attached to a hexagonal array of posts with a constant diameter of 1 mm, pitch of 2 mm and two different heights of 6.6 and 3.9 mm, which causes a change in rigidity of the substrate. The cell is more spread on the rigid part (right part) than the softer part (left part). Also, on the softer area the posts are bent to a greater extent compared to the rigid posts. The arrows indicate the direction of pillar deflection.
Conclusion
We demonstrate the fabrication process of a flexible substrate with a uniform top surface but with a modulated stiffness to study the effect of rigidity on the cellular behavior. The PDMS substrates used have the advantage that their stiffness can be easily modified by changing their geometry and can precisely detect the cellular activities. Surface rigidity modifies cell migration and adhesion, and is also likely to modify the force exerted by cells on the substrate.11 Our future goal is to quantify these forces and study the relationship between the change in the motility behavior and the forces applied by the cells. In the longer term, it will be straightforward to modify the fabrication procedure to yield multiple pillar heights on a single array, and to modulate the pillar heights locally. More complex patterns of pillar rigidity will help us to study the physical and topographical effect of the substrate on cellular behavior in a more versatile manner.
Acknowledgement
This work was performed in part at the Cornell NanoScale Facility, a member of the National Nanotechnology Infrastructure Network, which is supported by the National Science Foundation (Grant ECS-0335765). This publication and the project described were supported by the National Institutes of Health through the NIH Roadmap for Medical Research (PN2 EY016586). Mesenchymal stem cells were a kind gift of Dr. Junya Toguchida (Kyoto University, Japan)
Reference
- 1.Tymchenko N, Wallentin J, Petronis S, Bjursten LM, Kasemo B, Gold J. Biophys J. 2007;93:335. doi: 10.1529/biophysj.106.093302. [DOI] [PMC free article] [PubMed] [Google Scholar]
- 2.du Roure O, Saez A, Buguin A, Austin RH, Chavrier P, Silberzan P, Ladoux B. Proc Natl Acad Sci U S A. 2005;102:2390. doi: 10.1073/pnas.0408482102. [DOI] [PMC free article] [PubMed] [Google Scholar]
- 3.Tan JL, Tien J, Pirone DM, Gray DS, Bhadriraju K, Chen CS. Proc Natl Acad Sci U S A. 2003;100:1484. doi: 10.1073/pnas.0235407100. [DOI] [PMC free article] [PubMed] [Google Scholar]
- 4.Xia N, Thodeti CK, Hunt TP, Xu Q, Ho M, Whitesides GM, Westervelt R, Ingber DE. FASEB J. 2008;22:1649. doi: 10.1096/fj.07-090571. [DOI] [PubMed] [Google Scholar]
- 5.Wang C-W, Chen W-R, Wu C-C, Chang H-C. 2007 [Google Scholar]
- 6.Lo CM, Wang HB, Dembo M, Wang YL. Biophys J. 2000;79:144. doi: 10.1016/S0006-3495(00)76279-5. [DOI] [PMC free article] [PubMed] [Google Scholar]
- 7.Engler AJ, Sen S, Sweeney HL, Discher DE. Cell. 2006;126:677. doi: 10.1016/j.cell.2006.06.044. [DOI] [PubMed] [Google Scholar]
- 8.Saez A, Ghibaudo M, Buguin A, Silberzan P, Ladoux B. Proc Natl Acad Sci U S A. 2007;104:8281. doi: 10.1073/pnas.0702259104. [DOI] [PMC free article] [PubMed] [Google Scholar]
- 9.Landau L, Lifschitz E. Theorie de l'Elasticite. Moscow: 1990. [Google Scholar]
- 10.Okamoto T, Aoyama T, Nakayama T, Nakamata T, Hosaka T, Nishijo K, Nakamura T, Kiyono T, Toguchida J. Biochem Biophys Res Commun. 2002;295:354. doi: 10.1016/s0006-291x(02)00661-7. [DOI] [PubMed] [Google Scholar]
- 11.Saez A, Buguin A, Silberzan P, Ladoux B. Biophys J. 2005;89:L52. doi: 10.1529/biophysj.105.071217. [DOI] [PMC free article] [PubMed] [Google Scholar]


