Abstract
A critical need for enhancing usability and capabilities of microfluidic technologies is the development of standardized, scalable, and versatile control systems1,2. Electronically controlled valves and pumps typically used for dynamic flow regulation, although useful, can limit convenience, scalability, and robustness3–5. This shortcoming has motivated development of device-embedded non-electrical flow-control systems. Existing approaches to regulate operation timing on-chip, however, still require external signals such as timed generation of fluid flow, bubbles, liquid plugs or droplets, or an alteration of chemical compositions or temperature6–16. Here, we describe a strategy to provide device-embedded flow switching and clocking functions. Physical gaps and cavities interconnected by holes are fabricated into a three-layer elastomer structure to form networks of fluidic gates that can spontaneously generate cascading and oscillatory flow output using only a constant flow of Newtonian fluids as the device input. The resulting microfluidic substrate architecture is simple, scalable, and should be applicable to various materials. This flow-powered fluidic gating scheme brings the autonomous signal processing ability of microelectronic circuits to microfluidics where there is the added diversity in current information of having distinct chemical or particulate species and richness in current operation of having chemical reactions and physical interactions.
A limitation of microfluidic control is that unlike modern electronic systems where the controller and actuator circuits are all electrically driven, microfluidics currently requires peripheral electromechanical components for control and actuation of fluid flow2–4. This more closely resembles the very early days of electrical circuitry where electromechanical relays performed electrical switching. Two-phase flow interactions can regulate the movement of bubbles/droplets and perform logic operations that direct the flow of trailing fluid on-chip10,11. This approach enables high-speed digital flow control, where the bubble/droplet represents a bit of information passing through logic gates. Although this approach may become useful for some high-throughput droplet assays, it is not suitable for applications that require filtration of physical objects or other two-phase flow disrupting operations. In addition, the bubble/droplet approach requires dynamic input (dictating when bubbles/droplets should be created) in order to perform time-varying operations; that is, they still require external controllers. Another approach, which aims to minimize the need for external control, is the use of elastomeric valves with tuned resonant frequencies that respond passively according to the frequency of external inputs14. Due to the large bandwidth of each component’s resonant response, however, clean switching between different gates has not been achieved17. Thus, there is a lack of schemes for different fluids to regulate each other in either a cascading or feedback mechanism.
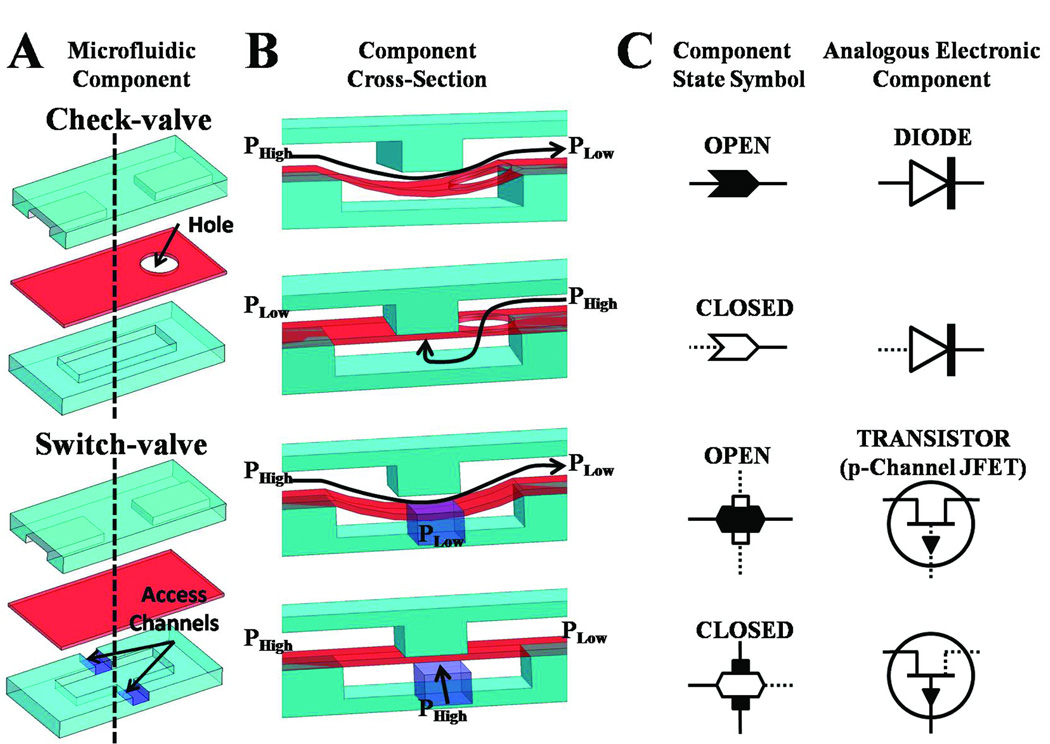
Control in a cascading electrical or fluidic circuit is dictated by two parameters, a switching mechanism and a time delay18. In our microfluidic circuitry, the switching action is enabled by check-valves and switch-valves that have geometrically regulated threshold pressures. These components translate a constant infusion of fluid into a transient outflow. The time-delay effect is realized by compliant components that gradually pressurize in response to steady infusion of fluid in a process that mimics the charging of a capacitor. All components in the fluidic circuits are made in a three layer polydimethylsiloxane (PDMS) substrate (Fig. 1A). Both the check-valve and switch-valve consist of an interrupted microchannel in one layer, a cavity in the other layer, and a deformable membrane in between that can deflect into the cavity to allow the interrupted channel to become connected (Fig. 1B). The check-valve also has a through-hole in the membrane layer to connect one of the ends of the interrupted microchannel with the cavity on the opposing layer. The position of this through-hole dictates the direction of flow allowed and effectively creates a diode-like function which negates any back-flow and diffusion in its closed state (Fig. 1C, see also Fig. S1). A switch-valve is flow-permissive in both directions but can have access channels to its cavity so that an alternate pressure can force the switch-valve into a closed “off” state (Fig. 1B). A switch-valve with two access channels is shown (Fig.1A); alternatively it can have either zero or one access channel. The function of the switch-valve can be thought of as a gated transistor that functions as an electronically controlled switch (Fig. 1C). Specifically we show a p-Channel JFET transistor since it functions similarly in that a positive gate voltage turns off the switch. It should be noted that the switch-valve is not capable of providing any non-linear gain, however, the required “gate” pressure (pressure in the cavity region) is lower than that of the source pressure (pressure in top channel) due to the contribution of the membrane elasticity in keeping the valve closed. This means that the opening differential pressure is higher than that of the closing differential pressure.
Fig. 1. Elastomeric components for autonomously controlled microfluidic devices.
(A) A three-layer composite of the check-valve and switch-valve. (B) Cross-section schematic of check-valve and switch-valve in both open and closed state based on differential pressure. (C) Corresponding component state symbol of the check-valve and switch-valve. Conducting current/flow is shown as solid lines and non-conducting current/flow is shown as dotted lines. (D) The diode and p-channel JFET transistor are shown as analogous electronic components to the check-valve and switch-valve, respectively.
In order to estimate the performance of the developed microfluidic system, a theoretical model based on equivalent fluidic circuit concept was constructed and solved numerically in Labview 8.5 (National Instruments, Austin, TX) (see section 2 in SI). The underlying fluid model is based on the Navier-Stokes equation and mechanics. There are three basic components: fluid resistance, capacitance, and inductance that are used to derive the model. Analogous to electrical resistance, fluid resistance is defined as the ratio of pressure drop over flow rate,
where Δ P is the pressure difference, in N/m2, and Q is the volume flow rate, in m3/s. For a microfluidic channel with a rectangular cross-section with width w, length l, depth h, channel aspect ratio ε, viscosity μ, and assuming both- laminar flow and Newtonian fluid, the resistance19 is
Compliant elements of a fluidic system exhibit the fluidic equivalent of capacitance as a pressure-dependent volume change
The fluidic capacitance for a square membrane can be derived by plate theory as
where w is membrane width (m), E is Young’s modulus of the membrane (N/m2), t is membrane thickness (m), and ν is Poisson’s ratio of the membrane (dimensionless)20,21. In a manner analogous to electrical inductance, the change in fluidic kinetic energy can directly affect the system pressure change, termed as fluidic inductance, H (in kg/m4)21,22
For incompressible and inert fluids in tubes of constant cross section A, fluid density ρ, and length L, the fluidic inductance is given by
It should be mentioned that fluidic inductance in microfluidics, despite having much smaller cross-sectional areas, is typically not a dominant factor since and L are significantly smaller. However, for devices where valves are rapidly opening and closing pressurized flow, fluidic inductance could become more influential on the fluid dynamics of the system.
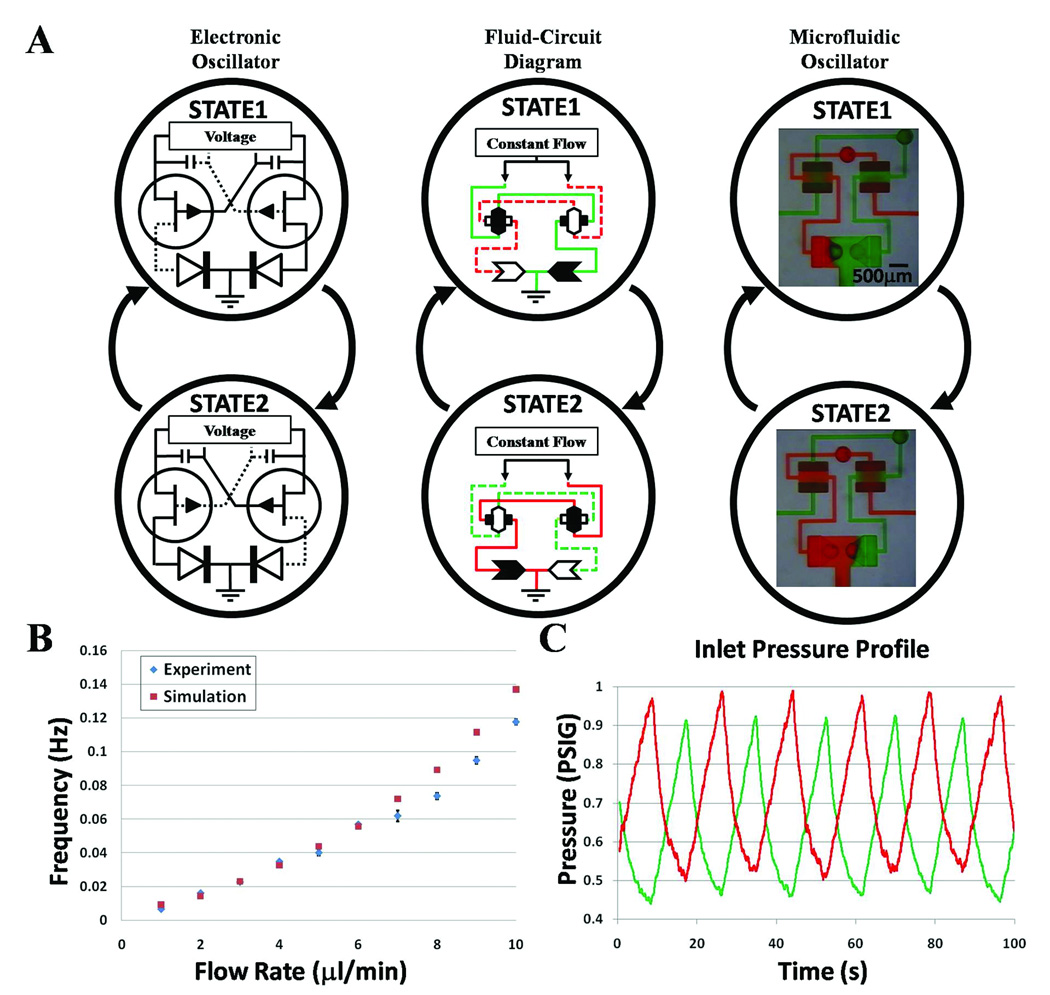
Components integrated in specific configurations enable dynamic auto-regulation of fluid flow. The microfluidic oscillator, comprised of two switch-valves each connected to a check-valve, autonomously regulates two flows that are infused at a constant rate to have a distinctive alternating output that indefinitely oscillates between two states so that only one fluid is flowing at a given time (Fig.2A; see also movie S1). There is only one steady oscillation frequency when a particular set of conditions is applied (i.e. infusion rates of the two fluids and the channel and the component geometries in the circuit). Changing any one of these parameters will change the oscillation frequency, and therefore the fluidic circuit must be designed as a whole to achieve a desired autonomously regulating function. This switching scheme may be understood by an analogous electronic circuit shown in Figure 2A where the transistor provides similar switching functions as the switch-valve. Although the diodes are not necessary for the electronic oscillator, the check-valves serve to negate backflow and mixing between the solutions in the microfluidic oscillator. For the microfluidic oscillator in Figure 2A, when the red fluid reaches a threshold pressure, it breaks through and opens the right switch-valve. The red fluid then flows to the cavity chamber of the left switch-valve to close it and stop flow of the green fluid. The red fluid then flows out through a check-valve to the outlet where the pressure is released. Now the green fluid builds up pressure while the pressure of the red fluid decreases to repeat the process on the other side of the circuit. For a range of flow rates (Fig. 2B) determined by the response time of membrane deflection and geometry of the components and channels, the frequency increases with flow rate (that is, time for parameters C1/Q1, C2/Q2 to surpass a threshold pressure decreases with increasing flow rates, see SI for description of a theoretical model). At flow rates beyond this operating range, the switching frequencies approach the response time of the valve opening and closings resulting in partially switching oscillations (see movie S2 and section 2 of SI) and eventually no switching. Figure 2C shows the autonomous on-chip oscillation in pressure within the device, which has implications to signal processing and clock-signal generation (for example, see Fig. 3). Oscillations are also biologically relevant as flow of bodily fluids and release of biochemicals is often cyclic or pulsatile23–25. We note that continuous switching of low Reynolds number, single-phase, Newtonian fluid flows has previously only been possible by external control.
Fig. 2. Interactive elastomeric components for oscillatory switching.
(A) Comparison between microfluidic oscillator and electronic oscillator. The two states of a microfluidic oscillator automatically produce an alternating output flow between two distinct solutions being simultaneously infused at a constant rate. (B) Graph of both the simulated and experimental data for the oscillators switching frequency for various flow rates within its operating range. Error bars represent the standard deviations from three measurements taken at each flow rate. (C) Graph of pressure oscillations at solution inlets for an infusion rate of 10µl/min.
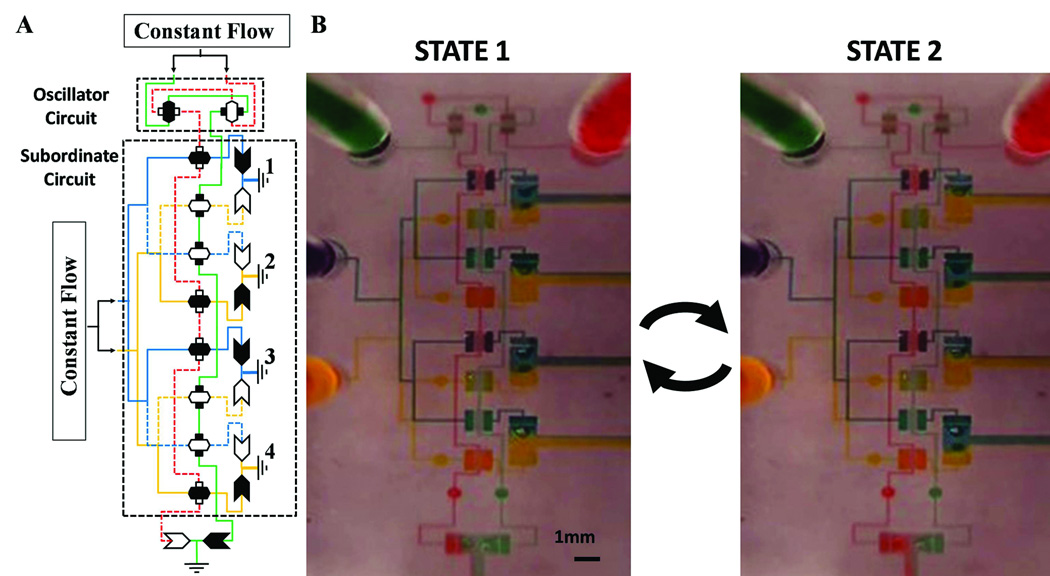
Fig. 3. Fluidic oscillator controls flow in subordinate fluid-circuit.
(A) Fluid-circuit diagram for state 1 of a microfluidic oscillator providing input signals (red and green solutions) to a subordinate fluid-circuit which distributes flow of two solutions (yellow and blue) to 4 outlets. (B) Actual images of both states for the fluid-circuit with an infusion rate of 100µl/min which oscillates at 1 Hz.
Figure 3 demonstrates how the microfluidic oscillator (Fig. 2A) can serve as a controller to regulate flow of different solutions in a subordinate fluidic circuit. The pressure changes shown in Figure 2C are used as a clocking signal for the subordinate circuit. The subordinate circuit is comprised of eight switch-valves and eight check-valves that distribute flow of two solutions (yellow and blue) to four outlets (Fig. 3A). The green and red controller solutions each activate four of the eight switch-valves of the subordinate circuit in an alternating serial arrangement. All solutions are infused simultaneously by a multi-syringe pump at a flow rate of 100µl/min. It can be seen that the distribution of flow to the four outlets alternate based on the state of the oscillator circuit at a frequency of 1Hz (Fig. 3B, see also movie S3). It is noted that the output flow of the oscillator circuit drops along its serial path. In order to compensate for this pressure loss, the two switch-valves in the oscillator circuit were designed with smaller widths in order for the output flow to be of sufficient pressure to properly regulate each valve of the subordinate circuit. Alternatively, the blue and yellow sample solutions could have been infused at a relatively lower flow rate than that of the green and red controller solutions.
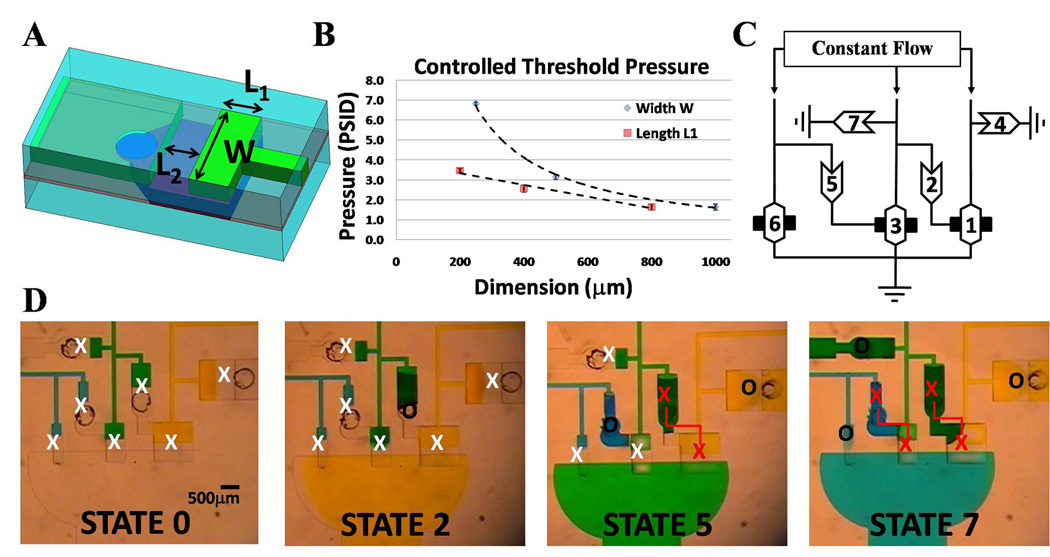
In addition to oscillations, another important class of fluidic control functions is automated sequential operations, as done in electronic finite state machines. Figure 3 shows such an automatically reconfiguring channel network that enables a time-regulated discretization of flow conduction into on and off states. This network is comprised of three switch-valves and four check-valves arranged both in parallel and in series. Each component has a different threshold pressure dictated by its physical geometry so that each is activated at different times when being infused simultaneously (see section 3 in SI for details of the cascading switching mechanism). Infusion can be performed by a multi-syringe pump (see movie S4) or alternatively by the squeezing force of a clamp (see movie S5). Actual images of four of the seven states are shown in Figure 3B, an “O” or “X” represents the component in an on or off state, respectively. A red “X” designates a check-valve with a downstream channel linked to the cavity of a switch-valve. This combination of components locks in pressure, which subsequently maintains both components in an off state despite any subsequent release of pressure behind the check-valve. The sequential switching mechanism enables assays where multiple solutions are introduced into a channel sequentially, such as in an immunoassay (see Fig. S5). Although the fluidic control shown here is relatively simple, consisting of only a few steps, electronic circuit analysis describes that every circuit or logic operation is possible using only a transistor component26. Since a transistor’s directionally distinct switching properties are mimicked by having a switch-valve and check-valve in series, this suggests broad applicability of the developed elastomeric components for device embedded flow control.
Methods
Fabrication of Device
The device consists of three layers made from PDMS prepolymer and curing agent (Sylgard 184, Dow Corning Co., Midland, MI) at a 10:1 ratio. The top and bottom layers are molded against a master mold made by standard photolithography using the negative-photoresist SU-8 (SU-8, MicroChem Co., Newton, MA). The master molds were silanized in a desiccator for 2 hours (United Chemical Tech., Bristol, PA). The height of all top layer and bottom layer features is 100µm except for those in the top layer of Figure 3 which is 30µm. The PDMS molds of the top and bottom layers were cured in a 120°C oven for over 2 hours. The middle-layer membrane was made by spin-coating a 30µm PDMS layer on a silanized silicon-wafer at 1500rpm for 90 seconds and then curing in a 120°C oven for 30min. All layers were bonded together using oxygen plasma treatment (SPI Plasma-Prep II, Structure Probe, Inc., West Chester, PA) for 30 seconds.
The three layers of the device are bonded together using oxygen plasma for 30 seconds. In the first step, the thin PDMS membrane, while still on the silicon wafer (or any flat substrate), is bonded to either the top or bottom layer and then the two bonded layers are detached from the wafer. Access holes are made in the top layer with a biopsy punch. Holes are punched into the bonded middle layer, using a 350µm biopsy punch (Ted Pella Inc., Redding, CA), for the check-valve and switch-valve components for all figures except Figure 3E which used a 29 gauge insulin syringe. For check-valve components, a hole is punched in the downstream region of the cavity directly after the gap. Switch-valves have holes punched to interface access channels of the top and bottom layers. To ensure efficacy of the components, the circular shape of the biopsy punch can be molded into either or both the bottom layer and top layer so the hole is accurately punched every time (as shown in figure 4A). For the second step, the top layer and the bonded middle and bottom layers are bonded. The gap regions of the components are rendered unable to permanently bond to the middle membrane by placing a PDMS stamp which has extruding features that correspond to the gap regions negating exposure to oxygen plasma. Finally in step three, all layers are aligned and bonded together; the device is incubated at 60°C for 1 minute to enhance the bond strength. Solutions are then inserted in the access holes to fill the device. The device should not be used directly after being placed in a vacuum since it can cause some components to open; in which case waiting about 30 minutes allows air to penetrate back in. Tubing or other interfaces can be connected to access holes in the top layer.
Fig. 4. Automated Fluid Circuits for Cascading Operations.
(A) Geometric parameters that dictate component opening threshold pressure for check-valve and diode. (B) Graph showing linear and non-linear dependence of check-valve’s geometries for varying L1 and W dimensions (while other dimension is held constant), respectively. Error bars represent the standard deviations from measurements taken from three separate devices. (C) Fluid-circuit diagram of a device that sequentially switches between three solutions being infused simultaneously at a constant flow rate. This circuit is a simple finite state machine that performs a predefined sequence of operations. Numbers in components show order of opening. (D) Actual images of four of the seven states with “X” and “O” representing closed and opened valves, respectively. Red “X”s connected by a line designate check-valve and switch-valve modules that lock in pressure to maintain the two linked valves closed once a threshold is surpassed.
Component Pressure Characterization
The dependence of threshold pressure on the geometry of a component was characterized for three lengths of both L1 and W (as shown in Fig. 4B). The threshold pressure was determined by continuously measuring the differential pressure across the component with a differential pressure transducer (Model PX139-005D4V, Omega Eng. Inc., Stamford, CT) as a syringe pump continuously pressurized the microchannel with a flow-rate of 6ml/hr. The pressure transducers were connected to access microchannels that were located directly before and after the component for quicker response timing and more accurate readings. The threshold pressure for a given trial was determined by the peak pressure in the pressure histogram as measured by the transducer as the component pressurized to a critical limit and opened. The average of three trials was plotted to give the relationship between the threshold pressure and the component dimension. Threshold pressures for components with a constant W of 1mm with L1 values of 800µm, 400 µm, and 200 µm as well as for a constant L1 of 800µm with W values of 1000µm, 500µm, and 250µm are provided in SI. For all components, L2 was maintained constant at 300µm. The oscillator pressure measurements were performed by measuring the gauge pressure of both inlets simultaneously using two pressure transducers (Model PX26-015DV, Omega Eng. Inc., Stamford, CT). Measurements were taken every 100ms and the graphs are the moving time-average of 50 minus the measured zero value for each sensor.
Supplementary Material
Acknowledgements
We thank the NIH (HL-084370) for financial support. B.M. acknowledges funding from GAANN fellowship supported by U.S. Department of Education and TEAM training grant supported by National Institute for Dental and Craniofacial Research.
Footnotes
Author Contributions:
B.M. conceived, designed and fabricated devices for all experiments and S.T. oversaw the complete project. B.M. and C-H.K. performed component characterization experiments. Y-C.T. developed the computer model for the oscillation device. B.M., T.B-B. Y.T., H.T., and S.T. developed the framework and wrote the paper.
References
- 1.Whitesides GM. The origins and the future of microfluidics. Nature. 2006;442:368–373. doi: 10.1038/nature05058. [DOI] [PubMed] [Google Scholar]
- 2.Pennathur S. Flow control in microfluidics: are the workhorse flows adequate? Lab Chip. 2008;8:383–387. doi: 10.1039/b801448p. [DOI] [PubMed] [Google Scholar]
- 3.Unger MA, Chou HP, Thorsen T, Scherer A, Quake SR. Monolithic microfabricated valves and pumps by multilayer soft lithography. Science. 2000;288:113–116. doi: 10.1126/science.288.5463.113. [DOI] [PubMed] [Google Scholar]
- 4.Gu W, Zhu X, Futai N, Cho BS, Takayama S. Computerized microfluidic cell culture using elastomeric channels and Braille displays. Proc. Natl Acad. Sci. USA. 2004;101:15861–15866. doi: 10.1073/pnas.0404353101. [DOI] [PMC free article] [PubMed] [Google Scholar]
- 5.Xie J, Shih J, Lin Q, Yang B, Tai YC. Surface micromachined electrostatically actuated micro peristaltic pump. Lab Chip. 2004;4:495–501. doi: 10.1039/b403906h. [DOI] [PubMed] [Google Scholar]
- 6.Beebe DJ, et al. Functional hydrogel structures for autonomous flow control inside microfluidic channels. Nature. 2000;404:588–590. doi: 10.1038/35007047. [DOI] [PubMed] [Google Scholar]
- 7.Groisman A, Enzelberger M, Quake SR. Microfluidic memory and control devices. Science. 2003;300:955–958. doi: 10.1126/science.1083694. [DOI] [PubMed] [Google Scholar]
- 8.Madou MJ, Lee LJ, Daunert S, Lai S, Shih C-H. Design and Fabrication of CD-like Microfluidic Platforms for Diagnostics: Microfluidic Functions. Biomed. Microdev. 2001;3:245–254. [Google Scholar]
- 9.Fuerstman MJ, Garstecki P, Whitesides GM. Coding/decoding and reversibility of droplet trains in microfluidic networks. Science. 2007;315:828–832. doi: 10.1126/science.1134514. [DOI] [PubMed] [Google Scholar]
- 10.Prakash M, Gershenfeld N. Microfluidic bubble logic. Science. 2007;315:832–835. doi: 10.1126/science.1136907. [DOI] [PubMed] [Google Scholar]
- 11.Cheow LF, Yobas L, Kwong DL. Digital microfluidics: Droplet based logic gates. Appl. Phys. Lett. 2007;90:054107. [Google Scholar]
- 12.Toepke MW, Abhyankar VV, Beebe DJ. Microfluidic logic gates and timers. Lab Chip. 2007;7:1449–1453. doi: 10.1039/b708764k. [DOI] [PubMed] [Google Scholar]
- 13.Kartalov EP, Walker C, Taylor CR, Anderson WF, Scherer A. Microfluidic vias enable nested bioarrays and autoregulatory devices in Newtonian fluids. Proc. Natl Acad. Sci. USA. 2006;103:12280–12284. doi: 10.1073/pnas.0602890103. [DOI] [PMC free article] [PubMed] [Google Scholar]
- 14.Leslie DC, et al. Frequency-specific flow control in microfluidic circuits with passive elastomeric features. Nature Physics. 2009;5:231–235. [Google Scholar]
- 15.Chen PJ, Rodger DC, Humayun MS, Tai YC. Floating-disk parylene microvalve for self-regulating biomedical flow controls. MEMS 2008: 21st IEEE International Conference, Technical Digest. 2008;1080:575–578. [Google Scholar]
- 16.Langelier SM, Chang DS, Zeitoun RI, Burns MA. Acoustically driven programmable liquid motion using resonance cavities. Proc. Natl Acad. Sci. USA. 2009;106:12617–12622. doi: 10.1073/pnas.0900043106. [DOI] [PMC free article] [PubMed] [Google Scholar]
- 17.Stone HA. Tuned-in flow control. Nature Physics. 2009;5:178–179. [Google Scholar]
- 18.Hayes JP. Introduction to Digital Logic Design. Reading, MA: Addison-Wesley; 1993. p. 391. [Google Scholar]
- 19.Bahrami M, Yovanovich MM, Culham JR. Pressure drop of fully-developed, laminar flow in microchannels of arbitrary cross-section. J. Fluids Eng. 2006;128:1036–1044. [Google Scholar]
- 20.Zengerle R, Richter M. Simulation of microfluid systems. J. Micromech. Microeng. 1994;4:192–204. [Google Scholar]
- 21.Bourouina T, Grandchamp J-P. Modeling micropumps with electrical equivalent networks. J. Micromech. Microeng. 1996;6:398–404. [Google Scholar]
- 22.Gerlach T. Microdiffusers as dynamic passive valves for micropump applications. Sensors and Actuators A. 1998;69:181–191. [Google Scholar]
- 23.Gundelfinger ED, Kessels MM, Qualmann B. Temporal and spatial coordination of exocytosis and endocytosis. Nat Rev Mol Cell Biol. 2003;4:127–139. doi: 10.1038/nrm1016. [DOI] [PubMed] [Google Scholar]
- 24.Weigle DS, Koerker DJ, Goodner CJ. Pulsatile glucagon delivery enhances glucose production by perifused rat hepatocytes. Am J Physiol. 1984;247:E564–E568. doi: 10.1152/ajpendo.1984.247.4.E564. [DOI] [PubMed] [Google Scholar]
- 25.Robertson A, Drage DJ, Cohen MH. Control of aggregation in Dictyostelium discoideum by an external periodic pulse of cyclic adenosine monophosphate. Science. 1972;175:333–335. doi: 10.1126/science.175.4019.333. [DOI] [PubMed] [Google Scholar]
- 26.Hayes JP. Introduction to Digital Logic Design. Reading, MA: Addison-Wesley; 1993. pp. 140–213. [Google Scholar]
Associated Data
This section collects any data citations, data availability statements, or supplementary materials included in this article.


