Abstract
A population of uncoupled neurons can often be brought close to synchrony by a single strong inhibitory input pulse affecting all neurons equally. This mechanism is thought to underlie some brain rhythms, in particular gamma frequency (30–80 Hz) oscillations in the hippocampus and neocortex. Here we show that synchronization by an inhibitory input pulse often fails for populations of classical Hodgkin–Huxley neurons. Our reasoning suggests that in general, synchronization by inhibitory input pulses can fail when the transition of the target neurons from rest to spiking involves a Hopf bifurcation, especially when inhibition is shunting, not hyperpolarizing. Surprisingly, synchronization is more likely to fail when the inhibitory pulse is stronger or longer-lasting. These findings have potential implications for the question which neurons participate in brain rhythms, in particular in gamma oscillations.
Keywords: Hodgkin–Huxley model, Synchronization, Type II neurons, Gamma oscillations, Shunting inhibition
Introduction
Transient synchronization of neurons is believed to be common in the brain and important for brain function. In a seminal paper, van Vreeswijk et al. (1994) showed that often synaptic inhibition, not excitation, leads to synchronized activity. Fast-spiking inhibitory interneurons are believed to play the central role, in particular, in the generation of gamma (30–90 Hz) rhythms (Traub et al. 1997; Whittington et al. 2000; Traub et al. 2003; Csicsvari et al. 2003; Hájos et al. 2004; Mann et al. 2005; Compte et al. 2008).
Arguably the simplest example of synchronizing inhibition is that of a population of uncoupled neurons receiving a common strong inhibitory input pulse. Such a pulse can transiently drive all neurons of its target population towards a common quasi-steady state, thereby driving them (that is, the quantities characterizing their states, such as membrane potentials and ionic gating variables) towards each other. This is the foundation of the “PING” (Pyramidal-Interneuronal Network Gamma) mechanism (Whittington et al. 2000; Börgers and Kopell 2003, 2005), in which gamma rhythms arise from the interaction between excitatory pyramidal cells (E-cells) and inhibitory fast-spiking interneurons (I-cells): Spike volleys of the I-cells synchronize the E-cells, and spike volleys of the E-cells trigger synchronous spike volleys of the I-cells.
In this paper, we take another look at the approximate synchronization of a population of neurons by a single inhibitory pulse, and find that it often fails for the most famous of all neuronal models, the classical Hodgkin–Huxley model. The reason lies in the nature of the transition from excitability to spiking. For the Hodgkin–Huxley model, this transition involves a subcritical Hopf bifurcation. For many other neuronal models, on the other hand, it involves a saddle-node bifurcation on an invariant cycle. The simplest model of the latter kind is the theta neuron (Ermentrout and Kopell 1986; Hoppensteadt and Izhikevich 1997; Gutkin and Ermentrout 1998). Neuronal models are often called of type I if the transition from rest to spiking involves a saddle-node bifurcation on an invariant cycle, and of type II if it involves a Hopf bifurcation (Rinzel and Ermentrout 1998; Gutkin and Ermentrout 1998; Ermentrout 1996).
For both type I and type II neurons, a sufficiently strong inhibitory pulse introduces an attracting quasi-steady state. For the classical Hodgkin–Huxley neuron and other type II neuronal models, this quasi-steady state is a focus, i.e., the center of a spiral; as the inhibition decays, it turns from attracting to (weakly) repelling. For the theta neuron, on the other hand, and for other model neurons of type I, the attracting quasi-steady state is a node, which is annihilated altogether in a saddle-node collision as the inhibition decays. As we will show, this difference gives rise to crucial differences in synchronization behavior. Theta neurons are easily synchronized by a pulse of inhibition, provided only that the pulse is strong and long-lasting enough. On the other hand, for classical Hodgkin–Huxley neurons, synchronization by a pulse of inhibition is fragile. It often fails when the inhibition is shunting (that is, when the reversal potential is near the resting potential). Surprisingly, it is more likely to fail, even for hyperpolarizing inhibition, for stronger and longer-lasting inhibitory pulses.
We expect these results to have significance for the question which neurons in the brain participate in or are entrained by gamma oscillations. We mention three potential examples here; see Discussion for further comments. First, cortical pyramidal cells can switch between type II and type I by means of cholinergic modulation (Ermentrout et al. 2001; Jeong and Gutkin 2007; Stiefel et al. 2008, 2009). This suggests a new mechanism that may underlie the link between cholinergic modulation and gamma oscillations: By changing pyramidal cells from type II to type I, cholinergic modulation may facilitate synchronization by strong inhibitory pulses. We note that cholinergic modulation is known to facilitate gamma rhythms (Buhl et al. 1998; Fisahn et al. 1998; Rodriguez et al. 2004). Second, our results suggest a new reason why purely inhibition-based (“ING”) gamma oscillations (Whittington et al. 1995, 2000) may be fragile: Fast-spiking inhibitory interneurons appear to be of type II (Erisir et al. 1999; Kawaguchi 1995; Tateno et al. 2004), and inhibition among fast-spiking interneurons has been reported to be shunting, not hyperpolarizing (Bartos et al. 2007). Third, in addition to the fast-spiking, parvalbumin-positive interneurons thought to be at the core of mechanisms underlying gamma rhythms, there are a vast array of other types of inhibitory interneurons in the hippocampus (Somogyi and Klausberger 2005) and neocortex (Markram et al. 2004; Otsuka and Kawaguchi 2009). Which of these interneurons participate in oscillations, and under which circumstances, is largely unknown. Our work suggests that the nature of the transition from rest to spiking may be relevant to this question.
Methods
We describe here the models used in our computational study.
The theta neuron
The theta model (Ermentrout and Kopell 1986; Hoppensteadt and Izhikevich 1997; Gutkin and Ermentrout 1998) represents a neuron by a point P = (cosθ, sinθ) moving on the unit circle in the plane. This is analogous to Hodgkin–Huxley-like, conductance-based models, which represent a periodically spiking space-clamped neuron by a point moving on a limit cycle in a higher-dimensional phase space. In the absence of synaptic input, the differential equation defining the theta neuron is
 |
1 |
Here t should be thought of as time measured in milliseconds (see Börgers and Kopell 2003, Section 2) and I as the analogue of an external input current. For I < 0, Eq. (1) has exactly two fixed points in ( − π,π), namely
 |
2 |
(The second equality in Eq. (2) is a consequence of the angle doubling formula for the cosine function.) The fixed point  is stable, and
  is unstable. As I increases, the fixed points approach each other. As I crosses 0 from below, a saddle-node bifurcation occurs: The fixed points collide at
  , and there are no fixed points for I > 0. For a theta neuron, to “spike” means, by definition, to reach θ = π (modulo 2 π). For I > 0, the theta neuron spikes with period
 |
The transition from I < 0 to I > 0 is the analogue of the transition from excitability to spiking in a neuron.
The theta neuron with inhibitory input
The effect of adding an exponentially decaying inhibitory term to Eq. (1) was discussed in detail in Börgers and Kopell (2003, 2005). Following Börgers and Kopell (2003), we model the inhibition as follows:
 |
3 |
where g > 0 is the strength of the pulse of inhibition, t ∗ is its arrival time, and τ i its decay time constant. We primarily focus on τ i = 10, since the decay time constant of GABAA-receptor mediated inhibition is on the order of 10 ms. However, we will also discuss the effects of varying τ i.
Equation (3) can be derived from the quadratic integrate-and-fire neuron with an exponentially decaying inhibitory current input term added to the right-hand side. A variation on this equation is obtained when starting with the quadratic integrate-and-fire neuron with an exponentially decaying inhibitory synaptic input term added to the right hand side, in the form  , where V denotes the membrane potential, g the maximal synaptic conductance, and V
syn the synaptic reversal potential (see Börgers and Kopell, 2005, for a detailed derivation). However, the difference between current inputs (Börgers and Kopell 2003) and synaptic inputs (Börgers and Kopell 2005) is not crucial in the current context. Here we will use current inputs, i.e., Eq. (3), for simplicity.
E/I networks of theta neurons
Here we specify the model underlying Fig. 3; the figure itself will be discussed in detail in Section 3.4. Figure 3 shows a spike rastergram resulting from a simulation of a network of 400 excitatory theta neurons (E-cells) and 100 inhibitory theta neurons (I-cells). All details of this simulation were as in Börgers and Kopell (2003), Fig. 1(b), with the following three exceptions. (1) Connectivity was all-to-all here, whereas it was sparse and random in Börgers and Kopell (2003), Fig. 1(b). (2) The (random) initializations were not the same. (3) We simulated only 100 ms here, whereas 200 ms were simulated in Börgers and Kopell (2003). As in Börgers and Kopell (2003), τ i = 10 in Fig. 3.
Fig. 3.
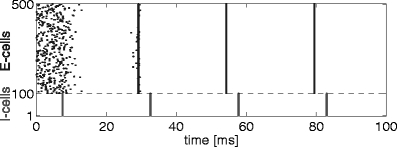
Gamma oscillation in a network of 400 excitatory and 100 inhibitory theta neurons
The classical Hodgkin–Huxley neuron
The classical Hodgkin–Huxley equations (Hodgkin and Huxley 1952) for the space-clamped squid giant axon are
 |
4 |
 |
5 |
 |
6 |
 |
7 |
The letters C, V, t, g, and I denote capacitance density, voltage, time, conductance density, and current density, respectively. The units used for these quantities are  F/cm2, mV, ms, mS/cm2, and
  A/cm2, respectively. For brevity, units will often be omitted from here on. Up to a change in notation, the parameter values that Hodgkin and Huxley chose are V
Na = 45, V
K = − 82, V
L = − 59.387, g
Na = 120, g
K = 36, g
L = 0.3, and C = 1. The letters m, h, and n denote the gating variables, which are dimensionless real numbers between 0 and 1. The rate functions α
x and β
x, x = m,h,n , are given by
 |
8 |
 |
9 |
 |
10 |
 |
11 |
 |
12 |
 |
13 |
Although of course a Hodgkin–Huxley model neuron has spikes of positive width, we say that there is a spike “at time t 0” if
 |
14 |
The classical Hodgkin–Huxley neuron with inhibitory input
To model synaptic inhibition, we modify Eq. (4) by adding a term of the form
 |
15 |
to the right-hand side. Constant inhibitory input corresponds to
 |
for all t. A decaying pulse of inhibition is modeled by
 |
16 |
where t ∗ denotes the arrival time of the inhibitory pulse. The parameter V syn is the synaptic reversal potential, and g is the maximum conductance associated with the synaptic input. The reversal potential of GABAergic synapses can be below the resting potential (hyperpolarizing inhibition), at the resting potential (shunting inhibition), or even above the resting potential (Isaev et al. 2007; Jeong and Gutkin 2007; Lu and Trussell 2001). We will experiment with the values V syn = − 80 (hyperpolarizing inhibition) and V syn = − 65 (shunting inhibition) in this paper.
E/I networks in which the E-cells are classical Hodgkin–Huxley neurons
We will present simulations of networks in which the E-cells are classical Hodgkin–Huxley neurons (Eqs. (4)–(13)). The external drive I in Eq. (4) will in this context be denoted by I e. Some of our simulations include a heterogeneous drive to the E-cells. By this we always mean that the external drive to the j-th E-cell is
 |
17 |
where the X j are independent Gaussian random variables with mean 0 and variance 1. The drives I e,j are time independent. However, in the simulations in which drive to the E-cells is heterogeneous, we also add time-dependent noisy drive. This is done by adding a term to the right-hand side of the equation describing the time evolution of the membrane potential of the j-th E-cell in the form
 |
18 |
where the functions s stoch,j jump to 1 at random times, and decay exponentially with time constant 3 ms between jumps. The jumps occur on Poisson schedules with mean frequency 10 Hz. The noisy inputs to different E-cells are independent of each other. Equation (18) is intended to mimic the effect of excitatory synaptic input pulses arriving at random times. The decay time constant of 3 ms is motivated by the fact that the decay time constant of AMPA-receptor mediated glutamatergic synapses is on the order of 3 ms.
In the model networks in which the E-cells are classical Hodgkin–Huxley neurons, the I-cells are Wang–Buzsáki model neurons (Wang and Buzsáki 1996). The Wang–Buzsáki neuron has the same general form as the classical Hodgkin–Huxley neuron (Eqs. (4)–(7)). However, the differential equation for the gating variable m, Eq. (5), is replaced by
 |
and the parameters are V Na = 55, V K = − 90, V L = − 65, g Na = 35, g K = 9, g L = 0.1. As for the classical Hodgkin–Huxley neuron, C = 1. The rate functions α x and β x, x = m,h,n, are given by
 |
19 |
 |
20 |
 |
21 |
 |
22 |
 |
23 |
 |
24 |
The external drive to the I-cells is denoted by I i. Heterogeneity and noise in external inputs are modeled for the I-cells in precisely the same way as for the E-cells.
At least some fast-spiking inhibitory interneurons are of type II (Erisir et al. 1999; Kawaguchi 1995; Tateno et al. 2004). We decided nonetheless to use the Wang–Buzsáki model neuron, which is of type I, in this study. Our focus here is on the role that the type of the E-cells plays in the PING mechanism. For this mechanism, we believe the type of the I-cells to be largely irrelevant; see also Discussion (Section 4.5).
We adopt the synaptic model of Ermentrout and Kopell (1998). Each synapse is characterized by a synaptic gating variable s associated with the presynaptic neuron, with 0 ≤ s ≤ 1, which evolves according to the equation
 |
where ρ denotes a smoothed Heaviside function:
 |
and τ R and τ D are the rise and decay time constants, respectively. To model the synaptic input from neuron j to neuron k, we add to the right-hand side of the equation governing the membrane potential V k of neuron k a term of the form
 |
where g jk denotes the maximal conductance associated with the synapse, s j denotes the gating variable associated with neuron j, and V syn denotes the synaptic reversal potential.
We use the notation V syn,e and V syn,i for the reversal potentials associated with excitatory and inhibitory synapses, respectively, τ R,e and τ D,e for the rise and decay time constants of excitatory synapses, and τ R,i and τ D,i for the rise and decay time constants of inhibitory synapses. We always use τ R,e = 0.1, τ D,e = 3, and V syn,e = 0, values reminiscent of AMPA-receptor-mediated glutamatergic synapses. We use τ R,i = 0.3, but vary τ D,i and V syn,i. In most simulations, we use τ D,i = 10, reminiscent of GABAA-receptor-mediated synapses.
Our model networks of Hodgkin–Huxley and Wang–Buzsáki neurons include 40 E-cells and 10 I-cells. The connectivity is all-to-all. We take the maximal conductance of the synaptic connection from the j-th I-cell to the k-th E-cell to be g ie/10, where g ie is independent of j and k. Thus the maximum possible value of the sum of all inhibitory conductances affecting an E-cell is g ie. Similarly, the maximal conductance of the connection from an E-cell to an I-cell is g ei/40, and the maximal conductance of the connection from an I-cell to an I-cell is g ii/10. We do not include E→E synapses in these simulations.
We always use g ei = 0.2. This parameter is chosen so that a population spike volley of the E-cells promptly triggers a population spike volley of the I-cells, but does not cause I-cells to spike multiple times. Unless otherwise indicated, we use g ii = 0.1. PING does not require the presence of I→I synapses, but they significantly stabilize the rhythm (Börgers and Kopell 2005). We experiment with various values of g ie.
Visualizing the synchronizing effect of inhibition
To illustrate the synchronizing effect of a pulse of inhibition, we consider a model neuron (either a theta neuron, or a classical Hodgkin–Huxley neuron), with constant drive I above the spiking threshold. We denote by T the natural period of the neuron, that is, the period that would be seen without any additional input.
We assume that at time t = 0, the neuron spikes. For a theta neuron, this means θ = − π mod 2 π. For a classical Hodgkin–Huxley neuron, it means V = 0 and dV/dt > 0 (compare Eq. (14)). For the classical Hodgkin–Huxley neuron, we also assume, in addition to V(0) = 0 and dV/dt(0) > 0, that the point (V(0),m(0),h(0),n(0)) lies on the limit cycle. (These conditions uniquely determine m(0), h(0), and n(0).) We now consider an inhibitory pulse arriving at some time t ∗ with 0 < t ∗ < T. We denote by t 1 and t 2 the times of the first and second spikes following time t ∗ , respectively, and define
 |
Plots of T 1 and T 2 as functions of t ∗ , as for instance in Fig. 1, help visualize the synchronizing effect of inhibition. Immediate and perfect synchronization would correspond to T 1 being independent of t ∗ : If the delay between the arrival of the inhibitory pulse and the next spike is independent of the phase at which the pulse arrives, then all neurons resume spiking at the same time following the inhibitory pulse.
Fig. 1.
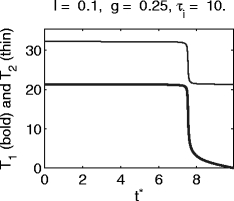
Graphs of T 1 and T 2, the time delays between the arrival time t ∗ of the inhibitory pulse and the first and second spikes following it, respectively, for the theta neuron. Here and in later figures, relevant parameter values are shown at the top
Numerics
All differential equations were solved using the midpoint method, with the fixed time step Δ t = 0.02. All codes are available from the first author upon request.
Results
Synchronization of theta neurons by a pulse of inhibition
The effect of adding an exponentially decaying inhibitory term to Eq. (1), as shown in Eq. (3), was discussed in detail in Börgers and Kopell (2003, 2005). We review some of the material from Börgers and Kopell (2003, 2005) here, and add, in Section 3.3, a discussion of the parameter regime in which an inhibitory pulse synchronizes effectively.
First, to illustrate the synchronization resulting from an inhibitory pulse, we show in Fig. 1 the delays T
1 and T
2 between the arrival time t
∗ of a pulse of inhibition and the next two spikes (see Section 2.7). T
1 and T
2 depend on I, g, and τ
i. Figure 1 shows the example I = 0.1 (thus  ), g = 0.25, and τ
i = 10. In this example, T
1 is approximately independent of t
∗ as long as t
∗ is not too close to T. Thus most neurons in an asynchronous population will be brought to approximate synchrony by a single pulse of inhibition. Only those neurons that are quite close to spiking when the inhibition arrives (t
∗ ≈ T) will escape. These neurons will spike soon after the arrival of the inhibitory pulse. However, Fig. 1 also shows that nearly all of those neurons will spike a second time at approximately the same time at which the others spike first. Thus a single pulse of inhibition comes very close to synchronizing the entire population.
The mathematics underlying this synchronization effect were discussed in Börgers and Kopell (2003). There, the synchronization was interpreted as the effect of an attracting “river” (Diener 1985a, 1985bb)1 in a phase plane parameterized by θ and the variable  . We will review and discuss the “river” picture below. Briefly, and without making reference to the geometry, the mechanism can be described as follows. If g > I, the inhibitory pulse transiently creates an attracting quasi-steady state, which is initially located at
 |
(compare Eq. (2)). While the inhibition decays, trajectories track this quasi-steady state, and thereby approach each other.
The river picture for theta neurons
We briefly review here the “river” picture described in Börgers and Kopell (2003, 2005), and add some observations relevant to the present work. We consider a theta neuron with an inhibitory pulse arriving at time t ∗ = 0:
 |
25 |
If g > I, the inhibitory pulse creates a quasi-steady state. As inhibition decays, this quasi-steady state moves. As explained in detail in Börgers and Kopell (2003, 2005), the trajectory is exponentially attracted to a stable river that is close to, but not identical with the quasi-steady state. As a result, the time T at which θ reaches π (the “spike time”) is nearly independent of θ(0), implying synchronization.
We note that trajectories with different initial conditions typically come far closer to each other (and to the stable river) than to the quasi-steady state. This point, which will play a role later on, is demonstrated by Fig. 2, which shows θ as a function of t for several different initial conditions, together with the quasi-steady state (indicated in bold), for I = 0.1, g = 0.3, and τ i = 10.
Fig. 2.
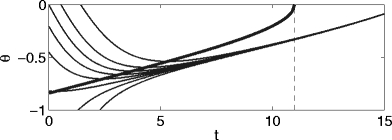
Graph of θ(t) for several different initial values θ(0), and the quasi-steady state (bold), for I = 0.1, g = 0.3, and τ i = 10. The dashed line indicates the time at which the quasi-steady state ceases to exist
Intuitively, the trajectories cannot come very close to the quasi-steady state because the quasi-steady state represents a “moving target”. The sense in which there is a nearby “stable river” that the trajectories do come very close to was explained in detail in Börgers and Kopell (2003, 2005).
On the parameter range in which a pulse of inhibition synchronizes a population of theta neurons
It is not easy to analyze rigorously for which values of I, g, and τ i tight synchrony will be obtained by a single pulse of inhibition. However, the following argument does come close to answering this question. At time t ∗ , the time constant associated with the approach to the stable quasi-steady state is the reciprocal of
 |
The stable quasi-steady state exists as long as
 |
that is, as long as
 |
This reasoning suggests (disregarding the fact that the quasi-steady state becomes less strongly attracting as the inhibition decays) that good synchronization should be expected as long as
 |
Numerical experiments indicate that indeed, for a surprisingly broad range of values of I, g, and τ i, synchronization by a single pulse of inhibition is quite tight if
 |
26 |
and fairly loose if
 |
27 |
with
 |
28 |
Note that τ 0 is small (and therefore synchronization occurs for moderate values of τ i) if g is sufficiently large in comparison with I; both g − I and g/I matter.
PING in E/I networks of theta neurons
Oscillations are common in networks of synaptically coupled excitatory and inhibitory theta neurons. In many cases, such oscillations can be understood as a consequence of the synchronization mechanism discussed in the preceding subsections. To illustrate this, Fig. 3 shows a spike rastergram representing the results of a simulation of an E/I network of theta neurons. This simulation is very similar to one presented in Börgers and Kopell (2003); see Methods for the details. At the start of the simulation, the E-cells spike asynchronously, and as a result the I-cells are gradually driven away from rest. Eventually, a population spike volley of the I-cells is triggered. The result is a strong common pulse of inhibition to all E-cells. Soon after the arrival of the inhibitory pulse, the activity in the E-cells halts. It resumes in near-synchrony approximately 25 ms later. Thus T 1, in the notation used earlier, is approximately 25 ms.
The time between the spike volley of the I-cells and the resumption of spiking in the E-cells depends, in general, on the decay time constant τ i of inhibition and, to a lesser extent, on the inhibitory conductances and external drives; see Eq. (3.12) of Börgers and Kopell (2003). The second spike volley of the I-cells, following the second spike volley of the E-cells, makes the synchrony perfect within plotting accuracy.
As discussed in Börgers and Kopell (2003, 2005), similar rhythms, called PING (Pyramidal-Interneuronal Network Gamma) rhythms (Whittington et al. 2000), generally occur in networks of excitatory and inhibitory theta neurons whenever the E-cells spike spontaneously at a sufficiently high rate, the I-cells spike only in response to the E-cells but not on their own, and the E→I and I→E synaptic connections are sufficiently strong.
Dynamics of the classical Hodgkin–Huxley neuron
The central point of this paper is that for classical Hodgkin–Huxley neurons, synchronization by inhibitory pulses does not always work in the same way as for theta neurons. To explain this point, we must first review some relevant dynamical properties of the Hodgkin–Huxley neuron.
Bifurcations in the classical Hodgkin–Huxley system (Eqs. (4)–(13)) have been studied in considerable detail (Hassard 1978). For I between I 0 ≈ 6.3 and I 1 ≈ 9.8, a stable focus and a stable limit cycle coexist. When I rises above I 1, the focus loses its stability in a subcritical Hopf bifurcation. For I < I 0, there is no stable limit cycle, and only a stable focus near V = − 70 mV exists.
In Section 3.6, we will refer to shunting inhibition, that is, inhibition with a reversal potential close to the equilibrium potential. It is of interest in this context to note that the equilibrium potential (and therefore the meaning of “shunting”) depends only mildly on the value of I < I 1. For instance, the equilibrium value V eq of the membrane potential V increases from approximately − 70 to approximately − 65 as I increases from 0 to I 1; see Fig. 4.
Fig. 4.
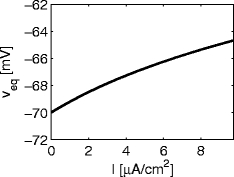
Graph of the equilibrium potential of the classical Hodgkin–Huxley equations as a function of I
Since we are interested in the effects of synaptic inhibition, we modify Eq. (4) by adding the term g (V syn − V) to the right-hand side, modeling constant inhibition; see Eq. (15). Numerical experiments indicate that bifurcations similar to those described above also occur when I > I 1 is fixed and g is varied. In a range of conductances g 0 < g < g 1, a stable limit cycle and a stable focus coexist. The focus loses its stability in a subcritical Hopf bifurcation when g falls below g 0. For g > g 1, there is no stable limit cycle, and only a stable focus remains. The values of g 0 and g 1 depend on I and V syn; Table 1 shows some examples.
Table 1.
For constant inhibition with g 0 < g < g 1, a stable limit cycle and a stable focus coexist
| V syn = − 80 | V syn = − 65 | |||
|---|---|---|---|---|
| g 0 | g 1 | g 0 | g 1 | |
| I = 10 | 0.0066 | 0.11 | 0.012 | 0.21 |
| I = 12 | 0.064 | 0.17 | 0.11 | 0.31 |
| I = 15 | 0.15 | 0.26 | 0.25 | 0.46 |
| I = 20 | 0.29 | 0.41 | 0.47 | 0.68 |
As g falls below g 0, the focus loses its stability in a subcritical Hopf bifurcation. For g > g 1, there is no stable limit cycle
Synchronization of classical Hodgkin–Huxley neurons by a pulse of inhibition
We consider a classical Hodgkin–Huxley neuron with I > I 1. We will again illustrate the effect of a decaying pulse of synaptic inhibition by plotting the time delays T 1 and T 2 between the arrival time t * of the inhibitory pulse and the first and second spike, respectively (see Section 2.7). Note that T 1 and T 2 now depend on the four parameters I, V syn, g, and τ I.
Before presenting the details, we summarize our findings. A sufficiently strong inhibitory pulse generates an attracting spiral. As inhibition decays, the spiral undergoes a Hopf bifurcation, becoming weakly repelling. If a population of Hodgkin–Huxley neurons are subjected to the same inhibitory pulse, they may synchronize (Section 3.6.1), but only if the inhibitory pulse does not bring the trajectories very close to the fixed point. If the trajectories do come very close to the fixed point by the time when the fixed point becomes weakly repelling again, they must take several turns around the fixed point before leaving its vicinity. The precise number of turns required is highly sensitive to the precise location of the trajectory at the time when the fixed point becomes unstable. This location is, of course, slightly dependent on initial conditions. As a result, different trajectories experience delays of substantially different durations, and synchronization fails. This effect is promoted if inhibition is shunting (Section 3.6.2), strong (Section 3.6.3), or long-lasting (Section 3.6.4).
Our arguments here will be heuristic, based on numerical results. Whether or not trajectories synchronize depends sensitively on their initialization, not just on local properties of the focus. A quantification of the delay effect and a rigorous mathematical analysis would therefore not be simple, and is beyond the scope of this paper.
Synchronization by a pulse of hyperpolarizing inhibition can work well
Figure 5 shows T 1 and T 2 for I = 12, V syn = − 80, g = 1, τ i = 10. Here T 1 is approximately independent of t ∗ as long as t ∗ is not too close to T, the period in the absence of inhibition. Only those neurons that are quite close to spiking when the inhibition arrives will escape, and will spike soon after the arrival of the inhibitory pulse. However, even most of those neurons will spike again at approximately the same time at which the others spike for the first time, as for the theta neuron (Fig. 1). This behavior is often seen for hyperpolarizing (V syn = − 80) inhibitory pulses; see, however, the examples of Figs. 11 and 12.
Fig. 5.
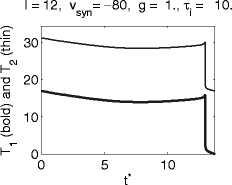
Graphs of T 1 and T 2, the delays between the arrival time t ∗ of the inhibitory pulse and the first and second spikes following it, respectively, for the classical Hodgkin–Huxley model with hyperpolarizing inhibition
Fig. 11.
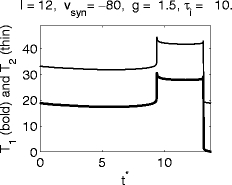
Graphs of T 1 and T 2, the delays between the arrival time t ∗ of the inhibitory pulse and the first and second spikes following it, respectively. Parameters as in Fig. 5, but with g increased from 1.0 to 1.5
Fig. 12.
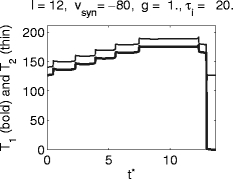
Graphs of T 1 and T 2, the delays between the arrival time t ∗ of the inhibitory pulse and the first and second spikes following it, respectively. Parameters as in Fig. 5, but with τ i twice as large (20 instead of 10)
A comparison of Fig. 5 with Fig. 1 shows that the synchronization is not as tight as for the theta neuron. One might think that this is a matter of the strength or duration of inhibition, and that with stronger or longer-lasting inhibition, tighter synchrony would be obtained. The opposite is the case, as will be shown in Sections 3.6.3 and 3.6.4: With stronger or longer-lasting inhibition, synchronization may fail altogether.
Synchronization by a pulse of shunting inhibition often fails
Figure 6 shows an example with shunting inhibition: I = 12, V syn = − 65, g = 1, τ i = 10. (The arrows indicate four values of t ∗ for which trajectories and voltage traces are plotted in Figs. 7 and 8.) Here it is evident that a single pulse of inhibition does not have a synchronizing effect at all.
Fig. 6.
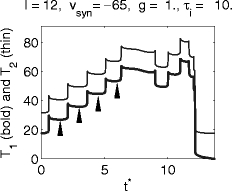
Graphs of T 1 and T 2, the delays between the arrival time t ∗ of the inhibitory pulse and the first and second spikes following it, respectively, for the classical Hodgkin–Huxley model with shunting inhibition. (Arrows indicate values of t ∗ for which trajectories and voltage traces are plotted in Figs. 7 and 8)
Fig. 7.
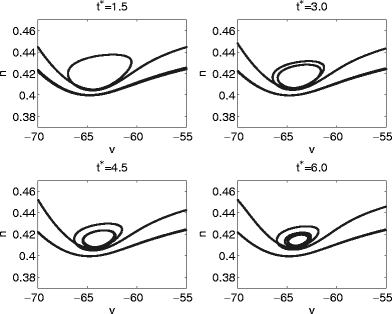
Projections of trajectories into the (V,n)-plane of the classical Hodgkin–Huxley neuron model for pulses with shunting inhibition corresponding to the values of t ∗ indicated by arrows in Fig. 6
Fig. 8.
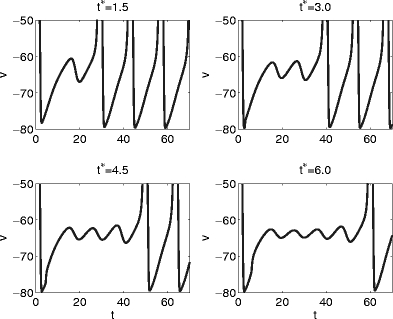
Voltage traces corresponding to the values of t ∗ indicated by arrows in Fig. 6
A look at individual trajectories explains Fig. 6. Figure 7 shows projections of the trajectories into the (V,n)-plane for t ∗ = 1.5, 3.0, 4.5, and 6.0, and Fig. 8 shows the corresponding voltage traces. The pulse of inhibition transiently creates a weakly attracting focus, which becomes weakly repelling as inhibition decays. If (V,m,h,n) is in the close vicinity of the focus when it loses its stability, the trajectory may have to follow one or several turns of the spiral before it escapes and another voltage spike can occur (Fig. 7). As the trajectory moves along the turns of the spiral, the membrane potential undergoes sub-threshold oscillations (Fig. 8). The values of T 1 and T 2 depend sensitively on the number of turns traced before the trajectory escapes. Each turn requires approximately the same amount of time, approximately 10 ms in the example of Fig. 6. This explains the staircase-like nature of the graphs in Fig. 6.
A particularly striking example of the same phenomenon is given in Fig. 9. In this example, I = 10, V syn = − 65, g = 1, and τ i = 10. Depending on the exact value of t ∗ , an inhibitory pulse can cause a very long delay, corresponding to many sub-threshold oscillations, before spiking resumes. Note that for t ∗ = 7 (right panel of Fig. 9), the resumption of spiking occurs only after inhibition has decayed by many orders of magnitude. The timing of the resumption of spiking has nothing to do with the decay time constant of inhibition here.
Fig. 9.
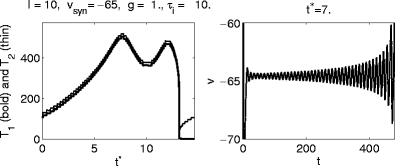
A particularly striking example of failure of synchronization. Left: Graphs of T 1 and T 2, the delays between the arrival time t ∗ of the inhibitory pulse and the first and second spikes following it, respectively. Right: Voltage trace for t ∗ = 7
What distinguishes cases like that of Fig. 5 from those of Figs. 6, 7, 8, and 9? Approximate synchronization fails if some trajectories are “trapped” in the vicinity of a focus, as shown very clearly in Fig. 7. This suggests that synchronization should fail if and only if the inhibitory pulse triggers, for some values of t ∗ , sub-threshold oscillations, as in Figs. 8 and 9. Indeed there are no sub-threshold oscillations in the voltage traces of the trajectories of Fig. 5. This is demonstrated in Fig. 10, which shows, for the same parameter values as in Fig. 5, voltage traces for four values of t ∗ .
Fig. 10.
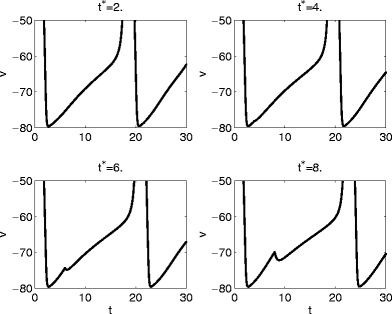
Voltage traces for the example of Fig. 5, for four different values of t ∗
Synchronization by a pulse of hyperpolarizing inhibition may fail when inhibition is too strong
For type I neurons, a stronger inhibitory pulse always has a more strongly synchronizing effect (see (26)–(28)). For classical Hodgkin–Huxley neurons, the opposite is sometimes the case: A stronger inhibitory pulse may bring some trajectories so close to the quasi-steady state that they must spend a long time spiraling around it even after it becomes (weakly) repelling, as shown in Fig. 7. This is illustrated by Fig. 11, where the value of g, which was 1.0 in Fig. 5, has been raised to 1.5. Depending on t ∗ , there may or may not be a subthreshold oscillation prior to the resumption of spiking in this example.
Synchronization by a pulse of hyperpolarizing inhibition may fail when inhibition decays too slowly
For type I neurons, synchronization improves with increasing decay time τ i (see inequalities (26) and (27) and the discussion preceding them). Again, for classical Hodgkin–Huxley neurons, the opposite can be the case: A longer-lasting inhibitory pulse may bring some trajectories so close to the quasi-steady state that they must spend a considerable amount of time spiraling away from it after it becomes repelling. This is illustrated by Fig. 12, where the value of τ i, which was 10 in Fig. 5, has been raised to 20. Notice that doubling τ i dramatically lengthens the time interval between the inhibitory pulse and the resumption of spiking. As pointed out earlier, the duration of this interval is not related to the time that it takes for inhibition to decay, but rather to the time that it takes to escape the weakly repelling focus after inhibition has decayed.
The river picture for classical Hodgkin–Huxley neurons
For the classical Hodgkin–Huxley neuron, there is a “river” just as for the theta neuron. However, there is a crucial difference: For the theta neuron, there is no quasi-steady state past the bifurcation, and no river. For the Hodgkin–Huxley neuron, there is an unstable quasi-steady state past the bifurcation, and there is an unstable river, i.e., a river that is exponentially stable in backward time. Trajectories follow the unstable river past the bifurcation, and are thereby exponentially repelled from each other; the synchronization achieved prior to the bifurcation can be undone as a result. Figure 13 shows V as a function of t for I = 15, v
syn = − 65, with an inhibitory conductance of  at time t, with g = 6 and τ
i = 10.
Fig. 13.
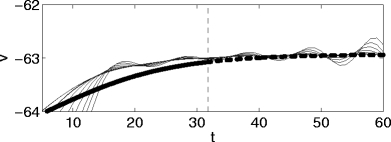
Voltage traces for the classical Hodgkin–Huxley neuron for I = 15, with an inhibitory pulse of strength 6 e − t/10 with reversal potential v syn = − 65. The quasi-steady state is shown in bold. At the time indicated by the dashed vertical line, it becomes unstable, and the oscillation amplitudes begin to increase
PING in E/I networks in which the E-cells are classical Hodgkin–Huxley neurons
Here we present numerical results for networks in which the E-cells are classical Hodgkin–Huxley neurons, and the I-cells are Wang–Buzsáki neurons (Wang and Buzsáki 1996); see Methods for details. We demonstrate that rhythms tend to break down when inhibition is shunting (Fig. 15), strong (Fig. 17), or long-lasting (Fig. 18)—that is, precisely in those circumstances when synchronization by a single inhibitory pulse does not work well. In addition, when the rhythm breaks down, there are sub-threshold oscillations in the membrane potentials of those E-cells that are silenced for longer periods of time. There is therefore ample, albeit indirect evidence suggesting that the disruption of the rhythms in Figs. 15, 17, and 18 is attributable to the mechanism explained in Sections 3.6 and 3.7.
Fig. 15.
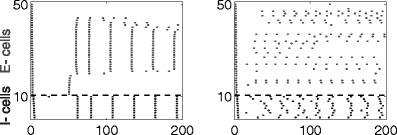
Same as Fig. 14, but with shunting, not hyperpolarizing inhibition
Fig. 17.
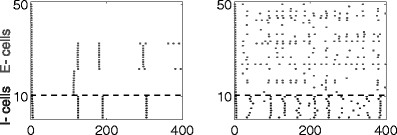
Same as Fig. 16, but with higher inhibitory conductance (g ie = 2)
Fig. 18.
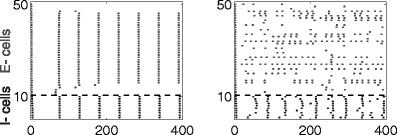
Same as Fig. 14, but with increased decay time constant of inhibition (τ D,i = 15)
PING can work well when inhibition is hyperpolarizing
Figure 14 shows results of network simulations with I e = 12, V syn,i = − 80 mV, g ie = 1, and τ D,i = 10 ms. The left panel of the figure shows results of a network without any heterogeneity and noise, and the right one shows results with heterogeneity and noise. When inhibition is hyperpolarizing, PING works for a broad range of parameters.
Fig. 14.
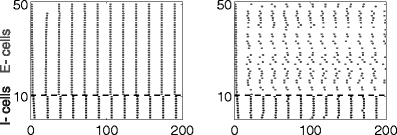
PING rhythm in a network of excitatory classical Hodgkin–Huxley neurons and inhibitory Wang–Buzsáki neurons, without and with heterogeneity and noise (left and right panels, respectively), when inhibition is hyperpolarizing (V syn,i = − 80)
PING typically breaks down when inhibition is shunting
The experiments of Fig. 15 are precisely like those of Fig. 14, except that V syn,i has been raised from − 80 to − 65 mV, so inhibition is now shunting rather than hyperpolarizing. In the absence of heterogeneity and noise (left panel), there is a PING rhythm, but now many E-cells are permanently suppressed. Which of the E-cells are suppressed depends on nothing other than the initialization. With heterogeneity and noise (right panel), the rhythm in the E-cells breaks down.
Note that in the right panel of Fig. 15, one does see a rhythm in the I-cells, even though there is none in the E-cells. This is a purely inhibition-based rhythm: The I-cells are excited by the (non-rhythmic) activity of the E-cells, and synchronize as a result of I→I-connections. To confirm this, we removed the I→I-synapses by setting g ii = 0, and saw the rhythm break down (data not shown). In more realistic models purely inhibition-based rhythms may be fragile for several reasons; see Discussion.
The gamma rhythm is not improved, but rather breaks down further, if g ie is raised in the simulations of Fig. 15. This is expected from our earlier discussion: Strengthening g ie makes it more likely for trajectories to be trapped in the spiral.
An increase in the inhibitory conductance can abolish PING even for hyperpolarizing inhibition
In spite of the simulation results shown in Fig. 11, an increase of g ie to 1.5 in the simulation of Fig. 14 does not abolish the PING oscillation (results not shown). It appears that here all trajectories avoid being trapped in the spiral, even for large g ie. There are, however, other cases in which an increase in g ie does abolish the PING oscillation. For instance, Fig. 16 shows the case I e = 10, V syn,i = − 80, g ie = 0.5, τ D,i = 10, again without and with heterogeneity and noise (left and right panels, respectively). (For these parameter values, many E-cells are suppressed.)
Fig. 16.
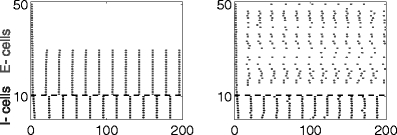
Same as Fig. 14, but with reduced drive (I e = 10 instead of 12) and reduced inhibitory conductance (g ie = 0.5 instead of 1)
Figure 17 shows results of the same simulation with a four-fold increase in the inhibitory conductance, i.e., g ie = 2. The rhythm is abolished. (Note that the time interval simulated in Fig. 17 is of duration 400 ms, i.e. twice as long as in the previous figures.)
An increase in the inhibitory decay time constant often abolishes PING even when inhibition is hyperpolarizing
Figure 18 shows results of a simulation similar to that of Fig. 14, but with the decay time constant of inhibition raised to τ D,i = 15. Without heterogeneity and noise, the increase in τ D,i from 10 to 15 leads to a dramatic slowdown of the rhythm. (Note that the simulated time interval in Fig. 18 is twice as long as in Fig. 14.) With heterogeneity and noise, the rhythm in the E-cells is lost altogether.
Does the delay effect occur in hippocampal or cortical pyramidal cells?
It is natural to ask to what extent the delay effect described in this paper affects the participation of pyramidal cells in the brain in rhythmic, synchronized firing. A conclusive answer to this question is subtle and beyond the scope of this paper, but we offer some relevant considerations here.
We have identified several features of the classical Hodgkin–Huxley model related to the delay effect: the Hopf bifurcation, the presence of an unstable focus, and subthreshold oscillations. These features are linked with type II excitability. Lengyel et al. (2005) reported evidence that hippocampal pyramidal cells have phase response curves (PRCs) of type II. (See Section 4.3 for a discussion of the link between bifurcation type and PRC type.) A number of recent studies have reported that cortical pyramidal cells can switch between type II and type I by means of cholinergic modulation (Ermentrout et al. 2001; Jeong and Gutkin 2007; Stiefel et al. 2008, 2009). This suggests that indeed the delay effect that we have described might play a role in gamma rhythms involving hippocampal or cortical pyramidal cells.
There are, of course, important differences between the classical Hodgkin–Huxley neuron and pyramidal cells in the brain. In particular, the Hodgkin–Huxley neuron spikes at approximately 50 Hz at the onset of firing. Pyramidal cells in the brain, by contrast, are usually capable of spiking at much lower frequencies, even when they have PRCs of type II. The delay effect that we have described occurs in the vicinity of the Hopf bifurcation, that is, at firing rates close to those seen at the onset of firing. We would therefore not expect to see it in a pyramidal cell firing at gamma frequency.
On the other hand, individual pyramidal cells often fire at low frequencies (10 Hz or even lower) while participating in a gamma rhythm (Cunningham et al. 2003). Under such circumstances, the delay effect may be seen in the pyramidal cells. When pyramidal cells participate in population rhythms at gamma frequency while spiking at much lower individual frequencies, stochastic fluctuations in excitability are thought to play a crucial role (Traub et al. 2000; Börgers et al. 2005). This complicates the issue, but the results in Section 3.8.4 suggest that noise can in fact amplify rather than reduce the impact of the delay effect in at least some circumstances.
Motivated by these considerations, we investigated whether type II models of cortical pyramidal cells do exhibit the delay effect near the onset of spiking. Stiefel et al. (2009) recently explored how intrinsic mechanisms affected by acetylcholine influence the phase response curve, using four different neuronal models: the theta neuron, a simple single-compartment Hodgkin–Huxley-like neuron, a complex single-compartment model, and a multi-compartment neuron. Their simple single-compartment model is based on the pyramidal cell model by Golomb and Amitai (1997). This model has the standard sodium and potassium currents, a persistent sodium current, and a slow potassium current modulated by acetylcholine. We found that this model shows the delay effect for firing frequencies near 10 Hz when the reversal potential for shunting inhibition is near −55 mV. The effect disappears for larger input currents, leading to higher firing rates.
The complex single-compartment neuron model of Stiefel et al. (2009) is an extension of the model of Golomb and Amitai (1997): Model M- and AHP (after-hyperpolarization) currents, I M and I AHP, were added. Because I AHP is Ca2 + -dependent, an L-type Ca2 + -current and an exponential Ca2 + decay representing a Ca2 + -buffer were included as well. Also, a hyperpolarization-activated mixed cation (depolarizing) current, I h, and an inactivating fast K + -current, I KA, were included. In the resulting model, we found the delay effect to be present for intrinsic firing frequencies up to about 15 Hz when the inhibitory reversal potential is in the range between −60 and −55 mV.
For illustration, Fig. 19 shows results similar to those of Fig. 6 for the complex single-compartment model (with cholinergic modulation) of Stiefel et al. (2009). We used the same parameter values as Stiefel et al. (2009) (see caption of Fig. 3 of Stiefel et al. 2009), the inhibitory conductance g = 2, and the inhibitory reversal potential v syn = − 60. The results in Fig. 19 were obtained with a constant drive which led to a firing rate of approximately 13 Hz in the absence of any inhibitory synaptic currents. Figure 19 clearly shows the presence of a phase-dependent delay, which would likely disrupt synchronization by inhibition in cells with the comparatively low level drive that we used. The largest delay effect was obtained when the reversal potential of the shunting inhibitory synapse was just below the firing threshold. When the difference between the firing threshold and the reversal potential for shunting inhibition increased, the variations in T became smaller.
Fig. 19.
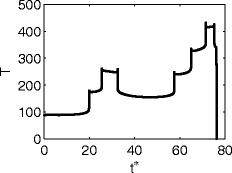
Analogous to Fig. 6, for the complex single-compartment pyramidal cell model of Stiefel et al.
For other type II models, the delay effect can be minor even near the Hopf bifurcation. For instance, Börgers et al. (2005) and Jeong and Gutkin (2007) used a reduced Traub–Miles neuron (Traub and Miles 1991; Ermentrout and Kopell 1998) with a model M-current (Crook et al. 1998); for this model, we found the delay effect to be very minor or absent altogether (depending on the strength of the M-current), even near the bifurcation.
Discussion
Related recent studies
We have demonstrated a mechanism that can make synchronization of type II neurons by inhibitory pulses fail, especially if the inhibition is shunting, strong, and/or long-lasting. At first sight, this result appears to be in contradiction with two other recent studies: Vida et al. (2006) and Jeong and Gutkin (2007).
Vida et al. (2006), reported that shunting inhibition yields more robust oscillations than hyperpolarizing inhibition. However, the simulations of Vida et al. (2006) were based on the Wang–Buzsáki model for interneurons (Wang and Buzsáki 1996). This model is of type I, and therefore our analysis does not apply to a network consisting exclusively of Wang–Buzsáki model neurons. However, there is evidence that at least some fast-spiking inhibitory interneurons are of type II (Erisir et al. 1999; Kawaguchi 1995; Tateno et al. 2004). We note that in our simulations, the I-cells are Wang–Buzsáki model neurons as well. In our simulations, the rhythms break down because the E-cells, not the I-cells are of type II.
Jeong and Gutkin (2007) found that for type II neurons, shunting or even depolarizing GABAergic synapses tend to lead to synchronization, whereas hyperpolarizing synapses tend to lead to anti-synchrony; see Fig. 9 of Jeong and Gutkin (2007), for instance. However, it should be noted that Jeong and Gutkin analyzed weak coupling, whereas our analysis refers to a strong coupling regime in which a single inhibitory pulse can synchronize a whole population. If gamma oscillations in fact play a role in attentional processing, as experimental evidence suggests (Jensen et al. 2007), one would expect that brain networks can create them rapidly, within tens of milliseconds. In vitro recordings (Whittington et al. 1995, Fig. 4) indicate that in fact stimulation can trigger gamma oscillations within tens of milliseconds. We therefore believe that strong inhibition, as assumed in our study, may well be relevant physiologically.
Similarity with elliptic bursting
The phenomenon that we have studied is analogous to the well-known phenomenon of elliptic bursting; see, for example, Wang and Rinzel (1995) for a review. Our explanation has been heuristic, along the lines set out in Wang and Rinzel (1995). A rigorous mathematical analysis would be outside the scope of this paper. Elliptic bursting occurs for a neuronal oscillator with two components, i) a fast subsystem, which in the simplest case can be two-dimensional, and ii) a slow variable (in the simplest case one-dimensional), which brings the system through the silent phase to the spiking phase and back to the silent phase (Wang and Rinzel 1995). The silent phase is characterized by small oscillations, initially contracting and subsequently expanding in amplitude, reflecting a slow passage through a Hopf bifurcation, as described by Baer et al. (1989) in the context of the FitzHugh–Nagumo equation with a slowly varying input current. A delay effect due to the slow passage was also described in Baer et al. (1989): The solution remains small, but undergoes a growing oscillation, for some time after passage through the Hopf bifurcation of the fast subsystem.
The problem studied in this paper is very similar. We have considered the Hodgkin–Huxley equations with slowly decaying inhibition, resulting in a slow passage through a Hopf bifurcation. The quasi-steady state undergoes a transition from a stable focus to an unstable focus. Near the unstable focus, the dynamics are expanding, and there is a potential for undoing the synchronization achieved during the phase when the focus is stable. On the other hand, for trajectories that never come very close to the focus, the inhibitory pulse can still have a synchronizing effect.
Bifurcation type vs. PRC type
To understand the possible implications of our conclusions, one needs to examine, for neurons in the brain, which type of bifurcation is involved in the transition from rest to spiking. This is not an easy task. However, indications can be obtained by studying phase response curves (PRCs), which can be measured experimentally (Galán et al. 2005; Netoff et al. 2005; Stiefel et al. 2008; Tsubo et al. 2007). The most common kind of PRCs describe the response of a periodically spiking neuron to an instantaneous injection of a small amount of positive charge. If such an injection always advances the next spike of the neuron, the PRC is called of type I; if the injection can advance or delay the neuron, depending on the phase at which it occurs, the PRC is called of type II. There appears to be an approximate correspondence between the type of a neuronal model from the point of view of bifurcation structure, and the type of the PRC: Neuronal models of type I usually have PRCs of type I, and type II models have PRCs of type II; see Ermentrout (1996) for supporting mathematical arguments, valid near the bifurcation point for type I models, and for type II models in which the Hopf bifurcation is supercritical. Unfortunately, there is no general theorem rigorously establishing the correspondence, and in fact there are counterexamples: There are parameters for which the Morris–Lecar model (Morris and Lecar 1981) is of type I from the point of view of bifurcation structure, but has a PRC of type II (Erik Sherwood, personal communication). Nonetheless it seems reasonable to take a PRC of type II as an indication of likely type II behavior from the point of view of bifurcation structure. We note that for the classical Hodgkin–Huxley neuron, there is no complication in this regard: The fixed point loses its stability in a Hopf bifurcation (Hassard 1978), and the PRC is of type II (Hansel et al. 1995, Fig. 2).
Transition from type II to type I through cholinergic modulation
Through a combination of analysis and computation, Ermentrout et al. (2001) have shown that down-regulation of a slow depolarization-activated potassium current such as the M-current I M (Brown and Adams 1980) can take the PRC of a model pyramidal cell from type II to type I. That the M-current tends to lead to PRCs of type II can intuitively be understood as follows. When a positive amount of charge is injected instantaneously, the membrane potential V jumps upwards. This causes a near-instantaneous rise in the spike-generating sodium current I Na, since the sodium gates open up rapidly as V rises. However, the hyperpolarizing (outward) M-current rises at the same time, as a result of the increase in V − V K. (Recall that the M-current is a potassium current; this is why the reversal potential V K appears here.) If the current injection occurs early in the cycle, when I Na is weak but the M-current, due to its long decay time constant, is still strong, the overall effect can be a decrease in the total driving current, which can persist for a significant time while the M-current decays, delaying the next spike.
We note in passing that the type II character of the PRC of the classical Hodgkin–Huxley neuron in fact arises from a similar mechanism, with the delayed rectifier potassium current I K playing a role similar to that played by the M-current in the previous paragraph (Prescott et al. 2008a). Although I K is much faster than the M-current, it is much slower than the spike-generating sodium current I Na.
The M-current is suppressed by the activation of muscarinic acetylcholine (ACh) receptors; this is how it gets its name (Brown and Adams 1980). Therefore the results of Ermentrout et al. (2001) suggest that ACh or cholinergic agonists might have the ability to turn PRCs of pyramidal neurons from type II to type I. This is confirmed by recent slice recordings of Stiefel et al. (2008), see also Prescott et al. (2008b). Stiefel et al. (2008) showed that the PRCs of pyramidal cells in layer 2/3 of mouse visual cortex turned from type II to type I as a result of application of the cholinergic agonist carbachol. In a computational companion paper (Stiefel et al. 2009), Stiefel et al. modeled three effects of ACh: down-regulation of I M, down-regulation of a calcium-dependent after-hyperpolarization current I AHP, and reduction of the leak conductance. The modeling confirmed that these changes tend to take the PRC from type II to type I, and suggested further that the down-regulation of I M is the crucial effect, in agreement with the earlier results of Ermentrout et al. (2001) showing that I M could cause a part of the PRC to be negative, but I AHP could not.
A link between cholinergic modulation and gamma rhythmicity is in fact thoroughly established experimentally (Buhl et al. 1998; Fisahn et al. 1998; Rodriguez et al. 2004). Mechanisms through which cholinergic modulation may promote gamma rhythmicity have been proposed by Börgers et al. (2005, 2008). In those models, cholinergic modulation enables gamma oscillations by increasing the excitability of the E-cells (Börgers et al. 2005) or decreasing the excitability of the I-cells (Börgers et al. 2008). Our results raise the question whether cholinergic modulation may also facilitate PING rhythms by turning pyramidal cells from type II to type I. No conclusive answer to this question is known at this time. Our preliminary investigation of pyramidal cell models (Section 3.9) suggests that the delay phenomenon is probably not relevant in a parameter regime in which individual pyramidal cells spike at gamma frequency, but may well be relevant in a parameter regime in which individual pyramidal cells spike at much lower frequencies. In this paper, we have focused on PING rhythms driven by strong deterministic input to the E-cells—“strong” PING rhythms in the terminology of Börgers and Kopell (2005) (see also Kopell et al. 2009). In a strong PING rhythm, each E-cell fires periodically at the population frequency. By contrast, in a “weak” PING rhythm (Börgers et al. 2005), the E-cells are driven stochastically, and each individual E-cell fires irregularly and at a mean frequency far below that of the population rhythm. Weak PING was proposed by Börgers et al. (2005) as a caricature of the kainate- or carbachol-induced “persistent” gamma oscillations seen in vitro in hippocampus and neocortex (Buhl et al. 1998; Fisahn et al. 1998; Cunningham et al. 2003; Dickson et al. 2000). In persistent gamma oscillations, each pyramidal cell fires at a mean frequency much below the gamma frequency, and in a seemingly random manner. The delay mechanism described here seems likely to be capable of disrupting such rhythms. We leave the detailed examination of this issue to a future study. In the present paper, our main aim has been to demonstrate and explain the general principle that synchronization by inhibitory pulses is more robust for cells of type I than for cells of type II.
Role of the type of the I-cells
We have not examined whether the type of the I-cells is relevant for PING. However, we believe that it probably is not. The PING mechanism does not depend on any subtleties of the dynamics of the I-cells; it merely requires that the I-cells respond promptly, by firing a spike volley, to a spike volley of the E-cells, and remain quiet in the absence of input from the E-cells. Most model I-cells will serve this purpose as long as their external drive is in the right range.
Gamma oscillations can also arise in purely inhibitory networks: Fast-spiking interneurons can synchronize as a result of synaptic interactions among them, with no need for the presence of excitatory cells. This mechanism, which is often called “ING” (Interneuronal Network Gamma) (Whittington et al. 1995, 2000) has been shown to be fragile when there is network heterogeneity (Wang and Buzsáki 1996; White et al. 1998), but can easily be stabilized by gap junctions among the inhibitory cells (Kopell and Ermentrout 2004; Traub et al. 2001). Our work suggests a new reason why the ING mechanism may be fragile: There is evidence that at least some fast-spiking inhibitory interneurons are of type II (Erisir et al. 1999; Kawaguchi 1995; Tateno et al. 2004), and, interestingly, Bartos et al. (2007) report that inhibition among fast-spiking interneurons tends to be shunting, not hyperpolarizing. In fact, preliminary numerical experiments (not shown here) suggest that ING with I-cells of type II is quite fragile, especially when inhibition is shunting, and may not easily be stabilized by gap junctional connections.
Recurrent excitation
We have shown that for classical Hodgkin–Huxley neurons, strong pulses of inhibition can have surprising effects. We note that recurrent excitation, which we have not included in this paper, can have counterintuitive effects for classical Hodkgin–Huxley neurons as well, for mathematically related reasons (Drover et al. 2004).
Summary
In summary, our work shows that the mechanism of synchronization by strong inhibitory pulses, the basis of the PING and ING mechanisms, depends on the bifurcation structure of the neurons being synchronized: It works well for type I neurons, but is much less robust for type II neurons. This fundamental point is likely to have important biological consequences.
Acknowledgements
This work was supported in part by U.S. National Science Foundation grant DMS0418832 to CB, a grant from the Faculty Research Awards Committee at Tufts University to CB, and Netherlands Organization for Scientific Research (NWO) grant 635.100.019 to SG.
Open Access
This article is distributed under the terms of the Creative Commons Attribution Noncommercial License which permits any noncommercial use, distribution, and reproduction in any medium, provided the original author(s) and source are credited.
Footnotes
Stable rivers correspond to stable Fenichel slow manifolds (Fenichel 1979). We use the more intuitive term ‘river’ in this paper.
References
- Baer SM, Erneux T, Rinzel J. The slow passage through a Hopf bifurcation: Delay, memory effects and resonance. SIAM Journal on Applied Mathematics. 1989;49:55–71. doi: 10.1137/0149003. [DOI] [Google Scholar]
- Bartos M, Vida I, Jonas P. Synaptic mechanisms of synchronized gamma oscillations in inhibitory interneuron networks. Nature Reviews Neuroscience. 2007;8(1):45–56. doi: 10.1038/nrn2044. [DOI] [PubMed] [Google Scholar]
- Börgers C, Epstein S, Kopell N. Background gamma rhythmicity and attention in cortical local circuits: A computational study. Proceedings of the National Academy of Sciences of the United States of America. 2005;102(19):7002–7007. doi: 10.1073/pnas.0502366102. [DOI] [PMC free article] [PubMed] [Google Scholar]
- Börgers C, Epstein S, Kopell N. Gamma oscillations mediate stimulus competition and attentional selection in a cortical network model. Proceedings of the National Academy of Sciences of the United States of America. 2008;105(46):8–18023. doi: 10.1073/pnas.0809511105. [DOI] [PMC free article] [PubMed] [Google Scholar]
- Börgers C, Kopell N. Synchronization in networks of excitatory and inhibitory neurons with sparse, random connectivity. Neural Computation. 2003;15(3):509–539. doi: 10.1162/089976603321192059. [DOI] [PubMed] [Google Scholar]
- Börgers C, Kopell N. Effects of noisy drive on rhythms in networks of excitatory and inhibitory neurons. Neural Computation. 2005;17(3):557–608. doi: 10.1162/0899766053019908. [DOI] [PubMed] [Google Scholar]
- Brown DA, Adams PR. Muscarinic suppression of a novel voltage-sensitive k+ current in a vertebrate neurone. Nature. 1980;283(5748):673–676. doi: 10.1038/283673a0. [DOI] [PubMed] [Google Scholar]
- Buhl, E. H., Tamás, G., & Fisahn, A. (1998). Cholinergic activation and tonic excitation induce persistent gamma oscillations in mouse somatosensory cortex in vitro. Journal of Physiology (London), 513 (Pt. 1):117–26. [DOI] [PMC free article] [PubMed]
- Compte A, Reig R, Descalzo VF, Harvey MA, Puccini GD, Sanchez-Vives MV. Spontaneous high-frequency (10–80 Hz) oscillations during up states in the cerebral cortex in vitro. Journal of Neuroscience. 2008;28(51):13828–13844. doi: 10.1523/JNEUROSCI.2684-08.2008. [DOI] [PMC free article] [PubMed] [Google Scholar]
- Crook SM, Ermentrout GB, Bower JM. Spike frequency adaptation affects the synchronization properties of networks of cortical oscillators. Neural Computation. 1998;10:837–854. doi: 10.1162/089976698300017511. [DOI] [PubMed] [Google Scholar]
- Csicsvari J, Jamieson B, Wise KD, Buzsáki G. Mechanisms of gamma oscillations in the hippocampus of the behaving rat. Neuron. 2003;37(2):311–322. doi: 10.1016/S0896-6273(02)01169-8. [DOI] [PubMed] [Google Scholar]
- Cunningham MO, Davies CH, Buhl EH, Kopell N, Whittington MA. Gamma oscillations induced by kainate receptor activation in the entorhinal cortex in vitro. Journal of Neuroscience. 2003;23:9761–9769. doi: 10.1523/JNEUROSCI.23-30-09761.2003. [DOI] [PMC free article] [PubMed] [Google Scholar]
- Dickson CT, Biella G, de Curtis M. Evidence for spatial modules mediated by temporal synchronization of carbachol-induced gamma rhythm in medial entorhinal cortex. Journal of Neuroscience. 2000;20:7846–7854. doi: 10.1523/JNEUROSCI.20-20-07846.2000. [DOI] [PMC free article] [PubMed] [Google Scholar]
- Diener F. Propriétés asymptotiques des fleuves. Comptes Rendus de l’AcadeÂmie des Sciences Paris. 1985;302:55–58. [Google Scholar]
- Diener M. Détermination et existence des fleuves en dimension 2. Comptes Rendus de l’AcadeÂmie des Sciences Paris. 1985;301:899–902. [Google Scholar]
- Drover J, Rubin J, Su J, Ermentrout B. Analysis of a canard mechanism by which excitatory synaptic coupling can synchronize neurons at low firing frequencies. SIAM Journal on Applied Mathematics. 2004;65(1):69–92. doi: 10.1137/S0036139903431233. [DOI] [Google Scholar]
- Erisir A, Lau D, Rudy B, Leonard CS. Function of specific K(+) channels in sustained high-frequency firing of fast-spiking neocortical interneurons. Journal of Neuroscience. 1999;82(5):2476–2489. doi: 10.1152/jn.1999.82.5.2476. [DOI] [PubMed] [Google Scholar]
- Ermentrout GB. Type I membranes, phase resetting curves, and synchrony. Neural Computation. 1996;8:879–1001. doi: 10.1162/neco.1996.8.5.979. [DOI] [PubMed] [Google Scholar]
- Ermentrout GB, Kopell N. Parabolic bursting in an excitable system coupled with a slow oscillation. SIAM Journal on Applied Mathematics. 1986;46:233–253. doi: 10.1137/0146017. [DOI] [Google Scholar]
- Ermentrout GB, Kopell N. Fine structure of neural spiking and synchronization in the presence of conduction delay. Proceedings of the National Academy of Sciences of the United States of America. 1998;95:1259–1264. doi: 10.1073/pnas.95.3.1259. [DOI] [PMC free article] [PubMed] [Google Scholar]
- Ermentrout GB, Pascal M, Gutkin BS. The effects of spike frequency adaptation and negative feedback on the synchronization of neural oscillators. Neural Computation. 2001;13:1285–1310. doi: 10.1162/08997660152002861. [DOI] [PubMed] [Google Scholar]
- Fenichel N. Geometric singular perturbation theory for ordinary differential equations. Journal of Differential Equations. 1979;31:53–98. doi: 10.1016/0022-0396(79)90152-9. [DOI] [Google Scholar]
- Fisahn A, Pike FG, Buhl EH, Paulsen O. Cholinergic induction of network oscillations at 40 Hz in the hippocampus in vitro. Nature. 1998;394(6689):186–189. doi: 10.1038/28179. [DOI] [PubMed] [Google Scholar]
- Galán RF, Ermentrout GB, Urban NN. Efficient estimation of phase-resetting curves in real neurons and its significance for neural-network modeling. Physical Review Letters. 2005;94(15):158101. doi: 10.1103/PhysRevLett.94.158101. [DOI] [PMC free article] [PubMed] [Google Scholar]
- Golomb D, Amitai Y. Propagating neuronal discharges in neocortical slices: Computational and experimental study. Journal of Neurophysiology. 1997;78:1199–1211. doi: 10.1152/jn.1997.78.3.1199. [DOI] [PubMed] [Google Scholar]
- Gutkin BS, Ermentrout GB. Dynamics of membrane excitability determine interspike interval variability: A link between spike generation mechanisms and cortical spike train statistics. Neural Computation. 1998;10:1047–1065. doi: 10.1162/089976698300017331. [DOI] [PubMed] [Google Scholar]
- Hájos N, Pálhalmi J, Mann EO, Németh B, Paulsen O, Freund TF. Spike timing of distinct types of GABAergic interneuron during hippocampal gamma oscillations in vitro. Journal of Neurophysiology. 2004;24(41):9127–9137. doi: 10.1523/JNEUROSCI.2113-04.2004. [DOI] [PMC free article] [PubMed] [Google Scholar]
- Hansel D, Mato G, Meunier G. Synchrony in excitatory neural networks. Neural Computation. 1995;7:307–337. doi: 10.1162/neco.1995.7.2.307. [DOI] [PubMed] [Google Scholar]
- Hassard B. Bifurcation of periodic solutions of the Hodgkin–Huxley model for the squid giant axon. Journal of Theoretical Biology. 1978;71:401–420. doi: 10.1016/0022-5193(78)90168-6. [DOI] [PubMed] [Google Scholar]
- Hodgkin AL, Huxley AF. A quantitative description of membrane current and its application to conduction and excitation in nerve. Journal of Physiology (London) 1952;117:500–544. doi: 10.1113/jphysiol.1952.sp004764. [DOI] [PMC free article] [PubMed] [Google Scholar]
- Hoppensteadt FC, Izhikevich EM. Weakly connected neural networks. New York: Springer; 1997. [Google Scholar]
- Isaev D, Isaeva E, Khazipov R, Holmes GL. Shunting and hyperpolarizing GABAergic inhibition in the high-potassium model of ictogenesis in the developing rat hippocampus. Hippocampus. 2007;17:210–219. doi: 10.1002/hipo.20259. [DOI] [PubMed] [Google Scholar]
- Jensen O, Kaiser J, Lachaux J-P. Human gamma-frequency oscillations associated with attention and memory. Trends in Neurosciences. 2007;30(7):24–317. doi: 10.1016/j.tins.2007.05.001. [DOI] [PubMed] [Google Scholar]
- Jeong HY, Gutkin B. Synchrony of neuronal oscillations controlled by GABAergic reversal potentials. Neural Computation. 2007;19:706–729. doi: 10.1162/neco.2007.19.3.706. [DOI] [PubMed] [Google Scholar]
- Kawaguchi Y. Physiological subgroups of nonpyramidal cells with specific morphological characteristics in layer II/III of rat frontal cortex. Journal of Neuroscience. 1995;15(4):55–2638. doi: 10.1523/JNEUROSCI.15-04-02638.1995. [DOI] [PMC free article] [PubMed] [Google Scholar]
- Kopell N, Börgers C, Pervouchine D, Malerba P, Tort ABL. Gamma and theta rhythms in biophysical models of hippocampal circuits. In: Cutsuridis V, Graham B, Cobb S, Vida I, editors. Hippocampal microcircuits: A computational modeler’s resource book. New York: Springer; 2010. [Google Scholar]
- Kopell N, Ermentrout B. Chemical and electrical synapses perform complementary roles in the synchronization of interneuronal networks. Proceedings of the National Academy of Sciences. 2004;101(43):15482–15487. doi: 10.1073/pnas.0406343101. [DOI] [PMC free article] [PubMed] [Google Scholar]
- Lengyel M, Kwag J, Paulsen O, Dayan P. Matching storage and recall: Hippocampal spike timing-dependent plasticity and phase response curves. Nature Neuroscience. 2005;8(12):1677–1683. doi: 10.1038/nn1561. [DOI] [PubMed] [Google Scholar]
- Lu T, Trussell L. Mixed excitatory and inhibitory GABA-mediated transmission in chick cholear nucleus. Journal of physiology. 2001;535:125–131. doi: 10.1111/j.1469-7793.2001.t01-1-00125.x. [DOI] [PMC free article] [PubMed] [Google Scholar]
- Mann EO, Suckling JM, Hájos N, Greenfield SA, Paulsen O. Perisomatic feedback inhibition underlies cholinergically induced fast network oscillations in the rat hippocampus in vitro. Neuron. 2005;45(1):105–117. doi: 10.1016/j.neuron.2004.12.016. [DOI] [PubMed] [Google Scholar]
- Markram H, Toledo-Rodriguez M, Wang Y, Gupta A, Silberberg G, Wu C. Interneurons of the neocortical inhibitory system. Nature Reviews Neuroscience. 2004;5(10):793–807. doi: 10.1038/nrn1519. [DOI] [PubMed] [Google Scholar]
- Morris C, Lecar H. Voltage oscillations in the barnacle giant muscle fiber. Biophysical journal. 1981;35(1):193–213. doi: 10.1016/S0006-3495(81)84782-0. [DOI] [PMC free article] [PubMed] [Google Scholar]
- Netoff TI, Banks MI, Dorval AD, Acker CD, Haas JS, Kopell N, et al. Synchronization in hybrid neuronal networks of the hippocampal formation. Journal of Neurophysiology. 2005;93(3):1197–1208. doi: 10.1152/jn.00982.2004. [DOI] [PubMed] [Google Scholar]
- Otsuka T, Kawaguchi Y. Cortical inhibitory cell types differentially form intralaminar and interlaminar subnetworks with excitatory neurons. Journal of Neuroscience. 2009;29(34):10533–10540. doi: 10.1523/JNEUROSCI.2219-09.2009. [DOI] [PMC free article] [PubMed] [Google Scholar]
- Prescott SA, Koninck YD, Sejnowski TJ. Biophysical basis for three distinct dynamical mechanisms of action potential initiation. PLoS Computational Biology. 2008;4:1–18. doi: 10.1371/journal.pcbi.1000198. [DOI] [PMC free article] [PubMed] [Google Scholar]
- Prescott SA, Ratté S, Koninck YD, Sejnowski TJ. Pyramidal neurons switch from integrators in vitro to resonators under in vivo-like conditions. Journal of neurophysiology. 2008;100:3030–3042. doi: 10.1152/jn.90634.2008. [DOI] [PMC free article] [PubMed] [Google Scholar]
- Rinzel J, Ermentrout GB. Analysis of neural excitability and oscillations. In: Koch C, Segev I, editors. Methods in neuronal modeling. Cambridge: MIT; 1998. pp. 251–292. [Google Scholar]
- Rodriguez R, Kallenbach U, Singer W, Munk MHJ. Short- and long-term effects of cholinergic modulation on gamma oscillations and response synchronization in the visual cortex. Journal of Neuroscience. 2004;24(46):10369–10378. doi: 10.1523/JNEUROSCI.1839-04.2004. [DOI] [PMC free article] [PubMed] [Google Scholar]
- Somogyi P, Klausberger T. Defined types of cortical interneurone structure space and spike timing in the hippocampus. Journal of Physiology (London) 2005;562:9–26. doi: 10.1113/jphysiol.2004.078915. [DOI] [PMC free article] [PubMed] [Google Scholar]
- Stiefel K, Gutkin B, Sejnowski T. Cholinergic neuromodulation changes phase response curve shape and type in cortical pyramidal neurons. PLoS ONE. 2008;3(12):3947. doi: 10.1371/journal.pone.0003947. [DOI] [PMC free article] [PubMed] [Google Scholar]
- Stiefel K, Gutkin B, Sejnowski T. The effects of cholinergic neuromodulation on neuronal phase-response curves of modeled cortical neurons. Journal of Computational Neuroscience. 2009;29:289–301. doi: 10.1007/s10827-008-0111-9. [DOI] [PMC free article] [PubMed] [Google Scholar]
- Tateno T, Harsch A, Robinson HPC. Threshold firing frequency–current relationships of neurons in rat somatosensory cortex: type 1 and type 2 dynamics. Journal of Neurophysiology. 2004;92:2283–2294. doi: 10.1152/jn.00109.2004. [DOI] [PubMed] [Google Scholar]
- Traub RD, Bibbig A, Fisahn A, LeBeau FEN, Whittington MA, Buhl EH. A model of gamma-frequency network oscillations induced in the rat CA3 region by carbachol in vitro. European Journal of Neuroscience. 2000;12:4093–4106. doi: 10.1046/j.1460-9568.2000.00300.x. [DOI] [PubMed] [Google Scholar]
- Traub RD, Cunningham MO, Gloveli T, LeBeau FEN, Bibbig A, Buhl EH, et al. GABA-enhanced collective behavior in neuronal axons underlies persistent gamma frequency oscillations. Proceedings of the National Academy of Sciences of the United States of America. 2003;86(19):11047–11052. doi: 10.1073/pnas.1934854100. [DOI] [PMC free article] [PubMed] [Google Scholar]
- Traub RD, Jefferys JGR, Whittington M. Simulation of gamma rhythms in networks of interneurons and pyramidal cells. Journal of Computational Neuroscience. 1997;4:141–150. doi: 10.1023/A:1008839312043. [DOI] [PubMed] [Google Scholar]
- Traub RD, Kopell N, Bibbig A, Buhl EH, Lebeau FEN, Whittington MA. Gap junctions between interneuron dendrites can Enhance long-range synchrony of gamma oscillations. Journal of Neuroscience. 2001;21:9478–9486. doi: 10.1523/JNEUROSCI.21-23-09478.2001. [DOI] [PMC free article] [PubMed] [Google Scholar]
- Traub RD, Miles R. Neuronal networks of the Hippocampus. Cambridge: Cambridge University Press; 1991. [Google Scholar]
- Tsubo Y, Takada M, Reyes AD, Fukai T. Layer and frequency dependencies of phase response properties of pyramidal neurons in rat motor cortex. European Journal of Neuroscience. 2007;25:3429–3441. doi: 10.1111/j.1460-9568.2007.05579.x. [DOI] [PubMed] [Google Scholar]
- van Vreeswijk C, Abbott LF, Ermentrout GB. When inhibition not excitation synchronizes neural firing. Journal of Computational Neuroscience. 1994;1:313–321. doi: 10.1007/BF00961879. [DOI] [PubMed] [Google Scholar]
- Vida I, Bartos M, Jonas P. Shunting inhibition improves robustness of gamma oscillations in hippocampal interneuron networks by homogenizing firing rates. Neuron. 2006;49(1):107–117. doi: 10.1016/j.neuron.2005.11.036. [DOI] [PubMed] [Google Scholar]
- Wang X-J, Buzsáki G. Gamma oscillation by synaptic inhibition in a hippocampal interneuronal network model. Journal of Neuroscience. 1996;16:6402–6413. doi: 10.1523/JNEUROSCI.16-20-06402.1996. [DOI] [PMC free article] [PubMed] [Google Scholar]
- Wang X-J, Rinzel J. Oscillatory and bursting properties of neurons. In: Arbib M, editor. Handbook of brain theory and neural networks. Cambridge: MIT; 1995. pp. 686–691. [Google Scholar]
- White J, Chow C, Ritt J, Soto-Trevino C, Kopell N. Synchronization and oscillatory dynamics in heterogeneous, mutually inhibited neurons. Journal of Computational Neuroscience. 1998;5:5–16. doi: 10.1023/A:1008841325921. [DOI] [PubMed] [Google Scholar]
- Whittington MA, Traub RD, Jefferys JGR. Synchronized oscillations in interneuron networks driven by metabotropic glutamate receptor activation. Nature. 1995;373:612–615. doi: 10.1038/373612a0. [DOI] [PubMed] [Google Scholar]
- Whittington MA, Traub RD, Kopell N, Ermentrout B, Buhl EH. Inhibition-based rhythms: Experimental and mathematical observations on network dynamics. International Journal of Psychophysiology. 2000;38:315–336. doi: 10.1016/S0167-8760(00)00173-2. [DOI] [PubMed] [Google Scholar]


