Abstract
Initial events in double-strand break repair by homologous recombination in vivo involve homology searching, 3′ strand invasion, and new DNA synthesis. While studies in yeast have contributed much to our knowledge of these processes, in comparison, little is known of the early events in the integrated mammalian system. In this study, a sensitive PCR procedure was developed to detect the new DNA synthesis that accompanies mammalian homologous recombination. The test system exploits a well-characterized gene targeting assay in which the transfected vector bears a gap in the region of homology to the single-copy chromosomal immunoglobulin μ heavy chain gene in mouse hybridoma cells. New DNA synthesis primed by invading 3′ vector ends copies chromosomal μ-gene template sequences excluded by the vector-borne double-stranded gap. Following electroporation, specific 3′ extension products from each vector end are detected with rapid kinetics: they appear after 0.5 hr, peak at 3–6 hr, and then decline, likely as a result of the combined effects of susceptibility to degradation and cell division. New DNA synthesis from each vector 3′ end extends at least ∼1000 nucleotides into the gapped region, but the efficiency declines markedly within the first ∼200 nucleotides. Over this short distance, an average frequency of 3′ extension for the two invading vector ends is ∼0.007 events/vector backbone. DNA sequencing reveals precise copying of the cognate chromosomal μ-gene template. In unsynchronized cells, 3′ extension is sensitive to aphidicolin supporting involvement of a replicative polymerase. Analysis suggests that the vast majority of 3′ extensions reside on linear plasmid molecules.
DOUBLE-STRANDED breaks (DSBs) in chromosomal DNA are important lesions in cells. They initiate “programmed” cellular recombination events, such as meiotic recombination, antibody and T-cell receptor gene rearrangements in the immune system, and mating type (MAT) switching in budding yeast (Haber 1998; Pierce et al. 2001; Aylon and Kupiec 2004; Bassing and Alt 2004). In addition, DNA breakage is a general feature of cellular DNA metabolic processes requiring topoisomerases or DNA repair proteins and can occur when migrating replication forks stall. DNA breaks arise from damage caused by reactive intermediates of normal cellular metabolism and by exposure to clastogenic chemicals and irradiation. In the absence of repair, DSBs may induce apoptosis or changes in chromosome number. Misrepair of DSBs can result in point mutations, deletions, and insertions or lead to gross chromosomal instability such as inversions and translocations that are causative or predisposing to cancer (Pierce et al. 2001).
Homologous recombination is an important pathway of repairing DSBs and its proper function is integral to cell survival (Wyman and Kanaar 2006). The repair of a DSB by homologous recombination involves 5′-to-3′ resection of the DNA ends, homology searching, strand invasion of the homologous template, and new DNA synthesis. Later steps in the recombination process can involve unwinding of the newly synthesized strand from the repair template to yield a noncrossover product or formation of a joint molecule bearing Holliday junctions that may be resolved to yield either crossover or noncrossover products (Pâques and Haber 1999; Li and Heyer 2008).
Studies of homologous recombination in yeast, mammalian cells, and other organisms have benefitted from analyzing repair of DSBs generated at specific sites in vivo by the endonucleases HO and I-SceI (Haber 2000; Johnson and Jasin 2001; Wei and Rong 2007). Current insight into the early initiation events of homologous recombination exploits the power of yeast genetics together with physical methods for monitoring specific changes in DNA structure associated with HO-induced DSB repair (Haber 1995; Haber 2000; Sugawara and Haber 2006). In budding yeast, mating-type preference is under control of the HO endonuclease, which introduces a programmed DSB at the MAT locus that is subsequently repaired by gene conversion with an adjacent MAT sequence far away on the same chromosome (Haber 1992). Inducible versions of HO endonuclease have been engineered that permit repair of a single DSB at the MAT locus, or in a MAT target sequence elsewhere in the genome, to be analyzed in both wild-type and mutant yeast strains. Time-course experiments have revealed that strand invasion and new DNA synthesis begin as early as 0.5 hr following an HO-endonuclease-induced DSB with noncrossover gene conversion products being detected within an hour (White and Haber 1990; Sugawara and Haber 1992; Aylon et al. 2003). Using these systems, a role for yeast proteins in regulating the strand invasion and DNA synthesis steps of the DNA repair process is being unraveled (for example, Holmes and Haber 1999; Sugawara et al. 2003; Wang et al. 2004; Sugawara and Haber 2006; Lydeard et al. 2007).
Genetic and biochemical analysis reveals that mammalian cells produce homologous recombination proteins, but the functioning of the integrated mammalian system is not well understood. In one study, RAD51, MRE11, and RAD51-paralog proteins were shown to assemble at a I-SceI-induced DSB in human cells (Rodrique et al. 2006). In this investigation, a well-characterized gene targeting assay that measures homologous recombination at the single-copy chromosomal immunoglobulin μ heavy chain gene in mouse hybridoma cells (Baker et al. 1988) was adapted to detect the new DNA synthesis that is an expected outcome of the interaction of invading 3′ ends of the gene targeting vector with the cognate chromosomal locus.
MATERIALS AND METHODS
Cell lines and plasmids:
The mouse hybridoma cell lines Sp6/HL, igm482, and igm10 were used as recipients for DNA transfection (Köhler and Shulman 1980; Köhler et al. 1982; Baker 1989). The cell lines were grown as suspension cultures in Dulbecco's modified Eagle's medium (DMEM) supplemented with 13% bovine calf serum and 0.0035% 2-mercaptoethanol. Cell cultures were diluted 1/10 with fresh medium every 2 days to maintain exponential growth at a cell density between ∼1 and 5 × 10⁵ cell/ml. Hybridoma cells were maintained at 37° in a humidified 7% CO2 atmosphere. Under these conditions, the cell population doubles every ∼18 hr (Shulman et al. 1990; Ng and Baker 1994). Hybridoma cell viability was determined by Trypan blue staining and hemacytometer counting.
The 10.0-kb sequence insertion vector pTCμ contains the full-length 4.3-kb wild-type XbaI Cμ region fragment from the Sp6/HL chromosomal immunoglobulin μ gene inserted into a derivative of pSV2neo (Ng and Baker 1999). The vector pTΔCμ is a pTCμ derivative in which an internal 1.2-kb BstEII Cμ region fragment is deleted. Linearization of pTΔCμ at the unique BstEII site generates 0.9- and 2.3-kb arms of homology to the “left” and “right” of the cut site, respectively, for homologous recombination with the endogenous chromosomal immunoglobulin μ gene.
Hybridoma transfection and plasmid recovery:
The general conditions for electroporation have been described previously (Baker et al. 1988). In brief, an exponentially growing hybridoma culture whose density had reached ∼4 × 10⁵ cells/ml was used for each electroporation. A total of 2 × 10⁷ cells were pelleted by centrifugation at 800 rpm for 10 min at 4°, washed two times in cold 1× PBS, and kept on ice. The hybridoma cells were mixed with 50 μg of BstEII-cut pTΔCμ vector in 0.75 ml of 1× permeabilization buffer (KCl, 140 mm; MgCl2, 1 mm; CaCl2, 0.2 mm; ATP, 1 mm; glucose, 10 mm; EGTA, 1 mm; HEPES, 10 mm, pH 7.3) and subjected to two consecutive 700 V, 25 μF pulses using a Gene Pulser (BioRad). Following electroporation, the cuvette containing the cells and plasmid DNA was placed on ice for 10 min. A 1-ml volume of DMEM was added to the cuvette, and it was placed in a humidified 37° 7% CO2 incubator for a 20-min recovery period. Following this, the cuvette contents were transferred to 37 ml of DMEM in a 75-cm3 tissue culture flask. The cuvette was rinsed three times with 1-ml aliquots of DMEM, and the rinsing was added to the tissue culture flask, which was placed in a humidified 37° 7% CO2 incubator. Thus, the electroporation procedure includes a nominal 30-min period before plasmid DNA is available for extraction. For kinetic studies of 3′ extension, several electroporations were performed in the same manner, and the entire contents of each flask were used in isolating plasmid DNA at various time points.
For plasmid isolation, the hybridoma cells were pelleted by centrifugation at 800 rpm for 10 min at 4°, washed two times in cold 1× PBS, and kept on ice. The hybridoma cell pellet was lysed and plasmid DNA prepared for column recovery using a miniprep kit according to the manufacturer's specifications (Qiagen). Plasmid DNA was eluted from the column in a total volume of 50 μl of double-distilled water, and the column was re-eluted with the same 50-μl water sample. The DNA concentration in the 50-μl plasmid extract was determined using a biophotometer (Eppendorf) and verified by gel electrophoresis against DNA molecular weight standards. Eluted plasmid DNA was stored at −20° for PCR analysis. The plasmid isolation procedure recovers linear and circular plasmid with efficiencies of 51% and 44%, respectively, values that are similar to the ∼60% indicated by the manufacturer (Qiagen).
PCR:
PCR amplification was performed using Taq polymerase and 10× Expand high-fidelity buffer with MgCl2 according to the specifications of the manufacturer (Roche Diagnostics). To minimize pipetting errors, master mixes were prepared for all components except DNA. For the 3′ extension assays, PCR was run at 95° for 2 min, followed by 10 cycles of 95° for 45 sec, 62° for 30 sec, 68° for 3 min, and then a further 20 cycles of 95° for 45 sec, 62° for 30 sec, and 68° for 3 min, including an increase of 30 sec after each cycle. A final extension at 68° was performed for 10 min, followed by a hold on the products at 4°. In experiments to measure plasmid recovery with the primers neoF-1/neoR+6, PCR was run at 95° for 5 min, followed by 30 cycles of 94° for 30 sec, 55° for 30 sec, and 72° for 1 min. A final extension at 72° was performed for 10 min, followed by a hold on the products at 4°. The PCR amplification products were visualized by gel electrophoresis following ethidium bromide staining and quantified by densitometry using a Biorad Gel Doc instrument equipped with Quantity One Plus imaging software (BioRad).
Primers used in PCR amplification include the following: ampR20 (5′-AAGTGCCACCTGACGTCTAA-3′); CμF1 (5′-CTGTGTTGTAGGCCACGAGG-3′); CμF2 (5′-TGTGCAGTGGCTTCAGAGAG-3′); CμF3 (5′-CTGGGCTTCTCAAAGTGGTG-3′); CμF4 (5′-CATTTGCTCCTTGAACTTTGG-3′); neoF20′ (5′-ATCTGCTGACTGTCAACTGTAGCA-3′); CμR1 (5'-CACATTCAGGTTCAGCCAGTCGAT-3′); CμR2 (5′-GGTGGCATTGGCCATAATTGT-3′); CμR3 (5′-AGCACTGAAGGTGCCATTGG-3′); CμR4 (5′-TCTCTGAAGCCACTGCACAC-3′); neoF20 (5′-GCTGACTGTCAACTGTAGCA-3′); AB9703 (5′-CTACTTGAGAAGCCAGGATCTAGG-3′); ampR (5′-ATCCGCCTCCATCCAGTCTATT-3′; AB9438 (5′-GTACCATCAGACTGCACTGTTCCA-3′); neoF-1 (5′-CTCAGAAGAACTCGTCAAGAA-3′); neoR+6 (5′-CTATTCCAGAAGTAGTGAGGA-3′).
As a control for the presence of genomic DNA in extracted plasmid samples, Rad51 forward and reverse primers, 5′-AGGTGAGAGGAAGCTGACAA-3′ and 5′-CTGCTCTGTTAGAGGTAAGG-3′, respectively, that bind between Rad51 exons 5 and 6 were used to generate a specific 0.8-kb product from mouse hybridoma genomic DNA. PCR primers were synthesized by the Laboratory Services Division, University of Guelph.
DNA sequence analysis:
To verify that 3′ extension events were copied from the chromosomal μ-gene template, PCR products were excised from the gels and purified using a Qiaquick gel extraction kit (Qiagen). The DNA sequence of 3′ extensions from the left invading arm was determined using primer CμR1 (see PCR) and primer P2A (5′-ACAGTATCCTGGCTAAAGGATG-3′), while primer CμF1 (see PCR) in conjunction with primer P2B (5′-CATGGTCAATAGCAGGTGCCGCCT-3′) were used to determine the sequence of the right invading vector arm. Automated DNA sequencing was performed by the Laboratory Services Division, University of Guelph.
General techniques:
Total genomic DNA was prepared from the various mammalian cell lines using the sodium dodecyl sulfate–proteinase K method of Gross-Bellard et al. (1973). Plasmid DNA was propagated in Escherichia coli strain DH5α and isolated using the PureLink HiPure plasmid maxiprep kit (Invitrogen). E. coli transformation was performed by electroporation using a Gene Pulser (BioRad) according to conditions specified by the manufacturer. Restriction enzymes were purchased from New England BioLabs and used in accordance with manufacturer specifications. Agarose gel preparation and DNA electrophoresis were performed as described (Sambrook et al. 1989). Aphidicolin (Sigma) was dissolved in 0.1% DMSO and added to exponentially growing hybridoma cells at the concentration 2 μg/ml.
RESULTS
Experimental system:
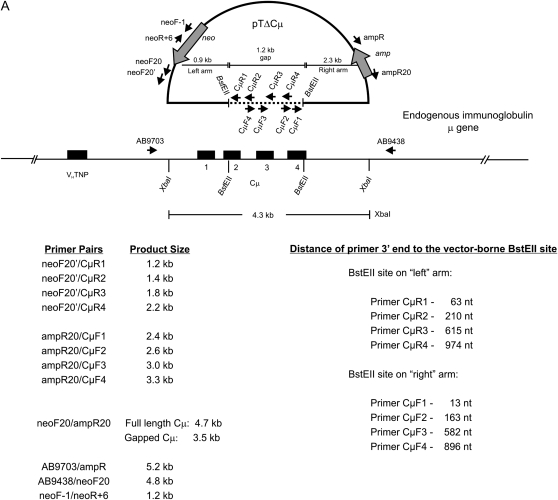
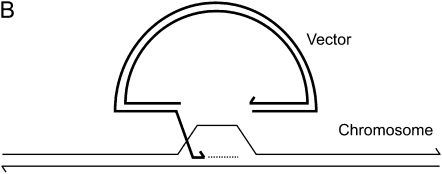
Current homologous recombination models propose that early events in DSB repair involve homology searching, 3′ end strand invasion, and new DNA synthesis that ultimately restores continuity at the DSB. In this study, a well-characterized gene-targeting assay that measures homologous recombination at the single-copy chromosomal immunoglobulin μ heavy chain gene in mouse hybridoma cells (Baker et al. 1988; Ng and Baker 1999) was adapted to detect specific 3′ extension events that are an expected outcome of the interaction of the invading 3′ ends of the gene-targeting vector with the cognate chromosomal locus. The gene-targeting vector, pTΔCμ, bears a noncontiguous segment of the wild-type immunoglobulin Cμ region DNA inserted into the backbone of the pSV2neo vector (Southern and Berg 1982) (Figure 1A). Cleavage of pTΔCμ at the unique BstEII site generates 0.9- and 2.3-kb arms to the left and right of the break site, respectively, that create a 1.2-kb double-stranded gap when aligned with the corresponding regions of the chromosomal immunoglobulin μ gene. During the initial stages of gene targeting, invading 3′ vector ends are expected to anneal with complementary sequences in the chromosomal μ gene and prime new DNA synthesis into the gapped region (Figure 1B). To detect such a 3′ extension, plasmid DNA is extracted from the electroporated hybridoma cells at various time points and analyzed by PCR using specific primers: one primer binds to complementary sequences in the vector backbone, while the binding site for the second primer is generated by the newly synthesized DNA. For purposes of measuring the 3′ extension as well as vector backbone content, various pairs of PCR primers were utilized, and these, along with the specific products that they generate, are summarized in Figure 1A.
Figure 1.—
System for detecting 3′ extension. (A) The pTΔCμ gene-targeting vector is illustrated relative to the chromosomal immunoglobulin μ heavy chain gene in the wild-type Sp6/HL hybridoma. The μ heavy chain variable (VHTNP) and constant (Cμ) regions in exons 1–4 are indicated. As explained in materials and methods, in the pTΔCμ vector, a 1.2-kb BstEII fragment has been deleted from the otherwise normal 4.3-kb XbaI segment encoding the immunoglobulin Cμ region. Following transfection, the left and right homology arms of the BstEII-linearized pTΔCμ vector are capable of undergoing strand invasion and pairing with the chromosomal immunoglobulin μ gene, allowing new DNA synthesis to extend into the gapped region. The relative binding sites of PCR primers used in detection of specific 3′ extension events and in vector backbone quantification along with their product sizes are indicated. For details of individual primer sequences, refer to materials and methods. (B) Schematic illustrating the priming of new DNA synthesis (dashed line) by an invading 3′ end of the gapped vector (thick line). Not drawn to scale.
To standardize the PCR assay for detecting a specific 3′ extension, the primers neoF20′/CμR1 (Figure 1A) were used to amplify the specific 1.2-kb product in the control plasmid pTCμ, which, unlike pTΔCμ, contains the full-length immunoglobulin Cμ region segment (Baker et al. 1988). Therefore, the PCR product obtained from pTCμ amplification is expected to mimic the product of 3′ extension following strand invasion of the left invading arm of the gapped pTΔCμ vector (Figure 1A). Amplification of pTCμ plasmid copy-number standards revealed that the sensitivity of the PCR assay for detection of the 1.2-kb product was ∼5 × 10⁴ Cμ region copies (Figure S1A). Likewise, the standard pTCμ plasmid dilutions were used along with the primer pair ampR20/CμF1 (Figure 1A) to detect the specific 2.4-kb product that mimics 3′ extension events expected for the right invading arm of the gapped pTΔCμ vector. As indicated in Figure S1B, the 2.4-kb Cμ region product was detected with similar efficiency.
Efficiency of plasmid extraction from electroporated hybridoma cells:
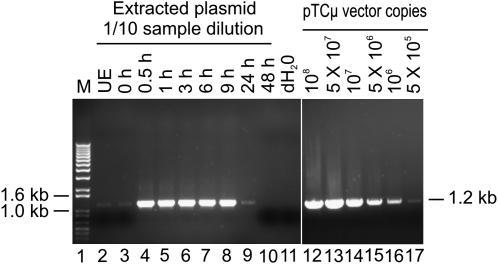
Before testing whether 3′ extension occurs in vivo, the efficiency of recovering BstEII-linearized pTΔCμ plasmid DNA from electroporated Sp6/HL hybridoma cells was determined by PCR amplification using primers neoF-1/neoR+6 to amplify the 1.2-kb neo gene product specific for the vector backbone (Figure 1A). To avoid saturation, PCR reactions were performed with 5 μl of a 1/10 dilution of the plasmid extract (equivalent to 0.5 μl of the original 50-μl plasmid extract). Plasmid recovery was highest during the 0.5- to 6-hr post-electroporation time period and then declined. A representative gel is shown in Figure 2. On the basis of comparison with copy-number standards and taking into account sample loading and the dilution factor, at the 3-hr time point there were ∼2 × 10⁷ pTΔCμ vector molecules (∼0.2 ng)/μl of the total 50-μl plasmid extract. Thus, of the total of 50 μg of plasmid transfected into 2 × 10⁷ hybridoma cells, a small (∼0.02%) fraction was recovered (0.0002 μg × 50 μl/50 μg × 100% = 0.02%).
Figure 2.—
Kinetics of vector backbone recovery. Five-microliter aliquots of 1/10 diluted plasmid extracts (equivalent to 0.5 μl of the total 50 μl of the plasmid sample extracted at each time point) were analyzed. (Left) A kinetic study of pTΔCμ vector recovery from transfected Sp6/HL hybridoma cells as assessed by amplification of the 1.2-kb PCR product from the neo gene using primer pair neoF-1/neoR+6 (Figure 1A). For quantification, the same primers were used to amplify a standard pTCμ vector dilution series as shown on the right. Lane 11 presents a no-DNA control sample. The positions of relevant 1-kb DNA marker bands (denoted M) (Invitrogen) are presented on the left, while the band of interest is shown on the right. UE, unelectroporated. (Sp6/HL hybridoma cells and pTΔCμ vector DNA were mixed and immediately extracted in the absence of electroporation).
As shown in Figure 2, a small amount of plasmid is detected when the BstEII-cut pTΔCμ vector is mixed with the hybridoma cells, which have been pelleted and extracted in the absence of electroporation (UE, unelectroporated), as well as when the BstEII-cut pTΔCμ vector was mixed with the hybridoma cells and plasmid was extracted immediately after electroporation at 0 hr. Recovery of approximately equivalent amounts of plasmid under these two conditions suggests that a small amount of plasmid may adhere to the hybridoma cells. This finding raised the potential concern that vector recovery in the kinetic analysis in Figure 2 might reflect plasmid adherence to the exterior of the hybridoma cells, rather than plasmid that was localized intracellularly due to electroporation. To test this, vector recovery from the hybridoma cells under nonelectroporated and electroporated conditions was compared (Figure S2). In the absence of electroporation, a small amount of plasmid was recovered at 1 and 3 hr, and no plasmid was recovered at the 6-hr time point. In contrast, much larger amounts of plasmid were recovered from electroporated hybridoma cells at the 1-, 3-, and 6-hr time points. Therefore, under electroporated conditions (Figure 2), vector recovery largely reflects plasmid that has accessed the interior of the hybridoma cells.
Rapid kinetics and specificity of 3′ extension:
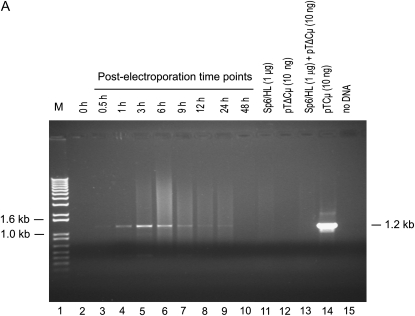
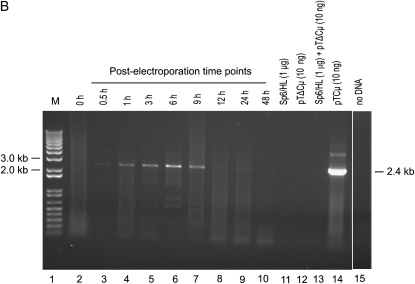
To determine whether 3′ extension occurs following homologous interactions in vivo, Sp6/HL hybridoma cells (Köhler and Shulman 1980; Köhler et al. 1982) were electroporated with BstEII-linearized pTΔCμ vector, and plasmid DNA was extracted from the surviving hybridoma cells at various time points. From a total of 50 μl of plasmid DNA extracted at each time point, a 15-μl sample was amplified with primer pair neoF20′/CμR1 and analyzed by gel electrophoresis for the specific 1.2-kb product expected when the 3′ end of the left invading pTΔCμ vector arm primes new DNA synthesis using the Sp6/HL chromosomal immunoglobulin μ gene as a template (Figure 3A). No product was detected at time zero (Figure 3A, lane 2). A low level of the specific 1.2-kb 3′ extension product was evident at 0.5 hr (Figure 3A, lane 3), reached its highest levels between 3 and 6 hr (Figure 3A, lanes 5 and 6), and then declined. As is evident by comparing the kinetics of 3′ extension (Figure 3A) with vector backbone recovery (Figure 2), the lack of 3′ extension at 0 hr reflects a low level (if any) of intracellular plasmid. However, over the 0.5- to 6-hr time period in which the levels of recovered vector are highest (Figure 2), there is a steady increase in the 3′ extension product following which it declines in parallel with the decreased recovery of vector backbone. As a positive control for the PCR reaction, lane 14 in Figure 3A presents the expected 1.2-kb band following amplification of the full-length wild-type Cμ region in pTCμ vector DNA. As indicated in Figure 1A, the 3′ end of the CμR1 primer resides 63 nucleotides from the BstEII cut site in the left invading vector arm. Thus, new DNA synthesis has extended at least this far into the gapped region.
Figure 3.—
Kinetics of 3′ polymerization from the left and right invading pTΔCμ vector arms. Sp6/HL hybridoma cells were transfected with the BstEII-linearized pTΔCμ vector and the kinetics of 3′ polymerization were measured in extracted plasmid samples (15 μl) at various time points with primer pairs (A) neoF20′/CμR1 or (B) CμF1/ampR20 specific for the left and right vector arms, respectively. (A and B) Lanes 11–13 present pTΔCμ plasmid and/or Sp6/HL genomic DNA as controls for possible PCR artifacts (refer to results for details). Lane 14 presents 10 ng of pTCμ vector bearing the full-length Cμ region as a positive control to indicate the position of the specific (A) 1.2-kb or (B) 2.4-kb PCR product, while lane 15 presents a no-DNA control sample. The positions of relevant DNA marker bands (denoted M) (Invitrogen) are presented on the left, while the band of interest is shown on the right.
To investigate whether the rapid kinetics of 3′ extension were also a feature of strand invasion from the right invading pTΔCμ vector arm, the electroporations were repeated and extracted plasmid samples (15 μl) were tested with primer pair ampR20/CμF1 (Figure 3B). Specific 3′ extension events from the right invading pTΔCμ vector arm displayed rapid kinetics similar to those described above for the left invading vector arm. The 2.4-kb band resulting from amplification of the full-length wild-type Cμ region in pTCμ vector DNA is presented as a positive control (Figure 3B, lane 14). As indicated in Figure 1A, the 3′ end of the CμF1 primer is positioned 13 nucleotides from the BstEII site in the right invading vector arm. Thus, new DNA synthesis has extended at least this far into the gapped region.
In the 3′ extension assay, the members of each primer pair are complementary to different DNA molecules, and therefore, a specific amplification product is expected only in the case where the 3′ end of the gapped vector has been extended by DNA synthesis using the chromosomal immunoglobulin μ gene as a template. However, if plasmid DNA extracted in the 3′ extension assays contains residual hybridoma genomic DNA, PCR artifacts of the sizes expected for 3′ extension products may arise by annealing and extension of incomplete products of separately primed pTΔCμ vector and chromosomal immunoglobulin μ-gene strands (PCR-mediated recombination) (Judo et al. 1998). To estimate the amount of residual genomic DNA present in extracted plasmid samples, Rad51-specific primers were used to amplify a 0.8-kb PCR product from the intronic region between Rad51 exons 5 and 6 and the samples compared to a standard dilution series of Sp6/HL genomic DNA. This analysis showed that residual genomic DNA was present in plasmid extracts in amounts ranging from ∼0.1 to 8 μg over the various time points (data not shown). To assess whether residual genomic DNA was a concern in generating PCR artifacts, several additional controls were included in Figure 3, A and B, namely, 1 μg of Sp6/HL genomic DNA (∼3 × 10⁵ genomes) (lane 11), 10 ng of pTΔCμ DNA (∼109 copies) (lane 12), the combination of 1 μg of Sp6/HL genomic DNA and 10 ng of pTΔCμ vector DNA (lane 13), and no DNA (lane 15). As shown in Figure 3, A and B, no PCR signal was detected in any of these control samples.
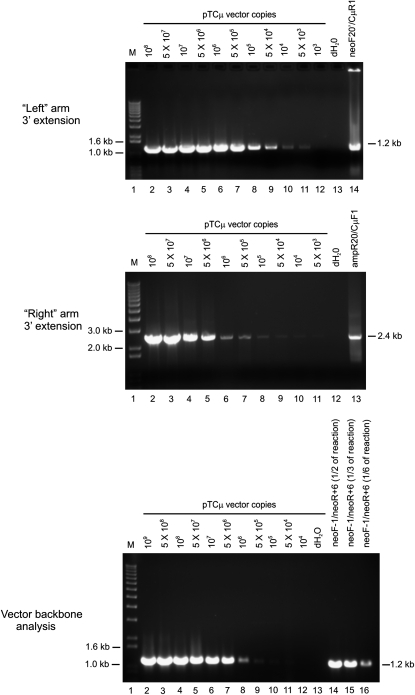
For both left (Figure 3A) and right (Figure 3B) invading vector arms, the maximum amount of 3′ extension was observed between 3 and 6 hr post-electroporation. To quantify specific 3′ extension events from left and right invading vector arms, PCR amplification using primers neoF20′/CμR1 and ampR20/CμF1, respectively, was repeated on 15-μl plasmid samples extracted at the 3-hr time point from three separate electroporations, and the products were analyzed by gel electrophoresis along with the pTCμ standard plasmid dilution series. The copy number of each 3′ extension product was determined by densitometric analysis of band intensity compared to the respective pTCμ plasmid standards. For measurement of vector backbone, as in the experiment presented in Figure 2, the standard plasmid dilution series along with 5 μl of a 1/10 dilution of the plasmid extract were amplified with primers neoF-1/neoR+6 specific for the 1.2-kb neo gene product (Figure 1A), and varying amounts of the PCR reaction were examined by gel electrophoresis, whereupon vector copy number was determined by densitometry: the determination of ∼3 × 10⁷ vector molecules/μl plasmid extract was in agreement with vector backbone recovery determined from analysis of Figure 2. A representative set of gels for one electroporation is presented in Figure 4. The frequency of 3′ extension was expressed as the ratio of the copy number of the 3′ extension to the vector backbone: the frequency of the 3′ extension for the left invading vector arm (0.004 ± 0.0007 events/vector backbone) was lower than that for the right invading vector arm (0.009 ± 0.0006 events/vector backbone).
Figure 4.—
Quantification of 3′ extension. A representative gel used in quantification of 3′ extension events from left (top) and right (middle) invading pTΔCμ vector arms following PCR amplification of 15-μl plasmid extracts with primers neoF20′/CμR1 and ampR20/CμF1, respectively. Densitometric analysis of signal intensity of the 1.2-kb left and 2.4-kb right PCR products in lanes 14 and 13 of the two gels, respectively, was compared to the pTCμ standard plasmid series for determination of 3′ extension copy number. Similarly, 5 μl of a 1/10 dilution of the same sample (equivalent to 0.5 μl of the original plasmid extract) was analyzed for vector backbone content using primers neoF-1/neoR+6 specific for the 1.2-kb product from the vector-borne neo gene (bottom), and various amounts of the PCR reaction were loaded in lanes 14–16. Densitometric analysis of band intensity for the signal in lane 16 was compared with the pTCμ standard plasmid series for determination of vector backbone content. The frequency of 3′ extension was determined as the ratio of the 3′ extension to the vector backbone. The positions of relevant DNA marker bands (denoted M) (Invitrogen) are presented on the left, while the bands of interest are shown on the right.
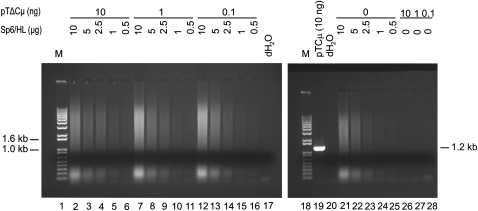
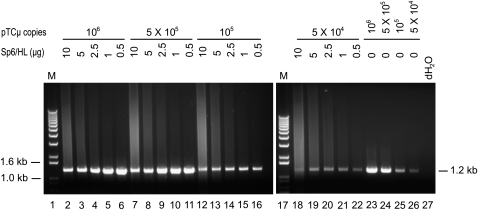
While the above experiments provided support for the occurrence of new DNA synthesis from the invading 3′ ends of the transfected pTΔCμ vector, concern remained as to whether the fixed amounts of Sp6/HL and/or pTΔCμ vector DNA included as controls in Figure 3 were sufficient to assess possible PCR artifacts that might arise in the 3′ extension assays. Therefore, primers neoF20′/CμR1 were tested over a wider range of Sp6/HL genomic (0–10 μg) (representative of the ∼0.1- to 8-μg range detected in the extracted plasmid samples as indicated above) and/or pTΔCμ vector (0–10 ng) DNA samples, but no evidence for a specific 1.2-kb PCR signal was obtained (Figure 5). Nonetheless, it might be argued that the amounts of genomic DNA included in the various samples in Figure 5 inhibited PCR reactions that might otherwise generate a 1.2-kb PCR artifact. To assess this, primer pair neoF20′/CμR1 was used to amplify several representative pTCμ plasmid copy-number standards (bearing the full-length Cμ region) in the presence of a varying background of Sp6/HL genomic DNA. As shown in Figure 6, compared to the pTCμ copy-number standards alone (lanes 23–26), the 1.2-kb PCR product was detected with similar efficiency over most Sp6/HL genomic DNA concentrations. We do note an approximately two- to threefold decrease in signal intensity in the presence of higher DNA concentrations (>5 × 10⁵ pTCμ copies and >5 μg Sp6/HL genomic DNA). However, this amount of genomic DNA is at the upper end of what is typically recovered in plasmid extracts and therefore not likely to interfere with the detection of 3′ extension. Additionally, primer omission control experiments in which primers neoF20′ and CμR1 (or both) were omitted from the PCR reaction were also performed, but again, no specific 1.2-kb PCR signal was evident (Figure S3). The same negative results were obtained when the above control experiments were repeated using primer pair ampR20/CμF1 to assess possible PCR artifacts that might arise in the assay for the specific 2.4-kb PCR product of 3′ extension from the right invading pTΔCμ vector arm (data not shown). Therefore, we conclude that PCR artifacts are not likely to interfere with the detection of specific 3′ extension from the left or right invading pTΔCμ vector arms.
Figure 5.—
Testing for PCR artifacts. Mixtures of Sp6/HL genomic (0.5–10 μg) and/or pTΔCμ vector (0–10 ng) DNA were subjected to PCR amplification with primer pair neoF20′/CμR1 specific for the 1.2-kb PCR product to test for formation of possible PCR artifacts. As a positive control for the 1.2-kb PCR product, lane 19 presents 10 ng pTCμ vector DNA bearing the full-length Cμ region, while lane 20 presents a no-DNA control. The positions of relevant DNA marker bands (denoted M) (Invitrogen) are presented on the left, while the band of interest is shown on the right.
Figure 6.—
Effect of residual genomic DNA on detection of 3′ extension. Mixtures of Sp6/HL genomic (0.5–10 μg) and/or pTCμ vector (0–10 ng) DNA were subjected to PCR amplification to determine whether genomic DNA affects the efficiency of detecting the 1.2-kb PCR product with primer pair neoF20′/CμR1. As positive controls, lanes 23–26 present the efficiency of detecting the 1.2-kb PCR product in the absence of Sp6/HL genomic DNA, while lane 27 presents a no-DNA control. The positions of relevant DNA marker bands (denoted M) (Invitrogen) are presented on the left, while the band of interest is shown on the right.
To verify that the 3′ extension events have been copied from the chromosomal μ-gene template, the 1.2-kb left and 2.4-kb right PCR products were excised from gels equivalent to those in Figure 4 (top panel, lane 14; middle panel, lane 13) and purified, and the DNA strands of each product were sequenced using primers P2A/CμR1 and P2B/CμF1, respectively (Figure S4). The binding sites for primers CμR1 and P2A separate their 3′ ends by 125 nucleotides, while the binding sites for primers CμF1 and P2B place their 3′ ends 106 nucleotides apart. As noted in Figure S4, the DNA sequence obtained using primer P2A terminated at the 5′ end of primer CμR1, while that obtained using primer P2B terminated at the 5′ end of primer CμF1. Furthermore, both match the μ-gene sequence presented in Goldberg et al. (1981), confirming that 3′ extension events are the result of copying the Sp6/HL chromosomal immunoglobulin μ-gene template.
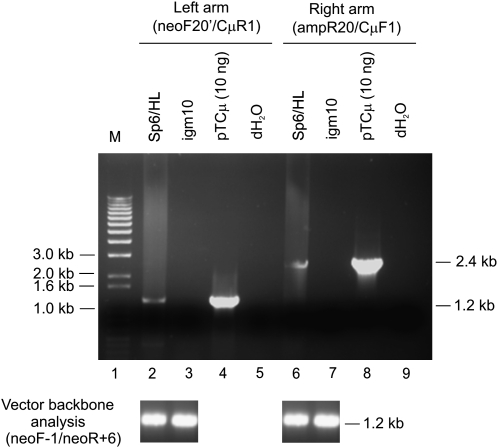
The analysis of 3′ extension was also performed in recipient igm10 hybridoma cells, an Sp6/HL derivative deleted for the chromosomal μ gene (Köhler and Shulman 1980; Köhler et al. 1982). As shown in Figure 7, no PCR product was detected from either the left or the right invading arms of the transfected BstEII-cut pTΔCμ vector DNA. Therefore, the detection of specific 3′ extension depends on the presence of the chromosomal μ-gene template. Finally, to rule out the possibility that the observed 3′ extension events were unique to the Sp6/HL hybridoma cell line, the experiments were repeated in the igm482 hybridoma, a Sp6/HL derivative that also contains a single copy of the chromosomal immunoglobulin μ gene (Kohler et al. 1982). In the igm482 hybridoma, the kinetics of 3′ extension from the invading arms of the pTΔCμ vector were similar to those shown in Figure 3, A and B (data not shown).
Figure 7.—
Generation of 3′ extension products requires a μ-gene template. The igm10 hybridoma, an Sp6/HL derivative that has lost the single-copy μ gene (Köhler and Shulman 1980; Köhler et al. 1982), was transfected with the BstEII-linearized pTΔCμ vector, and, after 3 hr, the extent of 3′ polymerization was measured in extracted plasmid samples (15 μl) with primer pair neoF20′/CμR1 specific for the 1.2-kb left 3′ extension product (lane 3) and primer pair ampR20/CμF1 specific for the 2.4-kb right 3′ extension product (lane 7). Lanes 4 and 8 present 10 ng pTCμ vector DNA bearing the full-length Cμ region to indicate the positions of the specific 1.2- and 2.4-kb PCR products, while lanes 2 and 6 present the extent of 3′ polymerization at the 3-hr time point from the left and right invading pTΔCμ vector arms following transfection of wild-type Sp6/HL hybridoma cells, respectively. The extracted plasmid samples were reanalyzed for vector backbone content with primer pair neoF-1/neoR+6. The positions of relevant DNA marker bands (denoted M) (Invitrogen) are presented on the left, while the bands of interest are shown on the right.
3′ extension events are predominantly <1.2 kb:
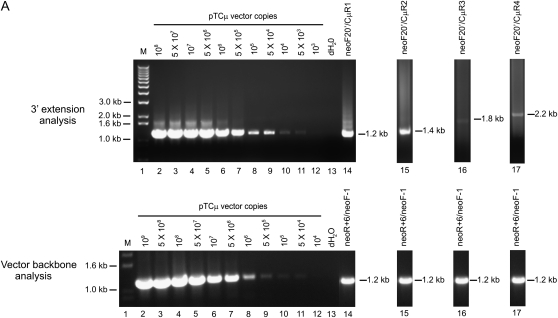
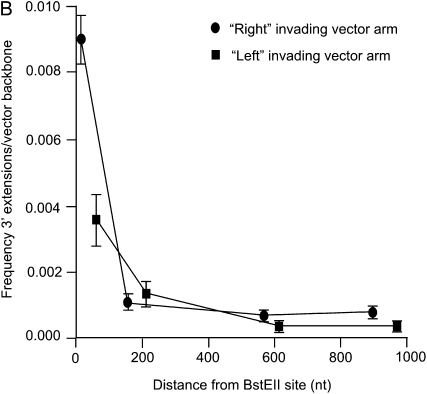
In the kinetic analyses (Figure 3, A and B), detection of the specific 3′ extension events requires that invading ends of the gapped pTΔCμ vector prime DNA synthesis of the chromosomal μ-gene template for <100 nucleotides to include the CμF1 or CμR1 primer binding sites (Figure 1A). This raises the question, how long are tracts of new DNA synthesis? To answer this, Sp6/HL hybridoma cells were transfected with BstEII-cleaved pTΔCμ vector, and plasmid samples extracted at the 3-hr peak in 3′ extension were analyzed by PCR with primer pairs specific for products extending farther into the chromosomal μ-gene region excluded by the vector-borne gap, namely, neoF20′ paired with CμR1, CμR2, CμR3, and CμR4 in the case of the left invading vector arm and ampR20 paired with CμF1, CμF2, CμF3, and CμF4 for the right invading vector arm (Figure 1A). A representative gel for a portion of the analysis of 3′ extension from the left invading arm is presented in Figure 8A, which presents the plasmid dilution series (lanes 2–12) along with the specific 1.2-kb 3′ extension product for the 3-hr post-electroporation time point detected with primer pair neoF20′/CμR1 (lane 14). Similarly, the extracted plasmid sample tested in lane 14 was also amplified with primer pairs neoF20′/CμR2, neoF20′/CμR3, and neoF20′/CμR4, and the products were analyzed by gel electrophoresis alongside the standard pTCμ plasmid dilution series: for simplicity, Figure 8A omits the pTCμ plasmid standards included in each of these respective gels and instead shows the 3′ extension products in lanes 15, 16, and 17. The copy number of each 3′ extension product was determined by densitometric analysis of band intensity compared to the respective pTCμ plasmid standards. To relate the amount of 3′ extension to recovered vector backbone, the standard plasmid dilution series and extracted plasmid samples (5 μl of a 1/10 dilution of plasmid extract) were also examined with primer pair neoF-1/neoR+6 specific for the 1.2-kb neo gene product from the transfected pTΔCμ vector (Figure 1A) (a representative gel for this analysis is presented in the bottom of Figure 8A). From the above information, the frequency of 3′ extension/vector backbone for each primer pair was determined for the left and right invading vector arms as summarized in Figure 8B. Specific 3′ polymerization products extended ∼1000 nucleotides into the vector-borne double-stranded gap, although extensions of this length represented only a small fraction of the total (∼4%). The vast majority of 3′ extension events declined markedly with increasing distance from the left and right invading pTΔCμ vector 3′ ends. In fact, over the first ∼200 nucleotides, specific 3′ extensions from the left and right invading vector arms decrease approximately three- and ninefold, respectively.
Figure 8.—
Examination of the length of new DNA synthesis. In A, the top presents a representative gel showing 3′ polymerization from the left invading pTΔCμ vector arm as detected with primer pairs neoF20′/CμR1, neoF20′/CμR2, neoF20′/CμR3, and neoF20′/CμR4 specific for PCR products of 1.2 kb (lane 14), 1.4 kb (lane 15), 1.8 kb (lane 16), and 2.2 kb (lane 17), respectively. The same samples were also tested for vector backbone content using primer pair neoF-1/neoR+6 specific for the 1.2-kb product from the neo gene of the transfected pTΔCμ vector (Figure 1A) as indicated in the representative gel underneath. In each gel, lanes 2–12 present the standard pTCμ vector dilution series, while lane 13 presents a no-DNA control. The positions of relevant DNA marker bands (denoted M) (Invitrogen) are presented on the left, while positions of the bands of interest are shown on the right. As explained in results, and summarized in B, densitometric analysis of band intensity and comparison to the respective plasmid standards permitted the ratio of 3′ extension to vector backbone to be determined for the left (▪) and right (•) invading pTΔCμ vector arms as a function of the distance from the respective BstEII cut sites (B).
In addition, we examined whether 3′ extension extended outside the vector-borne region of homology to the chromosomal μ gene by amplifying extracted plasmid samples with primers AB9703/ampR specific for a 5.2-kb 3′ extension product involving the right invading vector arm and with primers AB9438/neoF20 specific for a 4.8-kb 3′ extension product involving the left invading vector arm (Figure 1A), but no PCR products were observed (data not shown). Therefore, as suggested by the data in Figure 8B, the vast majority of 3′ extension events do not extend outside the 1.2-kb vector-borne double-stranded gap.
Evidence for 3′ extensions on linear plasmid molecules:
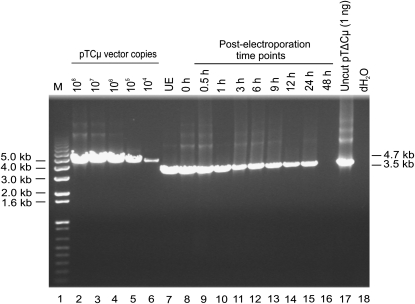
The 3′ extension events may reside on linear plasmid molecules or, in the event of simple end rejoining (Wilson et al. 1982), on circular plasmids. Since the isolation procedure recovers linear and circular plasmid DNA with similar efficiency (see materials and methods), it was of interest to investigate the nature of the 3′ extension products. As shown in Figure 1A, in a circular plasmid, primer pair ampR20/neoF20 is expected to amplify a 4.7-kb PCR product if 3′ extensions from the BstEII-cut vector ends happen to overlap and restore the 1.2-kb vector-borne double-stranded gap, or is expected to amplify a ∼3.5-kb PCR product if ends containing short 3′ extensions or the BstEII-cut ends themselves rejoin. Anticipating a low yield of any such 3′ extension product, a kinetic study utilized 15-μl samples of plasmid extract equivalent to that used in the studies in Figure 3, A and B. As shown in Figure 9, no full-length 4.7-kb Cμ region gap repair products were detected despite the PCR assay being sensitive to at least ∼104 vector copies. Instead, a 3.5-kb Cμ region band diagnostic of circular pTΔCμ vector in the plasmid extracts was visible over the various time points. The kinetics of detecting the 3.5-kb Cμ region product resembled that of the vector backbone (Figure 2). In Figure 9, at 3 hr (lane 11), the 15-μl sample of plasmid extract contained ∼5 × 10⁴ copies of circular plasmid, and in this sample there are ∼3 × 10⁸ vector backbone copies (see Figures 2 and 4). Therefore, the frequency of circular molecules is ∼5 × 10⁴/3 × 108 = ∼0.0002 circles/vector backbone (0.02%), a value that is 35-fold lower than the average frequency of 3′ extension events/vector backbone [∼0.007 events/vector backbone (Figure 3, A and B)], thus posing limits on the fraction of 3′ extension events that could reside on circular molecules. To determine whether there was evidence for 3′ extension events in the circular plasmid fraction revealed as the 3.5-kb Cμ region product, PCR amplification was conducted with primers P2A/CμR1 and P2B/CμF1, which are diagnostic for 125- and 106-bp products of 3′ extension from the left and right invading pTΔCμ vector arms, respectively (Figure S4). This analysis revealed that 3′ extension products are present in the circular plasmid fraction, although in a very small amount: ∼0.0003% (data not shown). Therefore, the vast majority of 3′ extension events detected in Figure 3, A and B, must reside on linear plasmid molecules.
Figure 9.—
Analysis of gap repair. Lanes 7–16 present a time-course PCR analysis using primer pair neoF20/ampR20: in the event that 3′ polymerization events repair the 1.2-kb double-stranded gap in pTΔCμ, a full-length 4.7-kb Cμ PCR product is expected, whereas, in the case of the rejoining of the BstEII-cut ends of the pTΔCμ vector, a 3.5-kb product is expected. For comparison, a standard dilution series of pTCμ vector DNA bearing the full-length 4.3-kb Cμ region is presented in lanes 2–6, while lane 17 shows the 3.5-kb band generated from 1 ng of uncut pTΔCμ vector. Lane 18 presents a no-DNA control. The positions of relevant DNA marker bands (denoted M) (Invitrogen) are presented on the, while the bands of interest are shown on the right. UE, unelectroporated.
In Figure 9, detection of the 3.5-kb Cμ region product in the absence of electroporation (UE) (lane 7) suggested a residual uncut fraction of pTΔCμ DNA in the BstEII-cleaved vector preparation. Indeed, PCR analysis of uncut vs. BstEII-cut pTΔCμ DNA revealed that a small (∼0.4%) fraction of uncut DNA can be present in the BstEII-cleaved pTΔCμ preparation (Figure S5) (Note that the uncut plasmid fraction is ∼20-fold higher than the 0.02% fraction of circular DNA recovered as 3.5-kb Cμ region fragment from transfected cells as indicated above, suggesting that the vast majority of any residual uncut DNA in the BstEII-cut preparation is frequently opened during the process of cell transfection.)
New DNA synthesis is sensitive to aphidicolin:
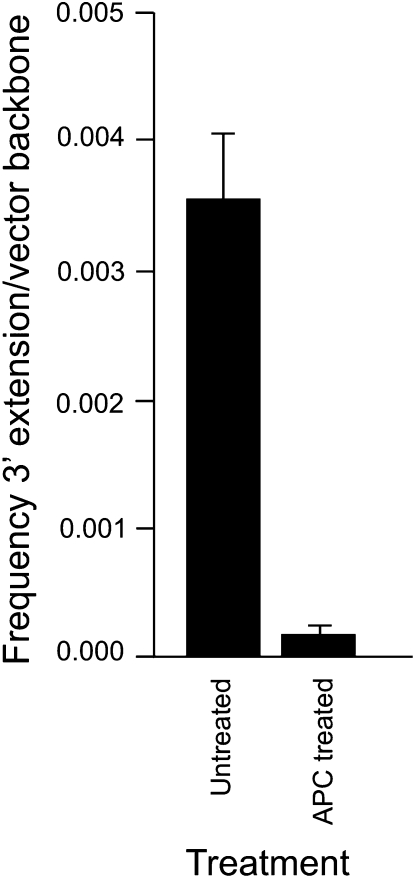
Aphidicolin inhibits the DNA polymerases α, δ, and ɛ (Wang 1991), and therefore it was of interest to determine whether the new DNA synthesis that accompanies 3′ strand invasion was aphidicolin sensitive. Asynchronous Sp6/HL hybridoma cells were pretreated with 2 μg/ml aphidicolin for 3 hr (an exposure that did not alter hybridoma cell viability) or left untreated, washed in PBS, and electroporated with BstEII-cut pTΔCμ vector. At 3 hr post-electroporation, plasmid DNA was extracted and examined for specific 3′ extension from the left invading arm with primer pair neoF20′/CμR1 as well as vector backbone content using primer pair neoF-1/neoR+6 (Figure 1A). As explained above, densitometric analysis of band intensity permitted determination of the 3′ extension/vector backbone ratio for both treated and untreated samples. As shown in Figure 10, the new DNA synthesis that accompanied 3′ strand invasion was reduced ∼22-fold following aphidicolin treatment.
Figure 10.—
New DNA synthesis from invading vector arms is aphidicolin sensitive. The ratio of 3′ extension to vector backbone in unsynchronized Sp6/HL hybridoma cells that are either untreated or pretreated for 3 hr with 2 μg/ml aphidicolin (APC) is presented. Refer to results for further details.
DISCUSSION
In this article, we report for the first time the occurrence of an early event in mammalian homologous recombination, namely, the new DNA synthesis that accompanies 3′-end strand invasion. The test system utilizes a gene-targeting vector (pTΔCμ) bearing a double-stranded gap in the region of homology to the chromosomal template, namely, the single-copy immunoglobulin μ heavy chain gene in mouse hybridoma cells. Strand invasion by 3′ vector ends primes new DNA synthesis extending into the μ-gene region excluded by the vector-borne gap, and this is measured by a sensitive PCR assay. Following transfection, the gapped pTΔCμ vector gains access to the interior of the hybridoma cells where it interacts with the μ-gene template. Specific extension products from the two 3′ vector ends display rapid kinetics: they are detected as early as 0.5 hr following electroporation, increase to a maximum level between 3 and 6 hr, and then decline. The rapid kinetics of 3′ extension from the two vector ends suggests that both are accessible for strand invasion and the initiation of new DNA synthesis. DNA sequence analysis confirms copying of the chromosomal μ-gene template. Primer omission studies, as well as tests to determine whether 3′ extension events arise from annealing and extension of incomplete products of separately primed pTΔCμ vector and chromosomal μ-gene strands, suggest against the possibility of PCR artifacts in this system. The decline in 3′ extension products at time points >12 hr correlates with decreased recovery of the vector backbone. These observations parallel the kinetic studies of Bertling et al. (1987) who show that newly introduced DNA persists in the mammalian nucleus with a half-life of 15–24 hr following electroporation. The decrease in plasmid recovery may reflect the combination of susceptibility to degradation and cell division, given the ∼18-hr hybridoma doubling time (Shulman et al. 1990; Ng and Baker 1994).
The new DNA synthesis primed by the two invading 3′ ends can extend ∼1000 nucleotides into chromosomal μ-gene sequences excluded by the vector-borne double-stranded gap, although for the vast majority of events, the efficiency of repair decreases markedly over the first ∼200 nucleotides. We were unsuccessful in detecting a PCR product that would signify repair of the entire 1.2-kb vector-borne gap or in which copying occurred outside the vector-borne region of homology to the chromosomal μ gene. Limits to the efficiency of repair synthesis dependent on the size of the double-stranded gap have also been observed in Saccharomyces cerevisiae (Pâques et al. 1998). Various mechanisms can influence the extent of gap repair synthesis, including the efficiency with which the first 3′ end invades and is stabilized, limitations to capturing the second 3′ end, and other factors and conditions that might act to limit 3′ extension, such as polymerase processivity. A role for reduced processivity in DNA repair synthesis has been suggested from genetic studies in S. cerevisiae (Wang et al. 2004). Although PCNA is required, neither the mini-chromosome maintenance (MCM) complex nor Cdc45p is needed. Thus, reduced processivity may reflect a lack of extensive helix unwinding (Wang et al. 2004).
In this study, the detection of 3′ extension products that are primarily <1.2 kb and relatively short-lived suggests that they likely reside on extrachromosomal plasmid molecules. The plasmid isolation procedure recovers linear and circular forms with similar efficiency, but residual genomic DNA present in the extracted samples interferes with direct visualization of the plasmid DNA. On the basis of PCR analysis, the vast majority of 3′ extension products appear to reside on linear plasmid molecules.
The process of 3′ extension, at least over distances < ∼200 nucleotides, is relatively efficient: when calculated in relation to the amount of recovered vector backbone, at its peak at ∼3 hr, the frequency is 0.004 ± 0.0007 events/vector backbone for the left invading vector arm and 0.009 ± 0.0006 events/vector backbone for the right invading vector arm. The higher frequency of plasmid molecules bearing 3′ extensions from the right invading vector arm may reflect the greater homology on the right arm (i.e., 2.3 kb on the right arm vs. 0.9 kb on the left arm) and/or proximity of the first primer binding site (i.e., 13 and 63 nucleotides from the BstEII cut site on the right and left vector arms, respectively) (Figure 1A). Whatever advantage these features might offer initiation of 3′ extension from the right arm do not promote the reaction over larger distances because between ∼200 and 1000 nucleotides, the efficiency of 3′ extension for both invading vector arms is similar. In yeast and mammalian cells, repair of a double-stranded break involves resection of DNA ends generating single-stranded tails that are often ∼1000 nucleotides in length (Cao et al. 1990; Sun et al. 1991; Bishop et al. 1992; Henderson and Simons 1997; Zenvirth et al. 2003). Thus, new DNA synthesis by one invading 3′ end may need to extend at least this far for the extruded D loop to properly capture the second noninvading 3′ end in completing repair of the double-stranded break. Our observation that new DNA synthesis tracts can extend for distances of ∼1000 nucleotides during the process of homologous recombination are in agreement with this expectation.
The generation of 3′ extension products is sensitive to the inhibitor aphidicolin supporting the requirement for one or more of the main replicative DNA polymerases, namely, α, δ, and ɛ in this process (Wang 1991). A study of HO-induced gene conversion at the MAT locus in S. cerevisiae concluded that only leading-strand polymerization (likely, Polɛ) was required for DSB repair involving synthesis tracts of a few hundred base pairs (Wang et al. 2004). In that study, it was suggested that the invading 3′ end was sufficient to prime DNA synthesis via leading-strand replication obviating the need for DNA primase (polymerase α) activity. In this study, a mechanism of 3′ extension that involves DNA polymerase activity is favored on the basis of aphidicolin sensitivity and the observation that the products of 3′ extension decrease in frequency with increasing distance from the invading 3′ end. It should be noted, however, that Cromie et al. (2006) report an alternative mechanism to generating recombinants strands during meiotic recombination in Schizosaccharomyces pombe, namely, that of D loop cleavage and ligation of the invading 3′ end to the donor chromosomal DNA.
The 3′ extension products detected in this study resemble intermediates predicted by synthesis-dependent strand annealing (SDSA) and single-end invasion mechanisms of homologous recombination (Belmaaza and Chartrand 1994; Nassif et al. 1994; Pâques and Haber 1999; Allers and Lichten 2001; Hunter and Kleckner 2001). In addition, the 3′ extension products are also consistent with initial strand invasion steps of the double-strand break repair pathway (Orr-Weaver et al. 1981; Szostak et al. 1983) that have not matured into the more stable double Holliday junction intermediate. Interestingly, we have previously characterized stable transformants in which randomly integrated gene-targeting vectors bear specific 3′ extensions templated by the chromosomal immunoglobulin μ locus (frequency: ∼10−6/cell), suggesting that a minor fraction of 3′ extended plasmids detected in this study may survive by integrating into the hybridoma genome (McCulloch et al. 2003).
New DNA synthesis from invading 3′ vector ends is a predicted event in the pathway of yeast and mammalian gene targeting (Orr-Weaver et al. 1981; Szostak et al. 1983). Consequently, the 3′ extension product may represent an early intermediate in gene targeting at the hybridoma chromosomal immunoglobulin μ locus. If so, it is possible to construct a time course of the gene-targeting process in the hybridoma cells. Following DNA transfer by electroporation, the early homology search and strand invasion steps must be rapid, since new DNA synthesis is observed as early as 0.5 hr and reaches a maximum after ∼3–6 hr. In the hybridoma system, gene targeting can be detected as early as 23 hr post-electroporation as assessed by the appearance of plaque-forming cells in which normal IgM production has been restored through repair of a chromosomal immunoglobulin μ-gene mutation (Baker et al. 1988; Shulman et al. 1990; Ng and Baker 1999). The ∼17-hr time period between the detection of new DNA synthesis and the appearance of plaque-forming cells includes the time required to complete the process of generating crossover and gene replacement products of gene targeting (Baker et al. 1988; Ng and Baker 1999) as well as synthesize sufficient normal μ mRNA and for the μ heavy chain to be assembled into IgM, glycosylated and secreted. About 10 hr is sufficient for RNA synthesis and IgM secretion (Pfeffer and Rothman 1987; Shulman et al. 1990) leaving an ∼7-hr window to complete homologous recombination. This time frame is longer than reported for meiotic or mitotic chromosomal homologous recombination in S. cerevisiae where strand invasion and DNA synthesis begin as early as 0.5 hr following an HO-endonuclease-induced DSB, with noncrossover gene conversion products being detected within an hour (White and Haber 1990; Sugawara and Haber 1992; Aylon et al. 2003). Perhaps mammalian cells require additional time to assemble the requisite recombination proteins, or to form and resolve a Holliday junction intermediate. As indicated above, during exponential growth, hybridoma doubling time is ∼18 hr (Shulman et al. 1990; Ng and Baker 1994) and assuming no delay in the cell cycle, transfected cells would normally undergo about one cell doubling during the 23-hr period required to detect gene targeting (Baker et al. 1988; Shulman et al. 1990; Ng and Baker 1999). Thus, the ∼7 hr may also include some time required for cell division. After one cell doubling, a plaque-forming cell would be expected to contain, at least initially, ∼50% of the normal amount of wild-type μ mRNA. However, the reduced μ mRNA does not affect the efficiency of detecting plaque-forming cells because plaque-forming cells making ∼25% as much IgM as wild type have been observed previously (Baker et al. 1988, 1994).
In the event that 3′ extension does represent an early gene-targeting intermediate, can the frequencies of the two processes be compared? As described in the legend of Figure 4, an average frequency of 3′ extension for the left and right invading arms over the first ∼100 nucleotides is ∼0.007 events/vector molecule. One way in which this might be compared to gene targeting is via the ratio of targeted recombinants/stable transformants, which for “ends-in” recombination in most mammalian cells is between ∼10−3 and 10−4 (Smithies et al. 1985; Thomas et al. 1986; Baker et al. 1988; Waldman 1992; Ng and Baker 1998, 1999). Accordingly, 3′ extension is ∼7- to 70-fold more efficient than gene targeting. For various mechanistic reasons, it might be argued that the “ends-in” gene targeting referred to above is more efficient than the gene-targeting reaction required to repair a vector-borne double-stranded gap (such as in the BstEII-cleaved pTΔCμ vector in this study). While data suggest that this is not the case (Valancius and Smithies 1991), if it were, the observed bias in 3′ extension would be even higher than the stimulation noted above.
Thus, our data suggest that the initially favorable homology search and strand invasion steps of homologous recombination might be compromised by some barrier to completion of the gene-targeting process [a view consistent with earlier studies reporting copy-number independence of mammalian gene targeting (Thomas et al. 1986; Zheng and Wilson 1990)]. This may involve the activity of a protein(s) that unwinds the strand invasion intermediate, perhaps as a means of reducing the likelihood of crossovers, for example, RECQ helicases such as BLM and WRN that are homologous to yeast Sgs1 (Ira et al. 2003; Chu and Hickson 2009). Another possibility is the failure to stabilize a heteroduplex DNA intermediate or limitations to Holliday junction formation and/or resolution. Rapid dissolution of a Holliday junction intermediate may reflect the lack of sufficient quantities of a protein(s), equivalent perhaps, to Msh4/Msh5 in meiotic yeast cells (Snowden et al. 2004, 2008) that would bind and stabilize the structure to prevent strand unwinding. If a similar mechanism operates between recombining chromosomal sequences, it may preferentially lead to the generation of noncrossover recombinants (i.e., SDSA events). While formation of noncrossover (i.e., SDSA-like) recombinants has not been measured in this study, other investigators have reported a bias in noncrossover events during intra- and interchromosomal homologous recombination in yeast (Esposito 1978; Klein and Petes 1981; Haber and Hearn 1985; Christman et al. 1988; Kupiec and Petes 1988; Pâques and Haber 1999; Ira et al. 2003) and mammalian cells (Liskay et al. 1984; Baker 1989; Shulman et al. 1995; Baker et al. 1996; Richardson et al. 1998; Johnson and Jasin 2000). This mechanism acting at the level of recombination between chromosomal sequences would provide the means of suppressing potentially deleterious rearrangements that may arise from crossover between chromosomal sequences (Shulman et al. 1995; Richardson et al. 1998).
Acknowledgments
We thank Marc J. Shulman for critical evaluation of the manuscript and members of the Baker laboratory for helpful discussions. The constructive comments of the manuscript reviewers are appreciated. Research support was provided by an operating grant from the Canadian Institutes of Health Research to M.D.B. and an Ontario Graduate Scholarship to R.D.M.
Supporting information is available online at http://www.genetics.org/cgi/content/full/genetics.110.115196/DC1.
References
- Allers, T., and M. Lichten, 2001. Differential timing and control of noncrossover and crossover recombination during meiosis. Cell 106 47–57. [DOI] [PubMed] [Google Scholar]
- Aylon, Y., and M. Kupiec, 2004. DSB repair: the yeast paradigm. DNA Repair (Amst.) 3 797–815. [DOI] [PubMed] [Google Scholar]
- Aylon, Y., B. Liefshitz, G. Bitan-Banin and M. Kupiec, 2003. Molecular dissection of mitotic recombination in the yeast Saccharomyces cerevisiae. Mol. Cell. Biol. 23 1403–1417. [DOI] [PMC free article] [PubMed] [Google Scholar]
- Baker, M. D., 1989. High-frequency homologous recombination between duplicate chromosomal immunoglobulin mu heavy-chain constant regions. Mol. Cell. Biol. 9 5500–5507. [DOI] [PMC free article] [PubMed] [Google Scholar]
- Baker, M. D., N. Pennell, L. Bosnoyan and M. J. Shulman, 1988. Homologous recombination can restore normal immunoglobulin production in a mutant hybridoma cell line. Proc. Natl. Acad. Sci. USA 85 6432–6436. [DOI] [PMC free article] [PubMed] [Google Scholar]
- Baker, M. D., H. A. Karn and L. R. Read, 1994. Restoration of a normal level of immunoglobulin production in a hybridoma cell line following modification of the chromosomal immunoglobulin mu gene by gene replacement. J. Immunol. Methods 168 25–32. [DOI] [PubMed] [Google Scholar]
- Baker, M. D., L. R. Read, B. G. Beatty and P. Ng, 1996. Requirements for ectopic homologous recombination in mammalian somatic cells. Mol. Cell. Biol. 16 7122–7123. [DOI] [PMC free article] [PubMed] [Google Scholar]
- Bassing, C. H., and F. W. Alt, 2004. The cellular response to general and programmed DN double strand breaks. DNA Repair (Amst.) 3 781–796. [DOI] [PubMed] [Google Scholar]
- Belmaaza, A., and P. Chartrand, 1994. One-sided invasion events in homologous recombination at double-strand breaks. Mutat. Res. 314 199–208. [DOI] [PubMed] [Google Scholar]
- Bertling, W., K. Hunger-Bertling and M. J. Kline, 1987. Intranuclear uptake and persistence of biologically active DNA after electroporation of mammalian cells. J. Biochem. Biophys. Methods 14 223–232. [DOI] [PubMed] [Google Scholar]
- Bishop, D. K., D. Park, L. Xu and N. Kleckner, 1992. DMC1: a meiosis-specific yeast homolog of E. coli recA required for recombination, synaptonemal complex formation, and cell cycle progression. Cell 69 439–456. [DOI] [PubMed] [Google Scholar]
- Cao, L., E. Alani and N. Kleckner, 1990. A pathway for generation and processing of double-strand breaks during meiotic recombination in S. cerevisiae. Cell 61 1089–1101. [DOI] [PubMed] [Google Scholar]
- Christman, M. F., F. S. Dietrich and G. R. Fink, 1988. Mitotic recombination in the rDNA of S. cerevisiae is suppressed by the combined action of DNA topoisomerases I and II. Cell 55 413–425. [DOI] [PubMed] [Google Scholar]
- Chu, W. K., and I. D. Hickson, 2009. RecQ helicases: multifunctional genome caretakers. Nat. Rev. Cancer 9 644–654. [DOI] [PubMed] [Google Scholar]
- Cromie, G. A., R. W. Hyppa, A. F. Taylor, K. Zakharyevich, N. Hunter et al., 2006. Single Holliday junctions are intermediates of meiotic recombination. Cell 127 1167–1178. [DOI] [PMC free article] [PubMed] [Google Scholar]
- Esposito, M. S., 1978. Evidence that spontaneous mitotic recombination occurs at the two strand stage. Proc. Natl. Acad. Sci. USA 75 4436–4440. [DOI] [PMC free article] [PubMed] [Google Scholar]
- Goldberg, G. I., E. F. Vanin, A. M. Zrolka and F. Blattner, 1981. Sequence of the gene for the constant region of the μ chain of Balb/c mouse immunoglobulin. Gene 15 33–42. [DOI] [PubMed] [Google Scholar]
- Gross-Bellard, M., P. Oudet and P. Chambon, 1973. Isolation of high-molecular-weight DNA from mammalian cells. Eur. J. Biochem. 36 32–38. [DOI] [PubMed] [Google Scholar]
- Haber, J. E., 1992. Mating-type switching in Saccharomyces cerevisiae. Trends Genet. 8 446–452. [DOI] [PubMed] [Google Scholar]
- Haber, J. E., 1995. In vivo biochemistry: physical monitoring of recombination induced by site-specific endonucleases. Bioessays 17 609–620. [DOI] [PubMed] [Google Scholar]
- Haber, J. E., 1998. Mating-type gene switching in Saccharomyces cerevisiae. Annu. Rev. Genet. 32 561–599. [DOI] [PubMed] [Google Scholar]
- Haber, J. E., 2000. Lucky breaks: analysis of recombination in Saccharomyces. Mutat. Res. 451 53–69. [DOI] [PubMed] [Google Scholar]
- Haber, J. E., and M. Hearn, 1985. Rad52-independent mitotic gene conversion in Saccharomyces cerevisiae frequently results in chromosome loss. Genetics 111 7–22. [DOI] [PMC free article] [PubMed] [Google Scholar]
- Henderson, G., and J. P. Simons, 1997. Processing of DNA prior to illegitimate recombination in mouse cells. Mol. Cell. Biol. 17 3779–3785. [DOI] [PMC free article] [PubMed] [Google Scholar]
- Holmes, A. M., and J. E. Haber, 1999. Double-strand break repair in yeast requires both leading and lagging strand DNA polymerases. Cell 96 415–424. [DOI] [PubMed] [Google Scholar]
- Hunter, N., and N. Kleckner, 2001. The single-end invasion: an asymmetric intermediate at the double-strand break to double-Holliday junction transition of meiotic recombination. Cell 106 59–70. [DOI] [PubMed] [Google Scholar]
- Ira, G., A. Malkova, G. Liberi, M. Foiani and J. E. Haber, 2003. Srs2 and Sgs1-Top3 suppress crossovers during double-strand break repair in yeast. Cell 115 401–411. [DOI] [PMC free article] [PubMed] [Google Scholar]
- Johnson, R. D., and M. Jasin, 2000. Sister chromatid gene conversion is a prominent double-strand break repair pathway in mammalian cells. EMBO J. 19 3398–3407. [DOI] [PMC free article] [PubMed] [Google Scholar]
- Johnson, R. D., and M. Jasin, 2001. Double-strand-break-induced homologous recombination in mammalian cells. Biochem. Soc. Trans. 29 196–201. [DOI] [PubMed] [Google Scholar]
- Judo, M. S. B., A. B. Wedei and C. Wilson, 1998. Stimulation and suppression of PCR-mediated recombination. Nucleic Acids Res. 26 1819–1825. [DOI] [PMC free article] [PubMed] [Google Scholar]
- Klein, H. L., and T. D. Petes, 1981. Intrachromosomal gene conversion in yeast. Nature 289 144–148. [DOI] [PubMed] [Google Scholar]
- Köhler, G., and M. J. Shulman, 1980. Immunoglobulin M mutants. Eur. J. Immunol. 10 467–476. [Google Scholar]
- Köhler, G., M. J. Potash, H. Lehrach and M. J. Shulman, 1982. Deletions in immunoglobulin mu chains. EMBO J. 1 555–563. [DOI] [PMC free article] [PubMed] [Google Scholar]
- Kupiec, M., and T. D. Petes, 1988. Allelic and ectopic recombination between Ty elements in yeast. Genetics 119 549–559. [DOI] [PMC free article] [PubMed] [Google Scholar]
- Li, X., and W. D. Heyer, 2008. Homologous recombination in DNA repair and DNA damage tolerance. Cell Res. 18 99–113. [DOI] [PMC free article] [PubMed] [Google Scholar]
- Liskay, R. M., J. L. Stachelek and A. Letsou, 1984. Homologous recombination between repeated chromosomal sequences in mouse cells. Cold Spring Harb. Symp. Quant. Biol. 49 183–189. [DOI] [PubMed] [Google Scholar]
- Lydeard, J. R., S. Jain, M. Yamaguchi and J. E. Haber, 2007. Break-induced replication and telomerase-independent telomere maintenance require Pol32. Nature 448 820–823. [DOI] [PubMed] [Google Scholar]
- McCulloch, R. D., L. R. Read and M. D. Baker, 2003. Strand invasion and DNA synthesis from the two 3′ ends of a double-strand break in mammalian cells. Genetics 163 1439–1447. [DOI] [PMC free article] [PubMed] [Google Scholar]
- Nassif, N., J. Penney, S. Pal, W. R. Engles and G. B. Gloor, 1994. Efficient copying of nonhomologous sequences from ectopic sites via P-element-induced gap repair. Mol. Cell. Biol. 14 1613–1625. [DOI] [PMC free article] [PubMed] [Google Scholar]
- Ng, P., and M. D. Baker, 1994. High-frequency loss of specific immunoglobulin production in hybridoma cell lines bearing a chromosomal immunoglobulin κ modified by homologous recombination. Somat. Cell Mol. Genet. 20 107–119. [DOI] [PubMed] [Google Scholar]
- Ng, P., and M. D. Baker, 1998. High efficiency site-specific modification of the chromosomal immunoglobulin locus by gene targeting. J. Immunol. Methods 214 81–96. [DOI] [PubMed] [Google Scholar]
- Ng, P., and M. D. Baker, 1999. Mechanisms of double-strand-break repair during gene targeting in mammalian cells. Genetics 151 1127–1141. [DOI] [PMC free article] [PubMed] [Google Scholar]
- Orr-Weaver, T. L., J. W. Szostak and R. J. Rothstein, 1981. Yeast transformation: a model system for the study of recombination. Proc. Natl. Acad. Sci. USA 78 6354–6358. [DOI] [PMC free article] [PubMed] [Google Scholar]
- Pâques, F., and J. E. Haber, 1999. Multiple pathways of recombination induced by double-strand breaks in Saccharomyces cerevisiae. Microbiol. Mol. Biol. Rev. 63 349–404. [DOI] [PMC free article] [PubMed] [Google Scholar]
- Pâques, F., W. Y. Leung and J. E. Haber, 1998. Expansions and contractions in a tandem repeat induced by double-strand break repair. Mol. Cell. Biol. 18 2045–2054. [DOI] [PMC free article] [PubMed] [Google Scholar]
- Pfeffer, S. R., and J. E. Rothman, 1987. Biosynthetic protein transport and sorting by the endoplasmic reticulum and Golgi. Annu. Rev. Biochem. 56 829–852. [DOI] [PubMed] [Google Scholar]
- Pierce, A. J., J. M. Stark, F. D. Araujo, M. E. Moynahan, E. Berwick et al., 2001. Double-strand breaks and tumorigenesis. Trends Cell Biol. 11 S52–S59. [DOI] [PubMed] [Google Scholar]
- Richardson, C., M. E. Moynahah and M. Jasin, 1998. Double-strand break repair by interchromosomal recombination: suppression of chromosomal translocations. Genes Dev. 12 3831–3842. [DOI] [PMC free article] [PubMed] [Google Scholar]
- Rodrique, A., M. Lafrance, M. C. Gauthier, D. McDonald, M. Hendzel et al., 2006. Interplay between human DNA repair proteins at a unique double-strand break in vivo. EMBO J. 25 222–231. [DOI] [PMC free article] [PubMed] [Google Scholar]
- Sambrook, J. E., E. F. Fritsch and T. Maniatis, 1989. Molecular Cloning: a Laboratory Manual, Ed. 2. Cold Spring Harbor Laboratory Press, Cold Spring Harbor, NY.
- Shulman, M. J., L. Nissen and C. Collins, 1990. Homologous recombination in hybridoma cells: dependence on time and fragment length. Mol. Cell. Biol. 10 4466–4472. [DOI] [PMC free article] [PubMed] [Google Scholar]
- Shulman, M. J., C. Collins, A. Connor, L. R. Read and M. D. Baker, 1995. Interchromosomal recombination is suppressed in mammalian somatic cells. EMBO J. 14 4102–4107. [DOI] [PMC free article] [PubMed] [Google Scholar]
- Smithies, O., R. G. Gregg, S. S. Boggs, M. A. Koralewski and R. S. Kucherlapati, 1985. Insertion of DNA sequences into the human chromosomal beta-globin locus by homologous recombination. Nature 317 230–234. [DOI] [PubMed] [Google Scholar]
- Snowden, T., S. Acharya, C. Butz, M. Berardini and R. Fishel, 2004. hMSH4-hMSH5 recognizes Holliday junctions and forms a meiosis-specific sliding clamp that embraces homologous chromosomes. Mol. Cell 15 437–451. [DOI] [PubMed] [Google Scholar]
- Snowden, T., K. S. Kim, C. Schmutte, S. Acharya and R. Fishel, 2008. hMSH4-hMSH5 adenosine nucleotide processing and interactions with homologous recombination machinery. J. Biol. Chem. 283 145–154. [DOI] [PMC free article] [PubMed] [Google Scholar]
- Southern, P. J., and P. Berg, 1982. Transformation of mammalian cells to antibiotic resistance with a bacterial gene under control of the SV40 early region promoter. J. Mol. Appl. Genet. 1 327–341. [PubMed] [Google Scholar]
- Sugawara, N., and J. E. Haber, 1992. Characterization of double-strand break-induced recombination: homology requirements and single-stranded DNA formation. Mol. Cell. Biol. 12 563–575. [DOI] [PMC free article] [PubMed] [Google Scholar]
- Sugawara, N., and J. E. Haber, 2006. Repair of DNA double strand breaks: in vivo biochemistry. Methods Enzymol. 408 416–429. [DOI] [PubMed] [Google Scholar]
- Sugawara, N., X. Wang and J. E. Haber, 2003. In vivo roles of Rad52, Rad54 and Rad55 proteins in Rad51-mediated recombination. Mol. Cell 12 209–219. [DOI] [PubMed] [Google Scholar]
- Sun, H., D. Treco and J. W. Szostak, 1991. Extensive 3′-overhanging, single-stranded DNA associated with meiosis-specific double strand breaks at the ARG4 recombination initiation site. Cell 64 1155–1161. [DOI] [PubMed] [Google Scholar]
- Szostak, J. W., T. L. Orr-Weaver, R. J. Rothstein and F. W. Stahl, 1983. The double-strand-break repair model for recombination. Cell 33 25–35. [DOI] [PubMed] [Google Scholar]
- Thomas, K. R., K. R. Folger and M. R. Capecchi, 1986. High frequency targeting of genes to specific sites in the mammalian genome. Cell 44 419–428. [DOI] [PubMed] [Google Scholar]
- Valancius, V., and O. Smithies, 1991. Double-strand gap repair in a mammalian gene targeting reaction. Mol. Cell. Biol. 11 4389–4397. [DOI] [PMC free article] [PubMed] [Google Scholar]
- Waldman, A. S., 1992. Targeted homologous recombination in mammalian cells. Crit. Rev. Oncol. Hematol. 12 49–64. [DOI] [PubMed] [Google Scholar]
- Wang, T. S., 1991. Eukaryotic DNA polymerases. Annu. Rev. Biochem. 60 513–552. [DOI] [PubMed] [Google Scholar]
- Wang, X., G. Ira, J. Tercero, A. Holmes, J. Diffley et al., 2004. Role of DNA replication proteins in double-strand break-induced recombination in Saccharomyces cerevisiae. Mol. Cell. Biol. 24 6891–6899. [DOI] [PMC free article] [PubMed] [Google Scholar]
- Wei, D. S., and Y. S. Rong, 2007. A genetic screen for DNA double-strand break repair mutations in Drosophila. Genetics 177 63–77. [DOI] [PMC free article] [PubMed] [Google Scholar]
- White, C. I., and J. E. Haber, 1990. Intermediates of recombination during mating type switching in Saccharomyces cerevisiae. EMBO J. 9 663–673. [DOI] [PMC free article] [PubMed] [Google Scholar]
- Wilson, J. H., P. B. Berget and J. M. Pipas, 1982. Somatic cells efficiently join unrelated DNA segments end-to-end. Mol. Cell. Biol. 2 1258–1269. [DOI] [PMC free article] [PubMed] [Google Scholar]
- Wyman, C., and R. Kanaar, 2006. DNA double strand break repair: all's well that ends well. Annu. Rev. Genet. 40 363–383. [DOI] [PubMed] [Google Scholar]
- Zenvirth, D., C. Richler, A. Bardhan, F. Baudat, A. Barzilai et al., 2003. Mammalian meiosis involves DNA double-strand breaks with 3′ overhangs. Chromosoma 111 369–376. [DOI] [PubMed] [Google Scholar]
- Zheng, H., and J. H. Wilson, 1990. Gene targeting in normal and amplified cell lines. Nature 344 170–173. [DOI] [PubMed] [Google Scholar]


