Abstract
Docking of small molecule compounds into the binding site of a receptor and estimating the binding affinity of the complex is an important part of the structure-based drug design process. For a thorough understanding of the structural principles that determine the strength of a protein/ligand complex both, an accurate and fast docking protocol and the ability to visualize binding geometries and interactions are mandatory. Here we present an interface between the popular molecular graphics system PyMOL and the molecular docking suites Autodock and Vina and demonstrate how the combination of docking and visualization can aid structure-based drug design efforts.
Keywords: Docking, Virtual screening, Autodock, Vina, PyMOL
Introduction
Virtual screening of compound libraries has become a standard technology in modern drug discovery pipelines [1]. If a suitable structure of the target is available molecular docking can be used to discriminate between putative binders and non-binders in large databases of chemicals and to reduce the number of compounds to be subjected to experimental testing substantially. Visual examination of predicted binding geometries (docking poses) thereby contributes crucially to the further development of a lead compound either towards enhanced binding affinity, towards reduced side effects or towards reduced susceptibility to drug resistance related mutations. Over the last years the PyMOL molecular graphics system [2] has evolved from being a powerful molecular viewer with exceptional 3D-capabilities into a platform for several programs and applications which make use of PyMOL’s versatile visualization properties.
Through its multi-layer architecture and the use of the powerful object-oriented scripting language Python at the top-level, PyMOL is relatively easy to extend and customize without re-compiling the source code. Extensions can either make use of the wizard-interface or the plugin-interface, the latter of which is the more commonly utilized. In the field of molecular interactions there have been several (plugin)-extensions developed that gain great popularity. The APBS plugin [3] is an interface to the popular adaptive Poisson-Boltzmann solver (APBS [4]) program and provides easy access to electrostatics calculations and the visualization of potential energy surfaces and charge densities on protein surfaces. CAVER [5, 6] performs calculations of substrate pathways and entrance tunnels in protein structures which are visualized in PyMOL. CASTp [7, 8, 9] detects pockets and voids in protein structures to determine and characterize binding sites, and eMovie [10] provides a number of functionalities to create animations and movies.
In the present work we describe a plugin for PyMOL which allows to carry out molecular docking, virtual screening and binding site analysis with PyMOL. The plugin represents an interface between PyMOL and two popular docking programs, Autodock [11, 12] and Autodock Vina [13] and makes extensive use of a Python script collection (Autodock Tools [14]) for the setup of docking runs. Since visualization is crucial for structure-based drug design, several tools have been developed to add visual support for the autodock suite. The visualizer AutoDockTools offers a complete molecular viewer and a graphical support for all steps required for setup and analysis of docking runs. Raccoon (http://autodock.scripps.edu/resources/raccoon), BDT [15] and DOVIS [16] are other graphical user interfaces for Autodock with a special focus on large-scale virtual screening. Raccoon and BDT focus on a straightforward data organization important for virtual screening but do not provide molecular viewing functionality whereas DOVIS uses an embedded Java viewer. The PyMOL plugin described here is developed specifically to make use of PyMOL’s exceptional molecular viewing capabilities. PyMOL is the most frequently used program for generating publication quality pictures of molecular structures and offers multiple advanced rendering options. Additionally it provides exceptional 3D-viewing functionalities which can be very useful in structure-based drug design. Since PyMOL supports several commonly used file formats for electron density maps it is also the preferred tool for crystallographers. Hence, an easy to handle Autodock/Vina-plugin for PyMOL is expected to lower the barrier for scientist who are not docking experts to make use of these popular docking protocols within their preferred environment and to use it in conjunction with other applications available for PyMOL.
The plugin provides functionality to carry out the entire workflow of a docking study with visual support of PyMOL and a graphical user interface. In the current version the plugin covers the following operations: Binding site definition and adjustment, automatic file preparations for receptor definition, straightforward selection of flexible residues, ligand file preparation, generation and viewing of affinity grid maps, viewing of docking poses, and analysis and export of virtual screening results.
A docking study usually starts with the definition of a binding site, in general a restricted region of the protein. The size and location of this binding site is visualized in PyMOL and can be adjusted interactively. Optionally residues within the binding site can be defined to be flexible during docking. Subsequently, the necessary files for the receptor definition are generated automatically. Similarly, file preparations for multiple ligands can be controlled via the plugin. The actual docking calculations can be be launched from within PyMOL and the results be visualized. Furthermore, the results of multiple docking runs are automatically analyzed and a ranked list of the docked poses is generated and it can be exported in different data formats for further analysis.
Methods
Binding site definition
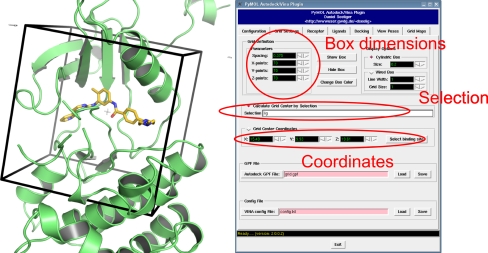
Both Autodock and Vina use rectangular boxes for the definition of the binding site. In the plugin, the box center can by defined either by providing explicit coordinates or, more user friendly, by defining a PyMOL selection (e.g. a reference ligand). The box center is then calculated from the mean coordinates of the atoms from the PyMOL selection and the docking box displayed in the PyMOL window. The size and the exact position of the box can also be adjusted to the user’s demands. For visualization purposes the plugin furthermore allows to chose between two display options and the color of the box frame (see Fig. 1).
Fig. 1.
Definition of a docking box around a reference ligand. Position, size and visualization properties can be adjusted with the plugin
Binding site definitions defined here can also be exported to input files for either Autodock or Vina.
Setup and execution of docking runs
Autodock and Vina need receptor and ligand representations in a file format called pdbqt which is a modified protein data bank [17] format containing atomic charges, atom type definitions and, for ligands, topological information (rotatable bonds). These file preparations are carried out by the plugin using scripts from the Autodock Tools package. Ligands for subsequent docking runs can either be prepared one by one through PyMOL selections or by specifying a directory containing a library of ligands to be docked.
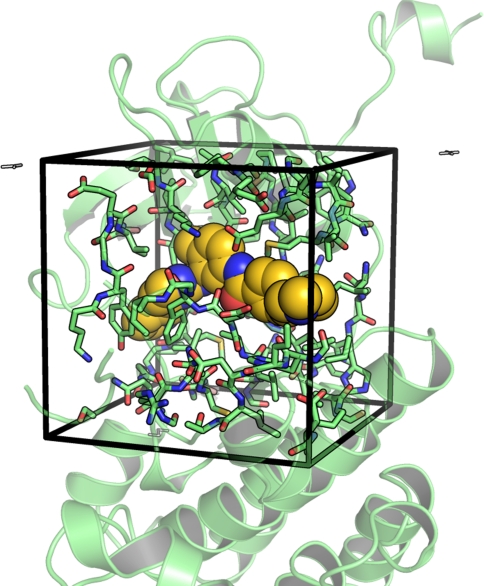
After binding site definition and receptor and ligand preparation, docking runs can be directly launched from PyMOL. Alternatively, run input files can be written to start the docking runs from the command line. Both Autodock and Vina allow for flexibility of predefined sidechains during docking. Here the plugin facilitates the selection of flexible sidechains. Sidechains within the docking box can be visualized straightforwardly and PyMOL selections can be translated into a flexible receptor definition (Fig. 2).
Fig. 2.
Selection of sidechains within the binding site for the setup of docking runs with flexible sidechains
Binding site analysis with interaction maps
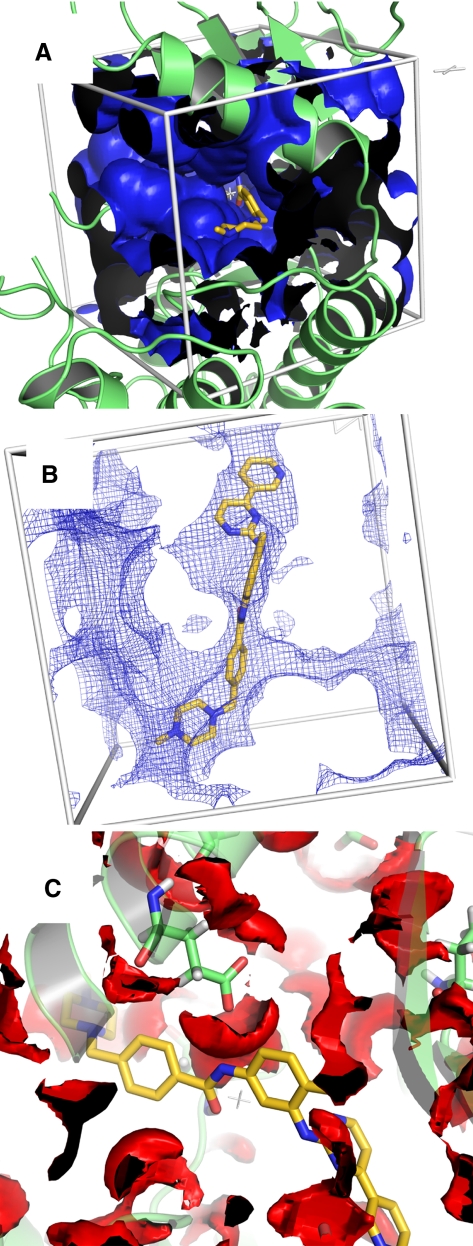
Autodock uses interaction maps for docking. Prior to the actual docking run these maps are calculated by the program autogrid. For each ligand atom type, the interaction energy between the ligand atom and the receptor is calculated for the entire binding site which is discretized through a grid. This has the advantage that interaction energies do not have to be calculated at each step of the docking process but only looked up in the respective grid map. In addition to speeding up a docking runs the grid maps on their own can also provide value hints for ligand optimization. Since a grid map represents the interaction energy as a function of the coordinates their visual inspection may reveal potential unsaturated hydrogen acceptors or donors or unfavourable overlaps between the ligand and the receptor. The plugin therefore provides the functionality to visualize these grid maps in PyMOL. The maps generated by autogrid are converted to a file format readable by PyMOL (DX format) which allows to draw isosurfaces and isomeshes analogous to electron density maps. Since several maps can be loaded and controlled simultaneously, a rapid inspection of several interaction types is made very easily. Figure 3 shows how these grid maps can be controlled via the plugin.
Fig. 3.
Autodock grid maps displayed with different contour levels. a Map for interactions of aliphatic carbon atoms at contour level 5 kcal/mol. b Same map at contour level −0.3 kcal/mol. c Hydrogen bond donor map at contour level −0.5 kcal/mol
In Fig. 3A an isosurface at a contour level of 5 kcal/mol for the interaction of the protein with aliphatic carbon atoms is shown. Such a setting may be used to get a visual impression of the overall shape of the binding site. Ligand modifications which cause a penetration of such a wall will most likely not enhance the affinity. In Fig. 3B the same map is visualized at a contour level of −0.3 kcal/mol. As can be seen, the shape of the surface, here shown as isomesh, roughly describes an envelope of the ligand and reveals putative spots of attractive interactions that may guide further ligand optimization. Likewise, hydrogen bond donor or acceptor interaction maps can guide ligand optimization since they might reveal unsaturated acceptor or donor positions (Fig. 3C).
The plugin provides functionality to handle different interaction maps and representations at different contour levels at the same time and hence, offers the possibility to visualize different binding site properties which may provide valuable insights for structure-based drug design.
Analysis of docking results
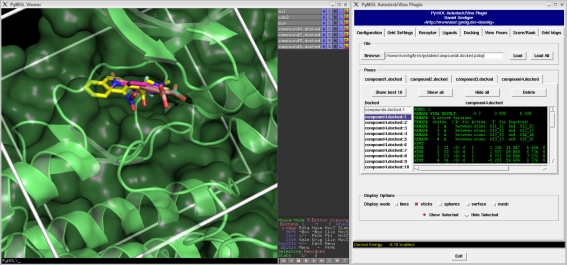
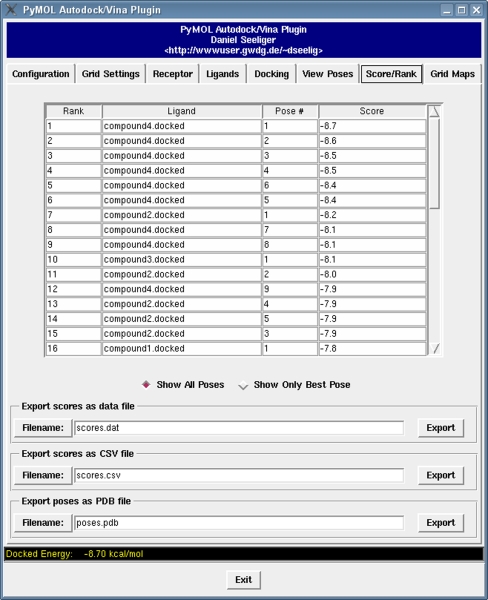
Docking poses generated by the docking programs can be directly loaded into PyMOL through the plugin. Poses for multiple ligands may be handled simultaneously using an intuitive notebook layout (see Fig. 4). For each docking pose, meta information containing the docking score is displayed in a small text viewer, allowing direct analysis of configuration/score relationships. Moreover, results from multiple docking runs are summarized in a table (see Fig. 5). The docking poses are ranked according to their docking scores and both the ranked list of docked ligands and their corresponding binding poses may be exported. For instance, the ranked list of docking results can be exported in a CSV file format which can be directly imported into programs like Excel.
Fig. 4.
Analysis of docking poses. Left: PyMOL viewer with displayed docking poses. Right: Pose viewer page of the plugin. Poses from multiple docking runs may be analyzed simultaneously using an intuitive notebook layout
Fig. 5.
Virtual screening analysis. A ranked list of docked ligands is generated automatically and it can be exported in different data formats. Additionally, docking poses from different ligands can be exported in a single file
Conclusion
We present a novel plugin for the popular molecular graphics system PyMOL which allows to perform docking studies using Autodock or Autodock/Vina. The plugin covers all functionalities for the entire workflow of a docking run plus additional functionality to prepare, execute and analyze virtual screening tasks. Since visual support is an important aspect of structure-based drug design, the plugin is expected to enhance these efforts by allowing the combined use of two widely used docking programs and PyMOL. The plugin is available free of charge with source code and may be obtained from http://wwwuser.gwdg.de/~dseelig/adplugin..
System requirements
The plugin has been developed on Linux with PyMOL version 1.2 and requires MGLTools version 1.5.4 and NumPy version 1.3. Although users reported successful installation and operation on different platforms (MacOS and Windows) no support is provided for these operating systems.
Open Access
This article is distributed under the terms of the Creative Commons Attribution Noncommercial License which permits any noncommercial use, distribution, and reproduction in any medium, provided the original author(s) and source are credited.
Footnotes
This work was funded by the Deutsche Forschungsgemeinschaft (DFG) grant No. GR 207914
Contributor Information
Daniel Seeliger, Phone: +49-551-2012310, FAX: +49-551-2012302, Email: dseelig@gwdg.de.
Bert L. de Groot, Phone: +49-551-2012308, FAX: +49-551-2012302, Email: bgroot@gwdg.de
References
- 1.Kitchen D, Decornez H, Furr J, Bajorath J. Docking and scoring in virtual screening for drug discovery: methods and applications. Nat Rev Drug Discov. 2004;3(11):935–949. doi: 10.1038/nrd1549. [DOI] [PubMed] [Google Scholar]
- 2.DeLano WL (2002) The PyMOL molecular graphics system. http://www.pymol.org
- 3.Lerner MG, Carlson HA. Apbs plugin for pymol. Ann Arbor: University of Michigan; 2008. [Google Scholar]
- 4.Baker N, Sept D, Joseph S, Holst M, McCammon J. Electrostatics of nanosystems: application to microtubules and the ribosome. Proc Natl Acad Sci U S A. 2001;98(18):10,037. doi: 10.1073/pnas.181342398. [DOI] [PMC free article] [PubMed] [Google Scholar]
- 5.Petřek M, Otyepka M, Banáš P, Košinová P, Koča J, Damborský J. CAVER: a new tool to explore routes from protein clefts, pockets and cavities. BMC Bioinformatics. 2006;7(1):316. doi: 10.1186/1471-2105-7-316. [DOI] [PMC free article] [PubMed] [Google Scholar]
- 6.Damborskỳ J, Petrek M, Banáš P, Otyepka M. Identification of tunnels in proteins, nucleic acids, inorganic materials and molecular ensembles. Biotechnol J. 2007;2:62–67. doi: 10.1002/biot.200600208. [DOI] [PubMed] [Google Scholar]
- 7.Liang J, Edelsbrunner H, Woodward C. Anatomy of protein pockets and cavities: measurement of binding site geometry and implications for ligand design. Protein Sci. 1998;7:1884–1897. doi: 10.1002/pro.5560070905. [DOI] [PMC free article] [PubMed] [Google Scholar]
- 8.Liang J, Edelsbrunner H, Fu P, Sudhakar P, Subramaniam S. Analytical shape computing of macromolecules II: identification and computation of inaccessible cavities inside proteins. Proteins: Struct Funct Genet. 1998;33:18–29. doi: 10.1002/(SICI)1097-0134(19981001)33:1<18::AID-PROT2>3.0.CO;2-H. [DOI] [PubMed] [Google Scholar]
- 9.Liang J, Edelsbrunner H, Fu P, Sudhakar P, Subramaniam S. Analytical shape computation of macromolecules: I. Molecular area and volume through alpha shape. Proteins: Struct. Funct. Genet. 1998;33(1):1–17. doi: 10.1002/(SICI)1097-0134(19981001)33:1<1::AID-PROT1>3.0.CO;2-O. [DOI] [PubMed] [Google Scholar]
- 10.Hodis E, Schreiber G, Rother K, Sussman J. eMovie: a storyboard-based tool for making molecular movies. Trends Biochem Sci. 2007;32(5):199–204. doi: 10.1016/j.tibs.2007.03.008. [DOI] [PubMed] [Google Scholar]
- 11.Morris GM, Goodsell DS, Halliday DS, Huey R, Hart WE, Belew R, Olson AJ. Automated docking using a lamarckian genetic algorithm and and empirical binding free energy function. J Comp Chem. 1998;19:1639–1662. doi: 10.1002/(SICI)1096-987X(19981115)19:14<1639::AID-JCC10>3.0.CO;2-B. [DOI] [Google Scholar]
- 12.Huey R, Morris GM, Olson AJ, Goodsell DS. A semiempirical free energy force field with charge-based desolvation. J Comp Chem. 2007;28:1145–1152. doi: 10.1002/jcc.20634. [DOI] [PubMed] [Google Scholar]
- 13.Trott O, Olson A. AutoDock Vina: improving the speed and accuracy of docking with a new scoring function, efficient optimization, and multithreading. J Comp Chem. 2010;31:455–461. doi: 10.1002/jcc.21334. [DOI] [PMC free article] [PubMed] [Google Scholar]
- 14.Sanner M. Python: a programming language for software integration and development. J Mol Graphics Mod. 1999;17:57–61. [PubMed] [Google Scholar]
- 15.Vaque M, Arola A, Aliagas C, Pujadas G. BDT: an easy-to-use front-end application for automation of massive docking tasks and complex docking strategies with AutoDock. Bioinformatics. 2006;22(14):1803. doi: 10.1093/bioinformatics/btl197. [DOI] [PubMed] [Google Scholar]
- 16.Zhang S, Kumar K, Jiang X, Wallqvist A, Reifman J. DOVIS: an implementation for high-throughput virtual screening using AutoDock. Bmc Bioinformatics. 2008;9(1):126. doi: 10.1186/1471-2105-9-126. [DOI] [PMC free article] [PubMed] [Google Scholar]
- 17.Berman H, Westbrook J, Feng Z, Gilliland G, Bhat T, Weissig H, Shindyalov I, Bourne P (2000) The protein data bank . URL citeseer.ist.psu.edu/berman02protein.html [DOI] [PMC free article] [PubMed]


