

Abstract
Visual experience scales down excitatory synapses in the superficial layers of visual cortex in a process that provides an in vivo paradigm of homeostatic synaptic scaling. Experience-induced increases in neural activity rapidly upregulates mRNAs of immediate early genes involved in synaptic plasticity, one of which is Arc (activity-regulated cytoskeleton protein or Arg3.1). Cell biological studies indicate that Arc/Arg3.1 protein functions to recruit endocytic machinery for AMPA receptor internalization, and this action, together with its activity-dependent expression, rationalizes a role for Arc/Arg3.1 in homeostatic synaptic scaling. Here, we investigated the role of Arc/Arg3.1 in homeostatic scaling in vivo by examining experience-dependent development of layer 2/3 neurons in the visual cortex of Arc/Arg3.1 knock-out (KO) mice. Arc/Arg3.1 KOs show minimal changes in basal and developmental regulation of excitatory synaptic strengths but display a profound deficit in homeostatic regulation of excitatory synapses by visual experience. As additional evidence of specificity, we found that the visual experience-induced regulation of inhibitory synapses is normal, although the basal inhibitory synaptic strength is increased in the Arc/Arg3.1 KOs. Our results demonstrate that Arc/Arg3.1 plays a selective role in regulating visual experience-dependent homeostatic plasticity of excitatory synaptic transmission in vivo.
Introduction
Synaptic activity that conveys sensory information is important for the development of neuronal circuits. Whereas input-specific Hebbian plasticity sculpts neural circuits based on correlation of presynaptic and postsynaptic activity, cortical neurons also engage in cell-wide homeostatic adaptations in response to persistent changes in activity. For example, a few days of visual deprivation can globally scale up excitatory synaptic strength in visual cortex, which is measured as increases in the amplitude of miniature EPSC (mEPSC) (Desai et al., 2002; Goel et al., 2006; Goel and Lee, 2007; Maffei and Turrigiano, 2008). The change in mEPSC amplitude follows the rules of multiplicative synaptic scaling (Turrigiano et al., 1998), at least in juveniles (Goel and Lee, 2007), consistent with the notion that scaling preserves information that may be stored as differential synaptic weights. Reexposing visually deprived rodents to light decreases mEPSCs to normal levels (Goel et al., 2006; Goel and Lee, 2007), suggesting a reversible process. A similar adaptation in excitatory synaptic transmission is also observed in auditory cortex after sensory neural hearing loss (Kotak et al., 2005), suggesting that the global homeostatic regulation of cortical synapses by sensory experience may be a general phenomenon.
Molecular mechanisms of synaptic scaling are mainly derived from in vitro studies, in which neural activity is pharmacologically manipulated. Several hours of activity blockade by tetrodotoxin (TTX) scales up mEPSCs, whereas increasing neural firing by pharmacologically blocking inhibition scales down mEPSCs. Synaptic scaling is accompanied by changes in postsynaptic AMPA receptor (AMPAR) cluster size (O'Brien et al., 1998; Turrigiano et al., 1998) and its subunit composition (Ju et al., 2004; Thiagarajan et al., 2005; Sutton et al., 2006; Aoto et al., 2008). We reported similar regulation of AMPARs in visual cortex after several days of binocular deprivation (Goel et al., 2006), albeit subunit composition change was not seen in a recent study using monocular deprivation (Gainey et al., 2009).
Evidence from in vitro studies suggests that activity-dependent immediate early gene product Arc (activity-regulated cytoskeleton protein)/Arg3.1 is central to synaptic scaling (Rial Verde et al., 2006; Shepherd et al., 2006). Arc/Arg3.1 mRNA is rapidly induced by elevation of neural activity (Link et al., 1995; Lyford et al., 1995) and is often used as a marker for neural activity (Guzowski et al., 2001; Tagawa et al., 2005). Arc/Arg3.1 protein interacts with endophilin 2 and 3 and promotes AMPAR endocytosis (Chowdhury et al., 2006). These results suggest that activity-dependent increase in Arc/Arg3.1 downregulates synaptic AMPARs. Consistent with this model, hippocampal cultures derived from Arc/Arg3.1 knock-outs (KOs) display larger mEPSCs and fail to adequately undergo synaptic scaling with pharmacological manipulations of neural activity (Shepherd et al., 2006).
Recent studies using Arc/Arg3.1 KOs revealed a role of Arc/Arg3.1 in orientation tuning of visual inputs (Wang et al., 2006) and in ocular dominance plasticity (McCurry et al., 2010). However, the contribution of Arc/Arg3.1 to homeostatic scaling in the visual cortex, or any in vivo model, has not been explored. Here, we demonstrate that Arc/Arg3.1 is selectively involved in visual experience-induced homeostatic scaling of excitatory synapses using Arc/Arg3.1 KOs.
Materials and Methods
Manipulation of visual experience.
Both male and female Arc/Arg3.1 KO and wild-type (WT) mice were raised in a normally lighted environment (12 h light/dark cycle). Some mice were dark reared (DR) for the duration of 2 d initiated at postnatal day 21 (P21). Control [normal reared (NR)] mice were continuously raised in the normal lighted condition for the same duration. The animals in the dark were cared for using infrared vision goggles under dim infrared light. Some of the DR mice were taken out to the lighted environment for 2 h (+2hL) or 1 d (+1dL) to study the effect of reexposure to light.
Preparation of visual cortical slices.
Each mouse was deeply anesthetized by placing it in a chamber with isoflurane vapors and killed by decapitation. The brain was rapidly removed and immersed in ice-cold dissection buffer (in mm: 212.7 sucrose, 5 KCl, 1.25 NaH2PO4, 26 NaHCO3, 10 glucose, 3 MgCl2, and 1 CaCl2) saturated with 95% O2/5% CO2 mixture. Blocks of primary visual cortices were rapidly dissected and sectioned in the coronal plane into 300-μm-thick slices using a Vibratome 3000 plus microslicer (Ted Pella). The slices were collected in ice-cold dissection buffer and gently transferred to a submersion holding chamber with artificial CSF (ACSF) (in mm: 124 NaCl, 5 KCl, 1.25 NaH2PO4, 26 NaHCO3, 10 glucose, 1 MgCl2, and 2 CaCl2) saturated with 95% O2/5% CO2. The slices were recovered at room temperature for ∼1 h before recording.
Immunohistochemistry and confocal image analysis.
Visual cortical slices were prepared as above and recovered for ∼1–2 h at room temperature before transfer into ice-cold 4% paraformaldehyde solution, pH 7.4. The slices were kept in paraformaldehyde overnight at 4°C, placed in ice-cold 30% sucrose [in NaPO4 buffer (50 mm NaH2PO4 and 200 mm Na2HPO4, pH 7.4)] overnight, resectioned in the coronal plane into 40-μm-thick slices using a freezing sliding microtome (Leica), and stored in cryoprotectant (20% sucrose, 30% ethylene glycol, and 0.02% sodium azide in NaPO4 buffer at −20°C until used). Brain sections were rinsed in PBS (in mm: 137 NaCl, 2.7 KCl, 8 Na2HPO4, and 2 KH2PO4, pH 7.4) four times for 5 min each on a gentle rotator at room temperature and incubated in −20°C methanol for 10 min, followed by four washes for 5 min each in PBS at room temperature before being incubated in blocking solution (10% normal donkey serum, 0.2% Triton X-100, and 4% BSA in PBS, pH 7.4) for 1 h. Sections were then incubated in both anti-Arc (Santa Cruz Biotechnology) and anti-neuronal-specific nuclear protein (NeuN) (clone A60; Millipore Bioscience Research Reagents), which were diluted 1:100 in blocking solution, for 2 d on a shaker at 4°C. Brain sections were then rinsed four times for 5 min each in PBS at room temperature and incubated in secondary antibodies conjugated to Alexa488 or Alexa633 (Invitrogen), which were diluted 1:200 in 1.5% normal donkey serum in PBS, at room temperature for 2 h. Sections were rinsed four times for 5 min each and a final time for 10 min in PBS at room temperature. They were then mounted on precleaned glass slides, air dried overnight in the dark, and coverslipped with mounting solution (Prolong Anti-fade; Invitrogen).
Fluorescence signals from fluorophore-conjugated secondary antibodies were imaged using a Carl Zeiss LSM510 confocal laser-scanning microscope. Filters and dichroic mirrors were set to detect signals given from Alexa488 (bandpass, 505–530 nm) and Alexa633 (long-pass, 650 nm) using a dual-scan mode. Sections were imaged using a 63× oil-immersion objective lens and scanned as z-stacks. Confocal images were analyzed using the image analysis program Volocity (Improvision). The mean of whole-field fluorescence intensity values were quantified for Arc/Arg3.1 to determine changes in protein expression under different conditions. The mean intensity for all samples was normalized to the average value of the NR group, and the normalized mean intensities were compared across the groups using a one-way ANOVA, followed by a Fisher's protected least significant difference (PLSD) post hoc test. p < 0.05 was taken as significant. In addition, NeuN-positive cells were counted per image area.
Tissue preparation for measuring total protein.
Visual cortices were quickly dissected and homogenized in ice-cold IPB (20 mm Na3PO4, 150 mm NaCl, 10 mm EDTA, 10 mm EGTA, 10 mm Na4P2O7, 50 mm NaF, and 1 mm Na3VO4, pH 7.4, with 1 μm okadaic acid and 10 KIU/ml aprotinin) by sonication. The homogenates were briefly centrifuged at 1000 × g to remove unhomogenized tissue. Protein concentration was measured and normalized to 2 mg/ml by addition of gel sample buffer. Samples were boiled for 5 min and processed for immunoblot analysis.
Immunoblot analysis.
Samples run on SDS-PAGE gels were transferred to polyvinyl difluoride membranes (Millipore Corporation) for immunoblot analysis. Blots were incubated in blocking buffer (5% bovine serine albumin and 0.1% Tween 20 in PBS, pH7.4) for ∼1 h. Blots were incubated in specific primary antibodies [anti-Arc/Arg3.1 (affinity purified by P.W.), anti-GluR1 (Santa Cruz Biotechnology or Millipore Corporation), anti-GluR2/3 (Millipore Corporation), anti-GluR2 (Millipore Corporation), anti-NR1 (Zymed), anti-NR2A (Millipore Corporation), anti-NR2B (Zymed), anti-GluR1–pS831 (Millipore Corporation), anti-GluR1–pS845 (Millipore Corporation), anti-Pick1 (Millipore Corporation), anti-Grip1 (Millipore Corporation), anti-SAP97 (Affinity BioReagents), anti-PSD95 (Millipore Corporation), and anti-synaptophysin (Zymed)] for 1–2 h at room temperature or overnight at 4°C, then washed in blocking buffer four times for 5 min each, and incubated in corresponding secondary antibodies conjugated with cyanine 3 or 5 (GE Healthcare) at room temperature for 1 h. ECLplex (GE Healthcare) system was used, which allowed simultaneous probing with two primary antibodies from different hosts. The blots were then scanned on a Typhoon Trio (GE Healthcare). The digitized fluorescence signals were quantified using Image Quant TL software (GE Healthcare). For most experiments (except surface biotinylation; see below), the quantified intensities from each blot were normalized to either the average WT signal or average NR signal from the same blot to calculate the percentage of average WT or the percentage of average NR. For statistical comparisons, Student's unpaired t test or one-way ANOVA was used as appropriate. p < 0.05 was taken as statistically significant.
Whole-cell recording of mEPSCs.
The visual cortical slices were moved to a submersion-type recording chamber mounted on a stage of an upright microscope (E600 FN-1; Nikon) equipped with infrared oblique illumination. Layer 2/3 (L2/3) pyramidal cells were visually identified and patched using a whole-cell patch pipette (tip resistance, 3–5 MΩ) filled with intracellular solution [in mm: 130 Cs-gluconate, 8 KCl, 1 EGTA, 10 HEPES, 4 ATP, and 5 QX-314 (lidocaine N-ethyl bromide), pH 7.3 (285–295 mOsm)]. To isolate AMPA receptor-mediated mEPSCs, 1 μm TTX, 20 μm bicuculline, and 100 μm d,l-APV were added to the ACSF (2 ml/min, 30 ± 1°C), which was continually bubbled with 95% O2/5% CO2. mEPSCs were recorded at a holding potential of −80 mV using an Axopatch 700B amplifier (Molecular Devices), digitized at 10 kHz by a data acquisition board (National Instruments), and acquired using a custom-made Igor Pro software (WaveMetrics). Acquired mEPSCs were analyzed using the Mini Analysis program (Synaptosoft). The threshold for detecting mEPSCs was set at three times the root mean square (RMS) noise. There was no significant difference in RMS noise between the experimental groups [WT at P23: NR = 1.7 ± 0.05 (n = 16), DR = 1.9 ± 0.05 (n = 12), +2hL = 1.7 ± 0.05 (n = 16), +1dL = 1.9 ± 0.05 (n = 17); ANOVA, F(3,57) = 1.4, p > 0.2; KO at P23, NR = 1.9 ± 0.04 (n = 14), DR = 1.8 ± 0.04 (n = 14), +2hL = 1.8 ± 0.02 (n = 15), +1dL = 1.7 ± 0.06 (n = 14); ANOVA, F(3,53) = 1.8, p > 0.1; NR WT and KO at P23, t test, p > 0.05; NR WT at P11 = 1.7 ± 0.04 (n = 12), NR KO at P11 = 1.7 ± 0.05 (n = 13); t test, p > 0.5]. A possibility of dendritic filtering was assessed by plotting the amplitude of mEPSC against the rise time. Cells showing a negative correlation between the mEPSC amplitude and rise time (i.e., dendritic filtering present) were excluded from analysis, as well as mEPSCs with >3 ms rise time (measured between 10 and 90% of amplitude). Average mEPSC amplitude and frequency were calculated and compared across different experimental groups using one-factor ANOVA or unpaired Student's t test as noted in text. In multigroup comparisons, Fisher's PLSD post hoc test was used following ANOVA to determine which group showed a difference. Only the cells and recording conditions that met the following criteria were studied: Vm of −65 mV, Rinput of >200 MΩ, Rseries of <25 MΩ. Cells were discarded if Rinput or Rseries changed >15%. Junction potentials were typically <5 mV and were left uncompensated. TTX, bicuculline, d,l-APV, and 2,3-dihydroxy-6-nitro-7-sulfonyl-benzo[f]quinoxaline (NBQX) were purchased from Sigma/RBI.
Whole-cell recording of evoked synaptic currents.
Evoked AMPA receptor-mediated synaptic currents (AMPAR-EPSCs) were measured from layer 2/3 pyramidal cells of visual cortices in response to stimulation through a bipolar electrode placed in layer 4. To isolate the AMPA receptor component, 100 μm d,l-APV and 20 μm bicuculline were added to the bath solution. The concentration of CaCl2 and MgCl2 in the ACSF were changed to 4 and 2 mm, respectively, to prevent polysynaptic responses during stimulation in the presence of bicuculline. Intracellular recording solution containing 200 μm spermine [containing (in mm): 90 CsMeSO3H, 5 MgCl2, 8 NaCl, 10 EGTA, 20 HEPES, 1 QX-314, 0.5 Na3GTP, and 2 MgATP, pH 7.3 (250–270 mOsm)] was used. For generating current–voltage (I–V) curves for rectification measurements, cells were held at −60, −40, −20, 0, +20, and +40 mV. Inward rectification (IR) was calculated by dividing the absolute amplitude of average EPSC measured at −60 mV by that at +40 mV. There were no significant differences in the calculated reversal potentials between the groups (WT, 9.25 ± 1.32 mV, n = 6; KO, 11.92 ± 1.87 mV, n = 10; t test, p > 0.1). Reversal potentials were calculated using equations generated by fitting a linear regression to the current values collected at negative holding potentials (Vh). For measuring the ratio of AMPAR-EPSC and NMDAR-EPSC, only 20 μm bicuculline was added to the bath solution and used a spermine-free intracellular solution. AMPAR-EPSC amplitude was measured as the EPSC peak at −70 mV, whereas the NMDAR component of EPSCs were recorded at +40 mV and measured as amplitude at three times the decay time constant (τ) of AMPAR-EPSCs.
Whole-cell recording of mIPSCs.
mIPSCs were recorded in layer 2/3 pyramidal cells in the presence of 1 μm TTX, 100 μm d,l-APV, and 10 μm NBQX and analyzed with the Mini Analysis program (Synaptosoft). Intracellular recording solution that allows GABAAR-mediated IPSCs to reverse at 0 mV (Morales et al., 2002) was used [in mm: 140 CsCl, 8 KCl, 10 EGTA, 10 HEPES, and 10 QX-314, pH of 7.3 (275–285 mOsm)]. Cells were held at −80 mV to record mIPSCs. The threshold for detecting mIPSCs was set at three times the RMS noise. There was no significant difference in RMS noise between the experimental groups (WT, 2.5 ± 0.1, n = 21; KO, 2.8 ± 0.1, n = 19; t test, p > 0.08; WT at P23: NR = 2.2 ± 0.05, n = 17; DR = 2.3 ± 0.08, n = 18; +2hL = 2.4 ± 0.08, n = 14; ANOVA, F(2,46) = 1.9, p > 0.2; KO at P23: NR = 2.4 ± 0.09, n = 15; DR = 2.3 ± 0.11, n = 15; +2hL = 2.4 ± 0.09, n = 15; ANOVA, F(2,42) = 0.4, p > 0.6). Cells showing a negative correlation between mIPSC amplitude and rise time were excluded from analysis, as well as mIPSCs with >5 ms rise time (measured between 10 and 90% of amplitude). Three hundred fifty to 500 consecutive events from each experiment were considered for the determination of mIPSC frequency, but highly superimposed events constituting “bursts” (more than two events, interevent interval of <10 ms) were excluded from the measurement of amplitudes (300 non-burst events from each cell were used for average mIPSC amplitude calculations). The decay time constant was calculated using the average of 150–200 well isolated events.
Steady-state surface biotinylation.
Visual cortex slices (400 μm thick) were prepared as described above. After 30 min recovery at room temperature, the slices were transferred to 30°C for additional 30 min recovery. The slices were then transferred to ice-cold ACSF for 10 min and subsequently to ice-cold ACSF containing 2 mg/ml biotin (EZ-Link Sulfo-NHS-Biotin; Pierce) saturated with 5% CO2/95% O2 for 15 min. The slices were then washed in Tris-buffered saline (50 mm Tris and 0.9% NaCl, pH 7.4) containing 100 mm glycine five times for 1 min each before being homogenized in ice-cold 0.2% SDS/1% Triton X-100 IPB (20 mm Na3PO4, 150 mm NaCl, 10 mm EDTA, 10 mm EGTA, 10 mm Na4P2O7, 50 mm NaF, and 1 mm Na3VO4, pH 7.4, with 1 μm okadaic acid and 10 KIU/ml aprotinin) by ∼30 gentle strokes using glass–Teflon tissue homogenizers (Pyrex). The homogenates were centrifuged for 10 min at 13,200 × g, 4°C. Protein concentration of the supernatant was measured and normalized to 2 or 4 mg/ml. Some of the supernatants were saved as inputs by adding gel sampling buffer and boiled for 5 min. A total of 400 μg of each supernatant was mixed with neutravidin slurry [1:1 in 1% Triton X-100 IPB (TX-IPB)] and rotated overnight at 4°C. The neutravidin beads were isolated by brief centrifugation at 1000 × g. Some of the supernatants were saved by adding gel sample buffer and boiled for 5 min. The neutravidin beads were washed three times with 1% TX-IPB, three times with 1% TX-IPB containing 500 mm NaCl, followed by two washes in 1% TX-IPB. The biotinylated surface proteins were then eluded from the neutravidin beads by boiling in gel sampling buffer for 5 min. The input (total homogenate), supernatant (intracellular fraction), and biotinylated samples (surface fraction) were run on the same gel and processed for immunoblot analysis using GluR1, GluR2, and actin antibodies. The band intensity in the input lanes and biotin lanes, which fell within the linear range, was quantified to calculate the percentage of total GluR1 or GluR2 on the surface for each sample.
Postsynaptic density preparation.
The postsynaptic density (PSD) was prepared according to the procedure described previously (Goel et al., 2006). In brief, visual cortices were quickly dissected and homogenized in ice-cold HEPES-buffered sucrose [0.32 m sucrose, 4 mm HEPES, pH 7.4, containing 2 mm EGTA, 50 mm NaF, 10 mm Na4P2O7, 1 mm Na3VO4, 1 μm okadaic acid (Calbiochem), and protease inhibitors (protease inhibitor cocktail; Pierce)] using glass–Teflon tissue homogenizers (Pyrex). The homogenates were centrifuged at 800 × g for 10 min (4°C) to remove the nuclear pellets (P1), and the remaining supernatants (S1) were centrifuged at 10,000 × g for 15 min (4°C) to yield the crude membrane pellets (P2). P2 fractions were resuspended in HEPES-buffered sucrose and respun at 10,000 × g for 15 min (4°C) to yield the washed crude membrane fractions (P2′). P2′ fractions were then lysed in ice-cold 4 mm HEPES, pH 7.4 (with protease inhibitors) for at least 30 min before 20 min of centrifugation at 25,000 × g to yield lysed synaptosomal membrane fractions (P3). P3 were subsequently resuspended in HEPES-buffered sucrose and loaded on a discontinuous sucrose gradient (1.2 m, 1.0 m, and 0.8 m sucrose with inhibitors) for 2 h at 150,000 × g (4°C). Synaptic plasma membrane (SPM) fractions were collected between 1.0 and 1.2 m sucrose. After dilution with 2.5 vol of 4 mm HEPES with inhibitors, the SPM pellets were collected by centrifugation at 150,000 × g for 30 min (4°C). The pellets were then resuspended in 0.5% Triton X-100, HEPES–EDTA solution (50 mm HEPES and 2 mm EDTA, pH 7.4) with protease inhibitors and lysed for 15 min at 4°C. The lysed SPMs were then centrifuged at 32,000 × g for 20 min (4°C) to yield the PSD fraction. Four micrograms of PSD proteins were loaded per lane for gel electrophoresis and processed for immunoblot analysis using GluR1 and GluR2 antibodies. GluR1 and GluR2 intensities for each sample were normalized to the average of the WT samples loaded on each gel to derive the percentage of average WT.
Results
Arc/Arg3.1 protein expression is regulated by visual experience
We examined the time course of Arc/Arg3.1 protein expression in an experimental model used to study homeostatic synaptic plasticity in visual cortex. Arc/Arg3.1 protein was detected by immunohistochemistry and quantified from confocal image stacks obtained from visual cortical sections from four groups of mice: NR, DR for 2 d (from P21 to P23), and 2 d DR mice reexposed to light for 2 h (+2hL) or 1 d (+1dL). Similar to previous reports looking at transcriptional regulation (Lyford et al., 1995; Wang et al., 2006), Arc/Arg3.1 protein was significantly increased in L2/3 of visual cortex in +2hL and +1dL groups compared with NR (Arc mean intensity: NR = 100 ± 4.0% of average NR, n = 28 sections; DR = 121 ± 7.7%, n = 32; +2hL = 141 ± 13%, n = 27; +1dL = 126 ± 8.3%, n = 30; from 4 mice each group; ANOVA, F(3,113) = 3.741, p < 0.02) (Fig. 1A,B). Whereas the increase in Arc/Arg3.1 immunoreactivity in the +2hL group was mainly at soma, the increase in the +1dL group was mainly in the neuropil. There was no significant difference in the number of NeuN-positive cells per area between the four groups (cell number/10,000 μm2: NR = 43 ± 2.7, DR = 43 ± 1.4, +2hL = 45 ± 2.6, +1dL = 44 ± 2.0; ANOVA, F(3,113) = 0.368, p > 0.7).
Figure 1.
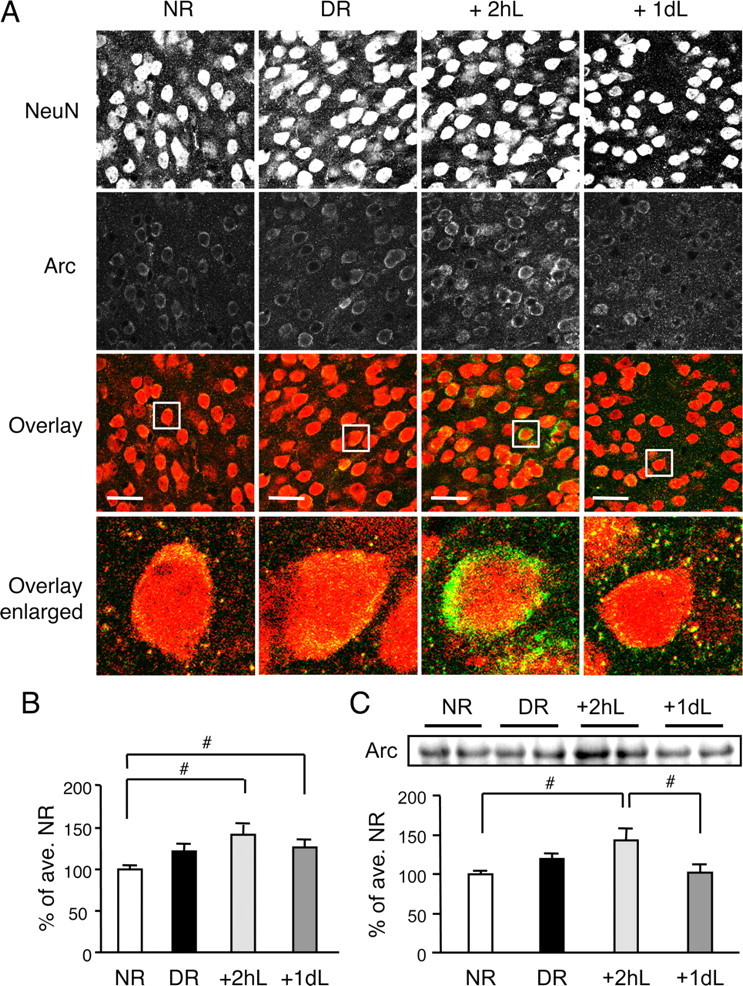
Arc/Arg3.1 protein expression in mouse primary visual cortex. A, Immunohistochemical labeling of Arc/Arg3.1 (green) and NeuN (red) in L2/3 of mouse visual cortex. Images shown are three-dimensional projections of 20 confocal sections taken at 1 μm z-axis intervals. Top row, NeuN staining in grayscale. Second row, Arc/Arg3.1 staining in grayscale. Third row, Overlay of NeuN and Arc/Arg3.1 in color. Scale bars, 30 μm. Bottom panels, Zoom-in of the areas indicated in the overlay panels. B, Comparison of mean Arc/Arg3.1 staining intensity normalized to that of average NR. #p < 0.03, Fisher's PLSD post hoc test after ANOVA. C, Quantification of Arc/Arg3.1 protein level in visual cortex homogenates of mice by immunoblot analysis. An example blot is shown in the top panel. Bottom panel, Quantification of Arc immunoblot signals. #p < 0.01, Fisher's PLSD post hoc test after ANOVA.
Increase in Arc/Arg3.1 protein was confirmed by immunoblots for the +2hL group compared with NR controls but not in the +1dL group (NR = 100 ± 4.5% of average NR, DR = 120 ± 6.4%, +2hL = 143 ± 14.8%, +1dL = 102 ± 10.4%, n = 5 mice each; ANOVA, F(3,16) = 4.121, p < 0.03) (Fig. 1C). Failure to detect an increase of Arc/Arg3.1 protein in the +1dL group by immunoblotting may be attributable to the use of the whole visual cortex, which would dilute changes in L2/3. We observed a small increase in Arc/Arg3.1 levels in the DR groups with both methods, but this did not reach statistical significance when compared with NR (Fisher's PLSD post hoc test between NR and DR: immunohistochemistry, p > 0.07; immunoblot, p > 0.1). These results demonstrate that reexposing dark-reared mice to light rapidly upregulates Arc/Arg3.1 protein expression in visual cortex.
Synaptic proteins in visual cortex of Arc/Arg3.1 knock-out mice
Surface AMPAR are increased in Arc/Arg3.1 KO neurons in culture and exhibit a reduced rate of endocytosis (Shepherd et al., 2006). To assess how Arc/Arg3.1 KOs might affect AMPAR expression and trafficking in vivo, we first compared the expression level of AMPAR subunit GluR1 and GluR2/3, as well as known interacting proteins Grip1 and Pick1. We did not find significant differences in GluR1, GluR2/3, or Pick1 protein levels quantified from total homogenates of visual cortex obtained from WT and KO (GluR1: WT = 100 ± 10.3% of average WT, KO = 113 ± 6.3%, n = 9 each, t test, p > 0.3; GluR2/3: WT = 100 ± 11.5%, KO = 141 ± 21.5%, n = 13 each, t test, p > 0.1; Pick1: WT = 100 ± 8.4%, n = 7, KO = 105 ± 8.4%, n = 9, t test, p > 0.6) (Fig. 2A). Unexpectedly, Grip1 was significantly increased in the KOs compared with WTs (WT = 100 ± 9.7% of average WT, n = 12; KO = 173 ± 31.3%, n = 13; t test, p < 0.04) (Fig. 2A).
Figure 2.

Comparison of AMPAR and associated proteins in the visual cortex of Arc/Arg3.1 KO and WT. A, Immunoblot analysis of AMPAR subunits (GluR1 and GluR2/3) and associated proteins (Grip1 and Pick1). Left, Representative immunoblots of WT and KO visual cortex homogenates probed with antibodies against Arc, GluR1 C terminal, GluR2/3 C terminal, Grip1, and Pick1. Right, Quantification of immunoblots. The band intensity was normalized to that of the average WT values to obtain percentage of average WT values. *p < 0.05, t test. B, Surface levels of GluR1 and GluR2 subunits measured by steady-state surface biotinylation in visual cortical slices of WT and KO. Left, Example immunoblots of total homogenate (Input), supernatant (Sup), and biotinylated (Biotin) samples probed with antibodies against GluR1 C terminal (top), GluR2 N terminal (middle), and actin (bottom). The absence of actin in the biotin lanes confirms the specificity of biotinylation of surface proteins. Right, Quantification of surface GluR1 and GluR2. The signals of the input lanes and the biotin lanes were used to calculate the percentage of total GluR1 and GluR2 on the surface (% of total). C, GluR1 and GluR2 levels in the isolated PSD fractions of WT and KO were not significantly different. Left, Representative immunoblots probed with GluR1 C-terminal and GluR2 N-terminal antibodies. Right, Quantification of the immunoblot signals. D, Increase in GluR1 phosphorylation on S831 (left), but not S845 (right), in visual cortex of Arc/Arg3.1 KOs. Top, Representative blots probed with phospho-specific antibodies (P) and GluR1 C-terminal antibody (C). E, No difference in AMPAR I–V relationship measured from L2/3 neurons during L4 stimulation. Left, Example superimposed traces taken at Vh of −60 mV (inward current) and +40 mV (outward current). Right, I–V curve plotting AMPAR current amplitude at different Vh. Open circles, WT; filled circles, KO.
We next examined whether there are changes in the surface expression of AMPARs in the Arc/Arg3.1 KOs. To do this, we performed steady-state surface biotinylation on visual cortical slices. We did not find any significant difference in the surface expression levels of GluR1 or GluR2 subunits of AMPARs in visual cortical slices of KO compared with WT (surface GluR1: WT = 33 ± 8.7% of total GluR1, KO = 31 ± 16.0% of total GluR1, n = 7 each, t test, p > 0.8; surface GluR2: WT = 56 ± 21.8% of total GluR2, KO = 56 ± 22.0% of total GluR2; n = 7 each, t test, p > 0.9) (Fig. 2B). Neither did we find any alterations in synaptic AMPAR levels measured from biochemically isolated PSD fractions (GluR1: WT = 100 ± 3.3% of average WT, n = 11; KO = 124 ± 13.0%, n = 10, t test, p > 0.5; GluR2: WT = 100 ± 9.9%, n = 11; KO = 113 ± 17.3%, n = 10; t test, p > 0.9) (Fig. 2C). Furthermore, there was no functional indication of a change in synaptic AMPAR subunit composition as seen by a normal I–V relationship of AMPAR responses recorded in L2/3 pyramidal neurons after stimulation of L4 [IR index calculated as the amplitude of evoked AMPAR-EPSC measured at −60 mV divided by that at +40 mV (I−60 mV/I+40 mV): WT = 2.7 ± 0.4, n = 6; KO = 2.9 ± 0.3, n = 10; t test, p > 0.7] (Fig. 2E). Interestingly, we found that phosphorylation of the GluR1 subunit on serine-831 (S831) is significantly increased in the KOs (WT = 100 ± 3.5% of average WT, KO = 120 ± 7.9%, n = 10 each, t test, p < 0.04) (Fig. 2D) without changes in the S845 phosphorylation (WT = 100 ± 2.0%, KO = 105 ± 3.1%, n = 10 each, t test, p > 0.2) (Fig. 2D). The S831 site is phosphorylated by PKC (Roche et al., 1996) and calcium/calmodulin-dependent kinase II (CaMKII) (Barria et al., 1997; Mammen et al., 1997) and is known to increase the single-channel conductance of AMPARs (Derkach et al., 1999; Oh and Derkach, 2005).
Next we examined whether the Arc/Arg3.1 KOs display any changes in synaptic NMDAR function. L2/3 neurons of Arc/Arg3.1 KOs displayed normal ratio of NMDAR to AMPAR responses recorded during stimulation of L4 (EPSCNMDAR/EPSCAMPAR ratio: WT = 0.37 ± 0.04, n = 14 cells; KO = 0.42 ± 0.03, n = 18 cells; t test, p > 0.5) (Fig. 3A) and expressed normal levels of NMDAR subunits NR1 (WT = 100 ± 8.0% of average WT; KO = 112 ± 10.3%; n = 9 each; t test, p > 0.3), NR2A (WT = 100 ± 4.7%; KO = 83 ± 7.1%; n = 12 each; t test, p > 0.06), and NR2B (WT = 100 ± 5.7%, n = 9; KO = 100 ± 7.6%, n = 8; t test, p > 0.9) in the total homogenate of visual cortex (Fig. 3B). In addition, we found no significant difference in a few of the key presynaptic and postsynaptic proteins between WT and KO (SAP97: WT = 100 ± 4.4%, KO = 105 ± 5.3%, n = 9 each, t test, p > 0.4; PSD95: WT = 100 ± 5.8%, KO = 93 ± 5.6%, n = 9 each, t test, p > 0.3; synaptophysin: WT = 100 ± 4.6%, KO = 98 ± 7.7%, n = 9 each, t test, p > 0.8) (Fig. 3C). These studies indicate that the expression of key synaptic proteins is not altered in the visual cortex of Arc/Arg3.1 KO mice.
Figure 3.

Comparison of NMDAR function and key synaptic proteins in visual cortex. A, Normal NMDAR-EPSC to AMPAR-EPSC ratio in Arc/Arg3.1 KOs. Evoked EPSCs were measured in L2/3 pyramidal neurons after L4 stimulation. Left, Superimposed representative EPSC traces measured at −70 mV (AMPAR-EPSC) and +40 mV (compound EPSC of AMPAR and NMDAR). The size of AMPAR response was measured as the peak amplitude at −70 mV, and the magnitude of NMDAR response was measured at three times the AMPAR decay time constant (τ) at +40 mV. Right, Comparison of average NMDAR/AMPAR ratio of WT and KO. NMDAR/AMPAR ratio values from individual cells are plotted as small open circles. The average values are shown in filled circles, with error bars denoting SEM. B, Arc/Arg3.1 KOs expressed normal levels of NMDAR subunits NR1, NR2A, and NR2B in the total homogenate of visual cortex. C, The expression levels of postsynaptic proteins SAP97 and PSD95 and a presynaptic protein synaptophysin (Synapto.) were normal in KOs.
Larger basal mEPSC and mIPSC in L2/3 pyramidal neurons of Arc/Arg3.1 KO visual cortex
Next, we recorded mEPSCs and mIPSCs in L2/3 pyramidal neurons to determine possible changes in basal synaptic transmission. Arc/Arg3.1 KOs showed a small but significant increase in the amplitude of mEPSCs (WT = 12.5 ± 0.3 pA, n = 16; KO = 13.8 ± 0.6 pA, n = 14; t test, p < 0.05) (Fig. 4A) without changes in mEPSC frequency (WT = 3.6 ± 0.3 Hz, n = 16; KO = 3.5 ± 0.5 Hz, n = 14; t test, p > 0.8) (Fig. 4A) or kinetics (Table 1). Multiplying the amplitude of each mEPSC of WT by a scaling factor (WTscaled = WT × 1.1) allowed the resulting cumulative probability curve to overlap with that of KOs (Fig. 4A). mIPSCs in L2/3 neurons were also increased (Fig. 4C). We measured mIPSCs at a negative holding potential of −80 mV using an internal solution that reverses IPSCs at 0 mV (Morales et al., 2002) (Fig. 4B) to prevent potential decreases in mIPSC amplitude by depolarization-induced suppression of inhibition (Pitler and Alger, 1992). We confirmed the isolation of mIPSCs using this condition by a complete and reversible block by application of bicuculline (Fig. 4B). The average amplitude of mIPSCs was larger in Arc/Arg3.1 KOs compared with WTs (WT = 36.4 ± 2.1 pA, n = 21; KO = 43.9 ± 2.0 pA, n = 19; t test, p < 0.03) without significant changes in mIPSC frequency (WT = 7.8 ± 0.43 Hz, KO = 8.9 ± 0.64 Hz; t test, p > 0.1) (Fig. 4C) or kinetics (Table 1). The increase in mIPSC amplitude was multiplicative in nature (KO = WT × 1.2) (Fig. 4C), consistent with the notion that the increase in mEPSC and mIPSC are balanced adaptations.
Figure 4.

Arc/Arg3.1 KOs display larger basal mEPSCs and mIPSCs in L2/3 pyramidal neurons of visual cortex. A, Comparison of mEPSCs recorded from P23 normal-reared WT and KO. Left, Multiplicative increase in mEPSC amplitude of KO compared with WT. The cumulative probability curve of WT mEPSC amplitudes (black solid line) multiplied with a scaling factor (WTscaled, scaling factor of 1.1; black dashed line) superimposed with that of KO (gray solid line) (K–S test, p > 0.3). Right, Average mEPSC traces from WT and KO. *p < 0.05, t test. B, Left, Verification that the internal solution used reverses mIPSCs at 0 mV. Each trace was recorded under different holding voltage as indicated. Right, The pharmacologically isolated mIPSCs are blocked by addition of 20 μm bicuculline (+BMI). C, Comparison of mIPSCs recorded from P23 normal-reared WT and KO. Left, Larger mIPSC amplitude in KOs is multiplicative to that of WTs. Cumulative probability curve of mIPSC amplitude of WTscaled (scaling factor of 1.2; black dashed line) overlapped with that of KO (gray solid line). WT, Black solid line. Right, Average mIPSC traces. *p < 0.03, t test.
Table 1.
Neuronal properties
| Age | mPSC | Genotype | Condition | Rise time (10–90%) (ms) | Decay time constant (τ, ms) | Ri (MΩ) | Rs (MΩ) |
|---|---|---|---|---|---|---|---|
| P11 | mEPSC | WT | NR (n = 12) | 1.4 ± 0.1 | 2.8 ± 0.2 | 569 ± 19 | 21 ± 1.0 |
| KO | NR (n = 13) | 1.4 ± 0.1 | 3.1 ± 0.2 | 510 ± 26 | 20 ± 1.0 | ||
| P23 | mEPSC | WT | NR (n = 16) | 1.5 ± 0.03 | 3.0 ± 0.1 | 455 ± 58 | 20 ± 0.9 |
| DR (n = 12) | 1.5 ± 0.03 | 3.0 ± 0.1 | 303 ± 41 | 18 ± 1.1 | |||
| +2hL (n = 16) | 1.6 ± 0.04* | 3.4 ± 0.2 | 371 ± 43 | 19 ± 1.1 | |||
| +1dL (n = 17) | 1.4 ± 0.04 | 2.9 ± 0.1 | 294 ± 42 | 16 ± 0.6 | |||
| KO | NR (n = 14) | 1.5 ± 0.03 | 3.2 ± 0.1 | 394 ± 57 | 20 ± 1.2 | ||
| DR (n = 14) | 1.5 ± 0.03 | 3.2 ± 0.1 | 329 ± 32 | 18 ± 1.6 | |||
| +2hL (n = 15) | 1.5 ± 0.03 | 3.3 ± 0.1 | 244 ± 15 | 17 ± 0.5 | |||
| +1dL (n = 14) | 1.6 ± 0.06 | 3.5 ± 0.2 | 341 ± 40 | 21 ± 0.7 | |||
| P23 | mIPSC | WT | NR (n = 17) | 1.9 ± 0.06 | 6.3 ± 0.2 | 265 ± 11 | 20 ± 0.9 |
| DR (n = 18) | 1.8 ± 0.06 | 6.8 ± 0.2 | 251 ± 9 | 18 ± 0.8 | |||
| +2hL (n = 14) | 1.7 ± 0.04 | 6.4 ± 0.2 | 268 ± 16 | 18 ± 0.6 | |||
| KO | NR (n = 15) | 1.8 ± 0.04 | 6.0 ± 0.1 | 250 ± 15 | 20 ± 1.1 | ||
| DR (n = 15) | 1.8 ± 0.05 | 6.3 ± 0.2 | 261 ± 21 | 20 ± 1.0 | |||
| +2hL (n = 15) | 1.8 ± 0.05 | 6.1 ± 0.2 | 257 ± 14 | 18 ± 0.9 |
*p < 0.05, statistically different from NR of the same genotype, Fisher's PLSD post hoc test after one-way ANOVA.
Arc/Arg3.1 knock-outs lack visual experience-dependent homeostatic synaptic plasticity in L2/3 visual cortex
We investigated whether visual experience-dependent homeostatic synaptic plasticity is affected in the Arc/Arg3.1 KOs. Previously, we reported that 2 d of DR is required to scale up mEPSCs in L2/3 pyramidal neurons, and 1 d of reexposure to light is sufficient at reversing this (Goel and Lee, 2007). Because Arc/Arg3.1 protein expression peaked at 2 h of light reexposure (Fig. 1), we also measured mEPSCs in the +2hL group in this study. We found that 2 d of DR increased mEPSC amplitude in WTs, and this was reversed by reexposing DR mice to light for either 2 h or 1 d (NR = 12.5 ± 0.3 pA, n = 16; DR = 15.3 ± 0.5 pA, n = 12; +2hL = 12.8 ± 0.6 pA, n = 16; +1dL = 14.0 ± 0.3 pA, n = 17; ANOVA, F(3,57) = 6.7, p < 0.001) (Fig. 5A). There was no statistically significant change in mEPSC frequency across groups (NR = 3.6 ± 0.33 Hz, n = 16; DR = 3.1 ± 0.46 Hz, n = 12; +2hL = 2.9 ± 0.36 Hz, n = 16; +1dL = 3.6 ± 0.45 Hz, n = 17; ANOVA, F(3,57) = 0.719, p > 0.5) (Fig. 5A). Considering that 2 d was the minimal duration of DR required to scale up L2/3 mEPSCs maximally (Goel and Lee, 2007), the reversal by 2 h of light underscores an asymmetry in the time course of scaling up and down of excitatory synapses. In line with previous studies (Turrigiano et al., 1998; Goel et al., 2006; Goel and Lee, 2007), scaling up of mEPSCs by DR and scaling down by light exposure both followed the rules of multiplicative scaling (Fig. 5B,C).
Figure 5.

Absence of visual experience-induced homeostatic plasticity of mEPSCs in L2/3 of Arc/Arg3.1 KO visual cortex. A, Bidirectional synaptic scaling in WT. Left, Two days of DR increased mEPSC amplitude, and reexposure to light for 2 h (+2hL) or 1 d (+1dL) reversed this. Middle, Average mEPSC traces from the four groups. Right, No change in mEPSC frequency (ANOVA, F(3,57) = 0.7, p > 0.5). *p < 0.01, Fisher's PLSD post hoc test. B, Multiplicative scaling up of mEPSCs with DR in WT. The cumulative probability curve of NRscaled [black dashed line, multiplying mEPSCs from NR (black solid line) with a scaling factor of 1.2] overlapped with that of DR (gray solid line). C, Multiplicative scaling down of mEPSCs with 2 h of light reexposure (+2hL) in WT. The cumulative probability curve of DRscaled (black dashed line; DR mEPSCs multiplied by a scaling factor of 0.8) overlapped with that of +2hL (gray solid line). DR, Black solid line. D, Visual experience failed to alter mEPSCs in KOs. Left, No change in mEPSC amplitude with DR, +2hL, or +1dL. Middle, Average mEPSC traces from the four groups. Right, No significant change in mEPSC frequency (ANOVA, F(3,53) = 2.3, p > 0.08). E, No change in mEPSC amplitude distribution between NR and DR KOs. F, No change in mEPSC amplitude distribution between DR and +2hL KOs.
In contrast to WTs, Arc/Arg3.1 KOs failed to alter mEPSC amplitude with changes in visual experience (NR = 13.8 ± 0.6 pA, n = 14; DR = 13.5 ± 0.5 pA, n = 14; +2hL = 13.5 ± 0.4 pA, n = 15; +1dL = 13.5 ± 0.6 pA, n = 14; ANOVA, F(3,53) = 0.1, p > 0.9) (Fig. 5D–F). Also, there was no statistically significant change in mEPSC frequency (NR = 3.5 ± 0.46 Hz, n = 14; DR = 2.8 ± 0.28 Hz, n = 14; +2hL = 2.3 ± 0.32, n = 15; +1dL = 2.8 ± 0.27 Hz, n = 14; ANOVA, F(3,53) = 2.316, p > 0.8) (Fig. 5D) or kinetics (Table 1) with visual manipulations. These results suggest that Arc/Arg3.1 is critical for experience-dependent homeostatic scaling of excitatory synapses in L2/3 visual cortical neurons.
Arc/Arg3.1 knock-outs display developmental decrease in mEPSCs like wild types
Previous studies showed that mEPSCs in neurons of visual cortex, including L2/3, display a developmental decrease in amplitude, which was attributed to scaling down of excitatory synapses by visual experience after eye opening (Desai et al., 2002; Goel and Lee, 2007). Our observation that Arc/Arg3.1 KOs lack visual experience-dependent scaling down of mEPSCs prompted us to consider the possibility that the small increase in basal mEPSCs observed in KOs may be attributable to a failure of the normal developmental decrease in mEPSC amplitude. To examine this, we measured mEPSCs in P11 pups before the eyes open, which happens at approximately P14. At P11, KOs had mEPSCs comparable with WTs (mEPSC amplitude: P11 WT = 16.4 ± 0.7 pA, n = 12; P11 KO = 17.7 ± 0.9 pA, n = 13; t test, p > 0.2; mEPSC frequency: P11 WT = 0.46 ± 0.06 Hz, n = 12; P11 KO = 0.52 ± 0.05, n = 13; t test, p > 0.4) (Fig. 6). However, when the measurements from P11 were compared with that obtained from P23 mice, we observed that both genotypes show significant decreases in mEPSC amplitude during development (WT at P11 vs P23: t test, p < 0.0002; KO at P11 vs P23: t test, p < 0.002) (Fig. 6) accompanied by a significant increase in mEPSC frequency (WT at P11 vs P23: t test, p < 0.00001; KO at P11 vs P23: t test, p < 0.0001) (Fig. 6). However, unlike what was predicted from previous studies, the developmental decrease in mEPSC amplitude was not multiplicative in either WTs or KOs (Fig. 6). In both genotypes, the developmental decrease in mEPSC amplitude was associated with a significant decrease in the coefficient of variation (WT at P11 = 0.56 ± 0.01, n = 12; WT at P23 = 0.41 ± 0.02, n = 16; t test, p < 0.0001; KO at P11 = 0.61 ± 0.04, n = 13; KO at P23 = 0.44 ± 0.02, n = 14; t test, p < 0.001). Because the average amplitude of mEPSCs in P23 Arc/Arg3.1 KOs was significantly larger than the age-matched WTs, we interpret that the KOs partially lack the normal developmental decrease in mEPSC size. In addition, our data suggest that a large part of the developmental decrease in excitatory synaptic transmission is independent of Arc/Arg3.1.
Figure 6.

Arc/Arg3.1 KOs display partial impairment of developmental decrease in mEPSC amplitude in L2/3 visual cortex. A, In normal-reared WTs, a developmental decrease in mEPSC amplitude is accompanied by a developmental increase in mEPSC frequency. Left, Comparison of mEPSC amplitude of P11 and P23 WT (the P23 data are duplicated from Fig. 4A for comparison). A developmental decrease in mEPSC amplitude between P11 and P23 of WT is not multiplicative [K–S test for P23 vs P11scaled (mEPSCs of P11 multiplied by 0.8), p < 0.0001]. P23, Black solid line; P11, gray solid line; P11scaled, black dashed line. Middle, Average mEPSC traces from P11 and P23 WT. Right, A developmental increase in mEPSC frequency. Open circles, mEPSC frequency of individual cells; black circles, average mEPSC frequency for each group with error bars. **p < 0.0002, t test. B, In normal-reared Arc/Arg3.1 KOs, mEPSC amplitude at P11 is significantly larger than P23, which is accompanied by an increase in mEPSC frequency. Left, mEPSC amplitude comparison between P11 and P23 KO (the P23 data are duplicated from Fig. 4A for comparison). A non-multiplicative decrease in mEPSC amplitude during development of KO [K–S test P23 vs P11scaled (=P11 × 0.8), p < 0.002]. P23, Black solid line; P11, gray solid line; P11scaled, black dashed line. Middle, Average mEPSC traces from P11 and P23 KO. Right, A developmental increase in mEPSC frequency. Open circles, mEPSC frequency of individual cells; black circles, average mEPSC frequency for each group with error bars. **p < 0.001, t test.
Arc/Arg3.1 is not involved in visual experience-dependent regulation of mIPSCs
The increase in basal mIPSCs in Arc/Arg3.1 KOs prompted us to examine whether Arc/Arg3.1 plays a role in experience-dependent regulation of inhibitory synapses. Previous studies on inhibitory synapses in visual cortex suggest that their normal maturation, which involves increases in evoked IPSC amplitude and inhibitory synapse number, depends on visual experience (for review, see Jiang et al., 2005). However, once triggered, the maturation of inhibition is reported to occur even in the absence of vision (Morales et al., 2002). Therefore, we first examined whether the brief visual deprivation (2 d of dark rearing) started at P21 would affect mIPSCs of L2/3 pyramidal neurons.
In wild types, 2 d of DR had little effect, but 2 h of light reexposure significantly increased mIPSC amplitude (NR = 41.8 ± 1.6 pA, n = 17; DR = 43.7 ± 1.8 pA, n = 18; +2hL = 51.6 ± 2.7 pA, n = 14; ANOVA, F(2,46) = 5.9, p < 0.01) (Fig. 7A). In addition, DR decreased mIPSC frequency, and this was rapidly reversed by 2 h of light (NR = 11.9 ± 0.9 Hz; DR = 8.9 ± 0.5 Hz; +2hL = 11.8 ± 0.8 Hz; ANOVA, F(2,46) = 6.1, p < 0.01) (Fig. 7A). These data suggest that mIPSCs are rapidly regulated by visual experience. Although the average mIPSC amplitude did not change with DR, there was a small but significant difference in the distribution, as noted from the statistical analysis of the cumulative probability graphs [Kolmogorov-Smirnov (K–S) test, p < 0.01] (Fig. 7B). This suggests that there are some changes in the synaptic strength across inhibitory synapses, but these cancel each other to keep the average strength unaltered. The increase in average mIPSC amplitude in the 2 h of light reexposure group was multiplicative with a scaling factor of 1.2 (Fig. 7C). The decrease in mIPSC frequency by DR may reflect a decrease in perisomatic inhibitory synapse number as reported previously (Chattopadhyaya et al., 2004; Kreczko et al., 2009). Importantly, the Arc/Arg3.1 KOs displayed similar regulation of mIPSCs by visual experience as wild-type mice (mIPSC amplitude: NR = 47.3 ± 1.8 pA, n = 15; DR = 48.0 ± 2.6 pA, n = 15; +2hL = 54.3 ± 1.7 pA, n = 15; ANOVA, F(2,42) = 3.5, p < 0.05; mIPSC frequency: NR = 10.5 ± 0.8 Hz, DR = 8.1 ± 0.8 Hz; +2hL = 11.4 ± 0.9 Hz; ANOVA, F(2,42) = 4.3, p < 0.05) (Fig. 7D–F). These data suggest that Arc/Arg3.1 is not involved in visual experience-induced changes in mIPSCs.
Figure 7.

Visual experience-dependent regulation of mIPSCs is not dependent on Arc/Arg3.1. A, Regulation of mIPSCs by visual experience in wild types. Left, Comparison of average mIPSC amplitude between NR, 2 d DR, and 2 d DR reexposed to light for 2 h (+2hL). There was a significant increase in the average mIPSC amplitude in +2hL group compared with NR and DR. Middle, Average mIPSC traces from WT NR, DR, and +2hL groups. Right, Comparison of mIPSC frequency between NR, DR, and +2hL groups. DR significantly decreased mIPSC frequency, which reversed with reexposure to light for 2 h (+2hL). B, Cumulative probability graph of mIPSC amplitudes of WT NR (gray solid line) and DR (black dotted line) groups. Although the average mIPSC amplitude was not different, there was a small but statistically significant difference in the distribution (K–S test, p < 0.01). C, Multiplicative scaling up of mIPSC amplitudes when WT DR are reexposed to light for 2 h (+2hL). The distribution of mIPSC amplitudes of the DR group (black solid line) matched that of the +2hL group (gray solid line) when scaled multiplicatively with a factor of 1.2 (black dotted line) (K–S test, p = 0.3). D, Normal regulation of mIPSCs in Arc/Arg3.1 KOs. Left, The average mIPSC amplitude in the +2hL group is significantly larger than NR or DR. Middle, Average mIPSC traces from KO NR, DR, and +2hL groups. Right, DR decreased mIPSC frequency of KOs, which rapidly reversed by 2 h of light (+2hL). E, Cumulative probability of mIPSC amplitudes of NR (gray solid line) and DR (black dotted line) KOs (K–S test, p < 0.01). F, Similar to WTs, DR Arc/Arg3.1 KOs multiplicatively scaled up mIPSC amplitudes when reexposed to light for 2 h (+2hL). The distribution of mIPSC amplitudes of the DR group (black solid line) matched that of the +2hL group (gray solid line) when multiplied with a scaling factor of 1.1 (black dotted line) (K–S test, p = 0.4). *p < 0.05, Fisher's PLSD post hoc test after ANOVA (p < 0.05).
Discussion
The present study indicates that Arc/Arg3.1 is selectively required for sensory experience-induced homeostatic scaling down of excitatory synapses in visual cortex in vivo. Arc/Arg3.1 does not appear critical for the normal developmental decrease of excitatory synaptic strength that occurs during the second postnatal week, nor is Arc/Arg3.1 required for activity-dependent modification of inhibitory synapses. The interplay between these forms of plasticity, which is first revealed in this in vivo model, highlights the specific contribution of Arc/Arg3.1 to experience-dependent scaling of excitatory synapses.
Arc/Arg3.1 protein is rapidly upregulated in visual cortex of 2 d dark-reared mice exposed to light with a time course that parallels multiplicative scaling of excitatory synapses by visual experience. The inability to scale down excitatory synapses in Arc/Arg3.1 KOs when DR mice are brought out to light suggests that Arc/Arg3.1 is necessary for this process. Moreover, the modest increase of mEPSC amplitude in Arc/Arg3.1 KO L2/3 neurons is consistent with the notion that mEPSCs of normal-reared mice are tonically scaled in response to visual experience in a process that requires Arc/Arg3.1. It is notable that there is an asymmetry in the timing required for inducing visual experience-dependent scaling up versus scaling down of mEPSCs. We reported previously that scaling up of mEPSCs in L2/3 visual cortex requires 2 d of DR, and 1 d of DR fails to alter the amplitude of mEPSCs (Goel and Lee, 2007). Our observation that 2 h of reexposure to light is able to downscale mEPSCs suggests that the minimum duration required to scale down synapses is much shorter. The asymmetry in the duration needed to integrate neural activity for up and down scaling could simply be attributable to the fact that the detection of enhanced neural firing may be easier than the detection of a reduction in neural activity. Also, patterned vision coming through a circuit that has already up scaled its excitatory inputs is likely to have a larger impact on postsynaptic activity than under normal conditions. The increase in Arc/Arg3.1 protein expression in the +2hL group suggests that this is the case. Because the time required to scale down synapses closely coincides with the increase in Arc/Arg3.1 expression, it implies that Arc/Arg3.1 is close to the downstream event that decreases AMPAR function. A potential role for Arc/Arg3.1 is its proposed function in enhancing endocytosis of synaptic AMPARs (Chowdhury et al., 2006; Rial Verde et al., 2006; Shepherd et al., 2006). The slowing of the mEPSC kinetics in the +2hL group (Table 1) implies that the endocytotic machinery may target AMPARs with faster kinetics, which we surmise are Ca2+-permeable GluR1 homomers (Goel et al., 2006). In contrast, Arc/Arg3.1 is not likely involved in regulating synaptic Ca2+-permeable AMPARs under basal conditions, at least at L4 to L2/3 synapses, because we do not observe functional changes in the AMPAR I–V plot in normal-reared KOs compared with WTs.
The failure to scale up synapses in Arc/Arg3.1 KOs by visual deprivation is likely attributable to occlusion, because the KOs displayed slightly larger basal mEPSCs. The KOs showed normal AMPAR levels at the PSDs, suggesting that the larger basal mEPSCs may not be attributable to accumulation of AMPARs at synapses. However, it is possible that there may be a selective accumulation of AMPARs at synapses of L2/3 neurons, which could not be detected from the PSDs isolated from the whole visual cortex. The unanticipated increase in GluR1–S831 phosphorylation in KOs could also contribute to increased basal mEPSCs. Phosphorylation of S831 by CaMKII is known to increase the single-channel conductance of AMPARs but is quite selective for GluR1 homomers (Oh and Derkach, 2005). Inferring from the linear I–V plot (Fig. 2E), most of the AMPARs at visual cortical synapses are likely GluR1/GluR2 heteromers. Therefore, it is questionable as to whether the S831 phosphorylation increase could impact the mEPSC amplitude. In any case, the larger basal mEPSCs in Arc/Arg3.1 KOs seems to be attributable to a partial loss in the normal developmental reduction in mEPSCs after eye opening (Desai et al., 2002; Goel and Lee, 2007). We report that, in both WTs and KOs, the developmental decrease in mEPSC amplitude is accompanied by an increase in mEPSC frequency and a decrease in the coefficient of variance of mEPSC amplitude. The former may reflect a developmental increase in synapse number, and the latter suggests that the development of excitatory synapses in visual cortex is accompanied by a reduction in the variance of synaptic gain. Furthermore, our data suggest that Arc/Arg3.1 is not required for these processes.
Interestingly, the larger basal mEPSCs in KOs is also associated with a multiplicative increase in the amplitude of mIPSCs, which we interpret as a compensatory mechanism to prevent overexcitation. This suggests that mEPSCs and mIPSCs may be coregulated to provide stability in the neural circuit. Our data showing a multiplicative increase in mIPSC amplitude in Arc/Arg3.1 KOs without changes in mIPSC frequency suggests a global upregulation of postsynaptic GABAA receptor function. A lack of a change in mIPSC kinetics between genotypes further suggests that the subunit composition of GABAA receptors is not altered. The increase in Grip1 levels seen in the KOs may reflect the upregulation of mIPSCs. Grip1 was initially identified as a binding partner of AMPARs (Dong et al., 1997; Srivastava et al., 1998; Wyszynski et al., 1998). However, Grip1 is also found at inhibitory synapses (Li et al., 2005) and interacts with GABAA receptor associated protein (Kittler et al., 2004), which may be involved in clustering GABAA receptors (Wang et al., 1999; Chen et al., 2000).
While investigating a role of Arc/Arg3.1 in regulation of inhibitory synapses on L2/3 pyramidal neurons, we uncovered a novel rapid regulation of mIPSCs by visual experience. First, we found that mIPSC frequency is downregulated by visual deprivation. A similar decrease in mIPSC frequency was reported after DR from birth (Morales et al., 2002), which is likely attributable to a decrease in the number of perisomatic inhibitory synapses (Chattopadhyaya et al., 2004; Kreczko et al., 2009). Interestingly, the regulation of inhibition has a rather narrow critical period and was only observed when vision was deprived between P20 and P24 but not in older animals (Chattopadhyaya et al., 2004). Our results are consistent with these studies and further suggest that even a brief (2 d) DR during this critical period can produce a decrease in the number of functional inhibitory synapses. Whether these changes have anatomical correlates as seen with DR from birth (Kreczko et al., 2009) is unknown. Second, we found that the decrease in mIPSC frequency by DR can be rapidly reversed by 2 h of light. Although we reported previously that the decrease in the number of perisomatic inhibitory contacts by DR from birth can be reversed by 3 d of light exposure (Kreczko et al., 2009), whether 2 h of light can cause such anatomical rearrangement is unclear. Third, we found that mIPSC amplitude increases rapidly when DR mice are reexposed to light. This contradicts a previous study in which DR from birth increased the mIPSC amplitude (Morales et al., 2002), but it could be attributable to either difference in duration of DR or species used for the study. Furthermore, Morales et al. (2002) did not address whether mIPSC amplitude changes when DR rats are exposed to light. Our results on mIPSC regulation are clearly novel findings, which should be followed up in a future study. Importantly, we report here that the experience-dependent regulation of mIPSCs is independent of Arc/Arg3.1.
The intact regulation of mIPSCs by visual experience in Arc/Arg3.1 KOs, which lack experience-dependent regulation of mEPSCs, indicate that mIPSC regulation may occur in the absence of mEPSC changes. This seemingly contradicts the coregulation of basal mEPSCs and mIPSCs observed in the Arc/Arg3.1 KOs. One interesting possibility is that mIPSC changes may be induced by two independent mechanisms operating at different timescales: one that follows mEPSC changes over a long timescale to maintain network homeostasis of excitation and inhibition balance as seen during development, and the other more rapid change in which visual experience directly regulates mIPSCs independently of mEPSC changes. In any event, our data underscore the specificity of Arc/Arg3.1 in regulating visual experience-induced mEPSC changes.
Collectively, our results provide direct evidence that Arc/Arg3.1 is involved in multiplicative scaling down of excitatory synapses by visual experience, which may account for its proposed role in sharpening orientation tuning of visual cortical neurons (Wang et al., 2006).
Footnotes
This work was supported by National Eye Institute Grant R01-EY014882 (H.-K.L.) and National Institute of Mental Health Grant R01-MH053608 (P.W.). We thank J. Shepherd and A. Kirkwood for helpful discussions.
References
- Aoto J, Nam CI, Poon MM, Ting P, Chen L. Synaptic signaling by all-trans retinoic acid in homeostatic synaptic plasticity. Neuron. 2008;60:308–320. doi: 10.1016/j.neuron.2008.08.012. [DOI] [PMC free article] [PubMed] [Google Scholar]
- Barria A, Derkach V, Soderling T. Identification of the Ca2+/calmodulin-dependent protein kinase II regulatory phosphorylation site in the alpha-amino-3-hydroxyl-5-methyl-4-isoxazole-propionate-type glutamate receptor. J Biol Chem. 1997;272:32727–32730. doi: 10.1074/jbc.272.52.32727. [DOI] [PubMed] [Google Scholar]
- Chattopadhyaya B, Di Cristo G, Higashiyama H, Knott GW, Kuhlman SJ, Welker E, Huang ZJ. Experience and activity-dependent maturation of perisomatic GABAergic innervation in primary visual cortex during a postnatal critical period. J Neurosci. 2004;24:9598–9611. doi: 10.1523/JNEUROSCI.1851-04.2004. [DOI] [PMC free article] [PubMed] [Google Scholar]
- Chen L, Wang H, Vicini S, Olsen RW. The gamma-aminobutyric acid type A (GABAA) receptor-associated protein (GABARAP) promotes GABAA receptor clustering and modulates the channel kinetics. Proc Natl Acad Sci U S A. 2000;97:11557–11562. doi: 10.1073/pnas.190133497. [DOI] [PMC free article] [PubMed] [Google Scholar]
- Chowdhury S, Shepherd JD, Okuno H, Lyford G, Petralia RS, Plath N, Kuhl D, Huganir RL, Worley PF. Arc/Arg3.1 interacts with the endocytic machinery to regulate AMPA receptor trafficking. Neuron. 2006;52:445–459. doi: 10.1016/j.neuron.2006.08.033. [DOI] [PMC free article] [PubMed] [Google Scholar]
- Derkach V, Barria A, Soderling TR. Ca2+/calmodulin-kinase II enhances channel conductance of alpha-amino-3-hydroxy-5-methyl-4-isoxazolepropionate type glutamate receptors. Proc Natl Acad Sci U S A. 1999;96:3269–3274. doi: 10.1073/pnas.96.6.3269. [DOI] [PMC free article] [PubMed] [Google Scholar]
- Desai NS, Cudmore RH, Nelson SB, Turrigiano GG. Critical periods for experience-dependent synaptic scaling in visual cortex. Nat Neurosci. 2002;5:783–789. doi: 10.1038/nn878. [DOI] [PubMed] [Google Scholar]
- Dong H, O'Brien RJ, Fung ET, Lanahan AA, Worley PF, Huganir RL. GRIP: a synaptic PDZ domain-containing protein that interacts with AMPA receptors. Nature. 1997;386:279–284. doi: 10.1038/386279a0. [DOI] [PubMed] [Google Scholar]
- Gainey MA, Hurvitz-Wolff JR, Lambo ME, Turrigiano GG. Synaptic scaling requires the GluR2 subunit of the AMPA receptor. J Neurosci. 2009;29:6479–6489. doi: 10.1523/JNEUROSCI.3753-08.2009. [DOI] [PMC free article] [PubMed] [Google Scholar]
- Goel A, Lee HK. Persistence of experience-induced homeostatic synaptic plasticity through adulthood in superficial layers of mouse visual cortex. J Neurosci. 2007;27:6692–6700. doi: 10.1523/JNEUROSCI.5038-06.2007. [DOI] [PMC free article] [PubMed] [Google Scholar]
- Goel A, Jiang B, Xu LW, Song L, Kirkwood A, Lee HK. Cross-modal regulation of synaptic AMPA receptors in primary sensory cortices by visual experience. Nat Neurosci. 2006;9:1001–1003. doi: 10.1038/nn1725. [DOI] [PMC free article] [PubMed] [Google Scholar]
- Guzowski JF, McNaughton BL, Barnes CA, Worley PF. Imaging neural activity with temporal and cellular resolution using FISH. Curr Opin Neurobiol. 2001;11:579–584. doi: 10.1016/s0959-4388(00)00252-x. [DOI] [PubMed] [Google Scholar]
- Jiang B, Huang ZJ, Morales B, Kirkwood A. Maturation of GABAergic transmission and the timing of plasticity in visual cortex. Brain Res Brain Res Rev. 2005;50:126–133. doi: 10.1016/j.brainresrev.2005.05.007. [DOI] [PubMed] [Google Scholar]
- Ju W, Morishita W, Tsui J, Gaietta G, Deerinck TJ, Adams SR, Garner CC, Tsien RY, Ellisman MH, Malenka RC. Activity-dependent regulation of dendritic synthesis and trafficking of AMPA receptors. Nat Neurosci. 2004;7:244–253. doi: 10.1038/nn1189. [DOI] [PubMed] [Google Scholar]
- Kittler JT, Arancibia-Carcamo IL, Moss SJ. Association of GRIP1 with a GABAA receptor associated protein suggests a role for GRIP1 at inhibitory synapses. Biochem Pharmacol. 2004;68:1649–1654. doi: 10.1016/j.bcp.2004.07.028. [DOI] [PubMed] [Google Scholar]
- Kotak VC, Fujisawa S, Lee FA, Karthikeyan O, Aoki C, Sanes DH. Hearing loss raises excitability in the auditory cortex. J Neurosci. 2005;25:3908–3918. doi: 10.1523/JNEUROSCI.5169-04.2005. [DOI] [PMC free article] [PubMed] [Google Scholar]
- Kreczko A, Goel A, Song L, Lee HK. Visual deprivation decreases somatic GAD65 puncta number on layer 2/3 pyramidal neurons in mouse visual cortex. Neural Plast. 2009;2009:415135. doi: 10.1155/2009/415135. [DOI] [PMC free article] [PubMed] [Google Scholar]
- Li RW, Serwanski DR, Miralles CP, Li X, Charych E, Riquelme R, Huganir RL, de Blas AL. GRIP1 in GABAergic synapses. J Comp Neurol. 2005;488:11–27. doi: 10.1002/cne.20566. [DOI] [PubMed] [Google Scholar]
- Link W, Konietzko U, Kauselmann G, Krug M, Schwanke B, Frey U, Kuhl D. Somatodendritic expression of an immediate early gene is regulated by synaptic activity. Proc Natl Acad Sci U S A. 1995;92:5734–5738. doi: 10.1073/pnas.92.12.5734. [DOI] [PMC free article] [PubMed] [Google Scholar]
- Lyford GL, Yamagata K, Kaufmann WE, Barnes CA, Sanders LK, Copeland NG, Gilbert DJ, Jenkins NA, Lanahan AA, Worley PF. Arc, a growth factor and activity-regulated gene, encodes a novel cytoskeleton-associated protein that is enriched in neuronal dendrites. Neuron. 1995;14:433–445. doi: 10.1016/0896-6273(95)90299-6. [DOI] [PubMed] [Google Scholar]
- Maffei A, Turrigiano GG. Multiple modes of network homeostasis in visual cortical layer 2/3. J Neurosci. 2008;28:4377–4384. doi: 10.1523/JNEUROSCI.5298-07.2008. [DOI] [PMC free article] [PubMed] [Google Scholar]
- Mammen AL, Kameyama K, Roche KW, Huganir RL. Phosphorylation of the alpha-amino-3-hydroxy-5-methylisoxazole4-propionic acid receptor GluR1 subunit by calcium/calmodulin-dependent kinase II. J Biol Chem. 1997;272:32528–32533. doi: 10.1074/jbc.272.51.32528. [DOI] [PubMed] [Google Scholar]
- McCurry CL, Shepherd JD, Tropea D, Wang KH, Bear MF, Sur M. Loss of Arc renders the visual cortex impervious to the effects of sensory experience or deprivation. Nat Neurosci. 2010;13:450–457. doi: 10.1038/nn.2508. [DOI] [PMC free article] [PubMed] [Google Scholar]
- Morales B, Choi SY, Kirkwood A. Dark rearing alters the development of GABAergic transmission in visual cortex. J Neurosci. 2002;22:8084–8090. doi: 10.1523/JNEUROSCI.22-18-08084.2002. [DOI] [PMC free article] [PubMed] [Google Scholar]
- O'Brien RJ, Kamboj S, Ehlers MD, Rosen KR, Fischbach GD, Huganir RL. Activity-dependent modulation of synaptic AMPA receptor accumulation. Neuron. 1998;21:1067–1078. doi: 10.1016/s0896-6273(00)80624-8. [DOI] [PubMed] [Google Scholar]
- Oh MC, Derkach VA. Dominant role of the GluR2 subunit in regulation of AMPA receptors by CaMKII. Nat Neurosci. 2005;8:853–854. doi: 10.1038/nn1476. [DOI] [PubMed] [Google Scholar]
- Pitler TA, Alger BE. Postsynaptic spike firing reduces synaptic GABAA responses in hippocampal pyramidal cells. J Neurosci. 1992;12:4122–4132. doi: 10.1523/JNEUROSCI.12-10-04122.1992. [DOI] [PMC free article] [PubMed] [Google Scholar]
- Rial Verde EM, Lee-Osbourne J, Worley PF, Malinow R, Cline HT. Increased expression of the immediate-early gene arc/arg3.1 reduces AMPA receptor-mediated synaptic transmission. Neuron. 2006;52:461–474. doi: 10.1016/j.neuron.2006.09.031. [DOI] [PMC free article] [PubMed] [Google Scholar]
- Roche KW, O'Brien RJ, Mammen AL, Bernhardt J, Huganir RL. Characterization of multiple phosphorylation sites on the AMPA receptor GluR1 subunit. Neuron. 1996;16:1179–1188. doi: 10.1016/s0896-6273(00)80144-0. [DOI] [PubMed] [Google Scholar]
- Shepherd JD, Rumbaugh G, Wu J, Chowdhury S, Plath N, Kuhl D, Huganir RL, Worley PF. Arc/Arg3.1 mediates homeostatic synaptic scaling of AMPA receptors. Neuron. 2006;52:475–484. doi: 10.1016/j.neuron.2006.08.034. [DOI] [PMC free article] [PubMed] [Google Scholar]
- Srivastava S, Osten P, Vilim FS, Khatri L, Inman G, States B, Daly C, DeSouza S, Abagyan R, Valtschanoff JG, Weinberg RJ, Ziff EB. Novel anchorage of GluR2/3 to the postsynaptic density by the AMPA receptor-binding protein ABP. Neuron. 1998;21:581–591. doi: 10.1016/s0896-6273(00)80568-1. [DOI] [PubMed] [Google Scholar]
- Sutton MA, Ito HT, Cressy P, Kempf C, Woo JC, Schuman EM. Miniature neurotransmission stabilizes synaptic function via tonic suppression of local dendritic protein synthesis. Cell. 2006;125:785–799. doi: 10.1016/j.cell.2006.03.040. [DOI] [PubMed] [Google Scholar]
- Tagawa Y, Kanold PO, Majdan M, Shatz CJ. Multiple periods of functional ocular dominance plasticity in mouse visual cortex. Nat Neurosci. 2005;8:380–388. doi: 10.1038/nn1410. [DOI] [PubMed] [Google Scholar]
- Thiagarajan TC, Lindskog M, Tsien RW. Adaptation to synaptic inactivity in hippocampal neurons. Neuron. 2005;47:725–737. doi: 10.1016/j.neuron.2005.06.037. [DOI] [PubMed] [Google Scholar]
- Turrigiano GG, Leslie KR, Desai NS, Rutherford LC, Nelson SB. Activity-dependent scaling of quantal amplitude in neocortical neurons. Nature. 1998;391:892–896. doi: 10.1038/36103. [DOI] [PubMed] [Google Scholar]
- Wang H, Bedford FK, Brandon NJ, Moss SJ, Olsen RW. GABAA-receptor-associated protein links GABAA receptors and the cytoskeleton. Nature. 1999;397:69–72. doi: 10.1038/16264. [DOI] [PubMed] [Google Scholar]
- Wang KH, Majewska A, Schummers J, Farley B, Hu C, Sur M, Tonegawa S. In vivo two-photon imaging reveals a role of arc in enhancing orientation specificity in visual cortex. Cell. 2006;126:389–402. doi: 10.1016/j.cell.2006.06.038. [DOI] [PubMed] [Google Scholar]
- Wyszynski M, Kim E, Yang FC, Sheng M. Biochemical and immunocytochemical characterization of GRIP, a putative AMPA receptor anchoring protein, in rat brain. Neuropharmacology. 1998;37:1335–1344. doi: 10.1016/s0028-3908(98)00120-8. [DOI] [PubMed] [Google Scholar]