

Abstract
Background
Building on known associations between active commuting and reduced cardiovascular disease (CVD) risk, this study examines active transit to neighborhood amenities and differences between walking versus cycling for transportation.
Method
Year 20 data from the Coronary Artery Risk Development in Young Adults (CARDIA) study (3549 black and white adults aged 38–50 years in 2005–06) were analyzed in 2008–2009. Sociodemographic correlates of transportation mode (car-only, walk-only, any cycling, other) to neighborhood amenities were examined in multivariable multinomial logistic models. Gender-stratified, multivariable linear or multinomial regression models compared CVD risk factors across transit modes.
Results
Active transit was most common to parks and public transit stops; walking was more common than cycling. Among those who used each amenity, active transit (walk-only and any cycling versus car-only transit) was more common in men and those with no live-in partner and less than full-time employment [significant OR's (95% CI) ranging from 1.56 (1.08, 2.27) to 4.52 (1.70, 12.14)], and less common in those with children. Active transit to any neighborhood amenity was associated with more favorable BMI, waist circumference, and fitness [largest coefficient (95% CI) −1.68 (−2.81, −0.55) for BMI, −3.41 (−5.71, −1.11) for waist circumference (cm), and 36.65 (17.99, 55.31) for treadmill test duration (sec)]. Only cycling was associated with lower lifetime CVD risk classification.
Conclusion
Active transit to neighborhood amenities was related to sociodemographics and CVD risk factors. Variation in health-related benefits by active transit mode, if validated in prospective studies, may have implications for transportation planning and research.
Introduction
Active transit to work (walking or cycling) has received increased attention as a contributor to physical activity1–3 and health.4, 5 However, active transit to neighborhood amenities such as nearby stores or parks has received less attention, and little is known about cycling versus walking for transportation.
Neighborhood amenities are central to urban planning strategies that encourage alternative transportation modes by placing retail and other destinations close to homes.6–8 Further, unlike active commuting, active transit to neighborhood amenities is relevant to workers and nonworkers. While sociodemographic correlates of transportation and recreational walking9–14 and health benefits of active commuting4, 5 have been examined, less is known about active transit to neighborhood amenities. Despite sociodemographic differences between walkers and cyclists, active transit research often combines walking and cycling for transportation.5, 15–17 Understanding patterns and correlates of walking and cycling to neighborhood amenities can aid efforts to increase overall physical activity.18
In this study, cross-sectional population-based data from the Coronary Artery Risk Development in Young Adults (CARDIA) study were used to examine (1) types of neighborhood amenities accessed by walking and cycling; (2) characteristics of those who walk or cycle to neighborhood amenities; and (3) the association between active transit to neighborhood amenities and cardiovascular disease (CVD) risk factors.
Methods
Study Sample
The CARDIA Study is a population-based prospective epidemiologic study of the determinants and evolution of cardiovascular risk factors among young adults. At baseline (1985–6), 5,115 eligible subjects, aged 18–30 years, were enrolled with balance according to race, gender, education (≤high school and >high school) and age (18–24 and 25–30) from the populations of Birmingham, AL; Chicago, IL; Minneapolis, MN; and Oakland, CA. Specific recruitment procedures were described elsewhere.19 Six follow-up examinations were conducted over 20 years with retention rate of 72% of the surviving cohort at the Year 20 exam (2005–06). All data used in this report were collected at the year 20 examination.
From the initial 3549 Year 20 study subjects, pregnant women (n=6) and one transgendered respondent were excluded. Further excluding those with missing outcome or covariate data (n=825) yielded an analysis sample of 2717 individuals. Missing neighborhood amenities data (collected as part of the CARDIA Fitness ancillary study) accounted for 72% (n=598) of Year 20 respondents excluded due to missing analytic variables, who were more likely to be black, less active, exhibit less optimal CVD risk factor profiles, have no live-in partner or children and lower socioeconomic indicators.
Exposure and Outcome Measures
Neighborhood amenities
In Year 20, CARDIA respondents provided information on exercise facilities, parks, grocery stores, fast food restaurants, sit-down restaurants, and public transit stops “in their neighborhood” (i.e., neighborhoods were self-defined). For each type of amenity, respondents indicated: (1) if it was present in their neighborhood, (2) frequency of use, and (3) transportation mode(s) (car, walking, biking, public transit) used.
Transit modes
Four mutually exclusive transit mode categories for each type of amenity were created: car-only, two active transit modes (walk-only, any cycling), and other transit mode combinations. There were sufficient numbers of subjects who reported “walking-only”; in contrast, “cycling-only” was uncommon, so cycling in combination with other mode(s) (“any cycling”) was examined. Other mode combinations were heterogeneous and not of interest; car combined with walking made up >77% of this category for each amenity (except 49% for public transit stations). For subsequent analysis, transit modes were summarized into three dichotomous variables: “walk-only,” “any cycling,” and “other” modes to any neighborhood amenity.
Sociodemographic characteristics
Self- and interviewer-administered questionnaires were used to collect household income, highest degree and grade completed, smoking status, alcohol intake (ml/day), relationship status, and employment status. Number of children <18 years living in the household were determined from reported ages and live-in status of children and stepchildren.
Leisure time physical activity other than walking and cycling
At each examination, frequency of participation in 13 categories of moderate and vigorous recreational sports, exercise, leisure, and occupational activities over the previous 12 months was ascertained by an interviewer-administered questionnaire designed for CARDIA. As described elsewhere,20 Physical activity scores are calculated in exercise units (EU) based on frequency and intensity of each activity. Reliability and validity of the instrument is comparable to other activity questionnaires.20,21 Physical activity other than walking and cycling was calculated by excluding walking and cycling activities.
CVD risk factors
A symptom-limited maximal graded exercise treadmill test was administered using a modified Balke protocol;22 treadmill duration (seconds) was examined as a measure of fitness. Measurements of weight, height, and waist circumference were obtained according to standardized protocol described previously.23 Body mass index (BMI) was calculated as weight (kg)/height (m)2.
Active transit was examined in relation to lifetime CVD risk classifications based on levels of five risk factors (total cholesterol, systolic and diastolic blood pressure, smoking, and diabetes). This classification scheme was developed and validated in a sample of middle-aged adults,24 providing a measure of long-term CVD risk relevant for middle-age adults with relatively low short-term CVD risk estimated by other risk classifications.25 Definitions are described in the Table 1 footnote and include the following mutually exclusive classifications: all optimal, ≥1 not optimal, ≥1 elevated, ≥1 major risk factor. 1 and ≥2 major risk factors were combined due to low frequency of ≥2 major risk factors. Samples of fasting blood lipids and glucose were collected according to standardized CARDIA protocols and were processed at central laboratories as described previously;26–29 measures were not used for individuals fasting <8 hours. Fasting glucose >125 mg/dL or current diabetes medication was classified as diabetic; incorporation of oral glucose tolerance test results (2-hour levels >200 mg/dL) did not influence results. Blood pressure was measured by a trained technician using a standard automated blood pressure measurement monitor (Omron HEM907XL) after a 5-minute seated rest; the average of the second and third measurements, calibrated to be comparable with random-zero sphygmomanometers used in prior CARDIA exams, was used for analysis. Those reporting current use of cholesterol- or blood pressure–lowering medications were classified with “elevated” cholesterol or blood pressure values, respectively; cholesterol or blood pressure levels in the “major” category remained classified as “major”.
Table 1.
Sample characteristics at Exam Year 20 (2005–06) of the Coronary Artery Risk Development in Young Adults (CARDIA) Study, by gender [mean/% (SE)]
| Men | Women | Significancea | |
|---|---|---|---|
| Count | 1172 | 1545 | |
| Age (mean) | 45.2 (0.1) | 45.1 (0.1) | 0.405 |
| White race (%) | 60.2 (1.4) | 52.6 (1.3) | <0.001 |
| Education (%) | 0.014 | ||
| ≤ High school | 39.8 (1.4) | 35.6 (1.2) | |
| Some college | 39.9 (1.4) | 45.5 (1.3) | |
| Grad/professional | 20.3 (1.2) | 18.9 (1.0) | |
| Household income tertile (%) | <0.001 | ||
| 1 (≤$42.5k) | 27.6 (1.3) | 36.9 (1.2) | |
| 2 ($62.5–87.5k) | 35.2 (1.4) | 35.0 (1.2) | |
| 3 (≥$150) | 37.3 (1.4) | 28.2 (1.1) | |
| Alcohol (%) | <0.001 | ||
| None | 37.1 (1.4) | 51.8 (1.3) | |
| <Median (>0 to <12 mL/day) | 24.7 (1.3) | 26.0 (1.1) | |
| >Median (>12 mL/day) | 38.1 (1.4) | 22.2 (1.1) | |
| Physical activity w/out walking or cycling (%) | <0.001 | ||
| None | 2.4 (0.4) | 6.4 (0.6) | |
| <Median | 35.9 (1.4) | 55.0 (1.3) | |
| >Median | 61.7 (1.4) | 38.6 (1.2) | |
| No live-in partner (%) | 31.5 (1.4) | 38.6 (1.2) | <0.001 |
| Children (%) | 0.001 | ||
| None | 48.2 (1.5) | 45.9 (1.3) | |
| Young (<12 years) | 38.7 (1.4) | 35.7 (1.2) | |
| Older (12–17 years) | 13.1 (1.0) | 18.4 (1.0) | |
| Employment (%) | <0.001 | ||
| Not employed | 12.6 (1.0) | 21.4 (1.0) | |
| Part time | 6.3 (0.7) | 15.7 (0.9) | |
| Full time | 81.1 (1.1) | 63.0 (1.2) | |
| “Walk-only” to any amenity (%) | 44.0 (1.5) | 41.6 (1.3) | 0.197 |
| “Any cycling” to any amenity (%) | 18.6 (1.1) | 10.9 (0.8) | <0.001 |
| “Other” modes to any amenity (%) | 19.5 (1.2) | 23.4 (1.1) | 0.014 |
| “Car-only” to all amenities (%) | 45.3 (1.5) | 51.8 (1.3) | 0.001 |
| BMI (mean, kg/m2) | 28.6 (0.2) | 29.3 (0.2) | 0.0088 |
| Waist circumference (mean, cm) | 95.9 (0.4) | 87.3 (0.4) | <0.001 |
| Fitness (mean, sec) | 514.4 (4.2) | 366.2 (3.7) | <0.001 |
| Lifetime CHD risk classification (%) | <0.001 | ||
| All optimal risk factorsb | 16.1 (1.1) | 24.5 (1.1) | |
| ≥1 not optimal risk factorc | 20.2 (1.2) | 19.5 (1.0) | |
| ≥1 elevated risk factord | 33.6 (1.4) | 29.6 (1.2) | |
| ≥1 major risk factore | 30.2 (1.4) | 26.4 (1.1) |
Significance between genders, per chi-square or t-test for categoric and continuous variables, respectively. Bold font indicates significant (p<0.05).
Defined as total cholesterol<180 mg/dL, systolic blood pressure<120 mm Hg, diastolic blood pressure<80 mmg Hg, nonsmoker, and nondiabetic.
Defined as total cholesterol 180–199 mg/dL, systolic blood pressure 120–139 mm Hg, diastolic blood pressure 80–89 mmg Hg, nonsmoker, and nondiabetic.
Defined as total cholesterol 200–239 mg/dL, systolic blood pressure 140–159 mm Hg, diastolic blood pressure 90–99 mmg Hg, nonsmoker, and nondiabetic. Measures <major classification were classified as elevated if related medication reported in Year 20.
Defined as total cholesterol>240 mg/dL, systolic blood pressure ≥160 mm Hg, diastolic blood pressure ≥100 mm Hg, smoker, or diabetic.
Statistical Analysis
Statistical analyses were conducted in 2008–2009 using Stata, version 10.1. First, prevalences for “walk-only” and “any cycling” to each type of neighborhood amenity were calculated among subjects who used the given amenity, and sample characteristics were compared descriptively by gender using chi-square and t-tests.
Second, transit mode to each amenity type was examined as a function of a priori sociodemographic characteristics (physical activity other than walking and cycling, gender, race, relationship status, having children <12 or 13–17 years, education, >median household income, employment status) among subjects who used each given neighborhood amenity. Odds ratios from multivariable multinomial logistic models for correlates of mutually exclusive transit modes (walking-only or any cycling versus car-only [referent]) are presented; “other” modes of transit were included in analysis but not presented. For simplicity, sociodemographic characteristics were reduced into groups with relatively homogeneous associations with transit mode (e.g., results were similar with finer categorization of income). Analyses were adjusted for age and study center (to control for sampling frame) and, in secondary analysis, for self-reported presence of sidewalks and of walking and/or bicycle paths, and crime and lack of safety as barriers to outdoor exercise.
Third, using multivariable regression models, BMI, waist circumference, and treadmill duration (linear regression) and CVD lifetime risk category (multinomial logistic regression; all optimal (referent), ≥1 not optimal, ≥1 elevated, ≥1 major risk factor) were modeled as a function of transit mode to any neighborhood amenity (dichotomous walk-only, any cycling, and other combinations (not shown); car-only was excluded and therefore the comparison group), controlling for age, race, education, household income, alcohol consumption, study center, and physical activity other than walking and cycling; smoking was included only in examination of anthropometric and fitness measures because lifetime CVD risk classification incorporated smoking.
Results
Descriptive Characteristics
Men and women differed on all sociodemographic characteristics except age (Table 1). Any cycling, but not walking-only, for transit was more common in men than women. Women had higher BMI, smaller waist circumference, lower fitness, and generally lower CHD lifetime risk. Walking-only was more common than any cycling (Table 1) and amenities most commonly accessed using active transit modes (walking-only or any cycling) were parks and public transit stops (Figure 1).
Figure 1.

Prevalence of different modes of active transit (walk-only or any cycling)a to several types of neighborhood amenities in CARDIA exam year 20 (2005-06) analysis sample, by type of amenity
a Crude percentages; error bars represent ±1 SE. Limited to individuals who reported the presence of and using each neighborhood amenity
Sociodemographic Correlates of Active Transit
Prevalence of walking-only relative to car-only transit was generally higher in men, whites, and subjects without a live-in partner and without full-time employment (Table 2). Above-median household income was generally negatively associated with walking-only, but positively associated with walking to parks. White race was associated with walking to all amenities except grocery stores and fast food restaurants. Associations with cycling for transit may be unstable due to sparse data, but in general, sociodemographic correlates of any cycling relative to car-only transit prevalence paralleled those for walking-only versus car-only transit. Exceptions include stronger and more consistent associations between any cycling and physical activity other than walking and cycling, male gender, and white race. Additionally, those with young children in the household were generally less likely to walk-only (relative to car-only), but not incorporate cycling, for transit. Results were similar after controlling for self-reported sidewalks, paths, and crime and lack of safety.
Table 2.
Odds ratios for sociodemographic predictors of active transit (walking-only or any cycling versus car only) to neighborhood amenitiesa [OR (95% CI)b] among those who used each type of neighborhood amenity
| Recreational facility | Park | |||
| Walk only | Any cycling | Walk only | Any cycling | |
| High physical activity (low)c | 1.12 (0.73, 1.73) | 1.52 (0.82, 2.82)d | 1.07 (0.82, 1.40) | 1.75 (1.24, 2.47)* |
| Male (female) | 1.59 (1.04, 2.45)* | 4.20 (2.29, 7.71)* | 1.29 (0.98, 1.70) | 1.91 (1.35, 2.71)* |
| White (black) | 1.41 (0.88, 2.24) | 1.49 (0.80, 2.79) | 1.80 (1.35, 2.39)* | 2.36 (1.62, 3.43)* |
| No live in partner (live-in) | 1.84 (1.09, 3.13)* | 0.59 (0.27, 1.29)d | 1.60 (1.15, 2.23)* | 1.27 (0.81, 1.98) |
| Young children (no children) | 0.50 (0.30, 0.85)* | 0.74 (0.37, 1.46) | 0.63 (0.45, 0.87)* | 1.38 (0.92, 2.08) |
| Older children (no children) | 0.83 (0.46, 1.50) | 0.78 (0.33, 1.84)d | 0.81 (0.54, 1.20) | 0.86 (0.50, 1.47)d |
| >High school/equivalent (≤high school/equivalent) | 1.04 (0.65, 1.67) | 1.42 (0.73, 2.75)d | 1.26 (0.94, 1.69) | 1.81 (1.22, 2.68)* |
| >Median ($87.5k) household income (≤median) | 0.78 (0.46, 1.32) | 0.53 (0.27, 1.04) | 1.71 (1.24, 2.36)* | 1.64 (1.10, 2.45)* |
| <Full-time employment (full time) | 2.04 (1.30, 3.20)* | 2.17 (1.15, 4.06)* | 1.66 (1.23, 2.24)* | 1.30 (0.88, 1.93) |
| Grocery Store | Fast food restaurant | |||
| Walk only | Any cycling | Walk only | Any cycling | |
| High physical activity (low)c | 0.99 (0.72, 1.36) | 1.35 (0.87, 2.11) | 1.39 (0.94, 2.05) | 2.42 (1.24, 4.70)* |
| Male (female) | 1.63 (1.19, 2.24)* | 1.76 (1.13, 2.76)* | 2.33 (1.58, 3.43)* | 2.38 (1.24, 4.58)*d |
| White (Black) | 0.88 (0.63, 1.23) | 1.88 (1.14, 3.10)* | 0.71 (0.48, 1.07) | 1.48 (0.78, 2.81) |
| No live in partner (live-in) | 1.91 (1.33, 2.74)* | 1.20 (0.69, 2.06) | 2.43 (1.55, 3.79)* | 3.24 (1.52, 6.90)* |
| Young children (no children) | 0.54 (0.37, 0.80)* | 1.09 (0.65, 1.81) | 0.63 (0.39, 1.02) | 2.31 (1.09, 4.90)*d |
| Older children (no children) | 0.64 (0.40, 1.02) | 0.79 (0.39, 1.61) | 0.62 (0.34, 1.14) | —e |
| >High school/equivalent (≤high school/equivalent) | 1.02 (0.73, 1.41) | 1.36 (0.82, 2.23) | 1.14 (0.78, 1.68) | 1.10 (0.57, 2.10) |
| >Median ($87.5k) household income (≤median) | 0.81 (0.55, 1.19) | 0.81 (0.49, 1.35) | 0.48 (0.29, 0.79)* | 0.71 (0.34, 1.50)d |
| <Full-time employment (full time) | 2.17 (1.57, 3.00)* | 1.57 (0.97, 2.55) | 3.27 (2.23, 4.80)* | 2.41 (1.25, 4.63)*d |
| Sit down restaurant | Public transit | |||
| Walk only | Any cycling | Walk only | Any cycling | |
| High physical activity (low)c | 0.92 (0.67, 1.25) | 1.70 (0.90, 3.21)d | 1.31 (0.83, 2.06) | 0.96 (0.39, 2.36)d |
| Male (female) | 1.40 (1.02, 1.91)* | 1.41 (0.75, 2.63) | 0.86 (0.54, 1.36) | —e |
| White (black) | 2.03 (1.43, 2.89)* | 1.94 (0.95, 3.94)d | 2.25 (1.33, 3.81)* | 4.01 (1.43, 11.26)*d |
| No live in partner (live-in) | 1.56 (1.08, 2.27)* | 2.21 (1.03, 4.76)*d | 1.23 (0.72, 2.12) | 0.79 (0.27, 2.30)d |
| Young children (no children) | 0.55 (0.38, 0.80)* | 1.80 (0.86, 3.77)d | 0.46 (0.27, 0.81)* | —e |
| Older children (no children) | 0.56 (0.34, 0.91)* | —e | 0.73 (0.38, 1.41) | —e |
| >High school/equivalent (≤high school/equivalent) | 1.39 (0.97, 1.97) | 1.73 (0.82, 3.64)d | 0.94 (0.56, 1.57) | 0.91 (0.32, 2.61)d |
| >Median ($87.5k) household income (≤median) | 0.85 (0.59, 1.22) | 0.78 (0.38, 1.61) | 0.73 (0.43, 1.25) | 0.54 (0.18, 1.60)d |
| <Full-time employment (full time) | 1.57 (1.12, 2.20)* | 1.53 (0.79, 2.96)d | 2.74 (1.59, 4.73)* | 4.54 (1.70, 12.14)*d |
Bold font indicates significant (p<0.05)
Exam Year 20 (2005–06) of the Coronary Artery Risk Development in Young Adults (CARDIA) Study. Analyses were limited to those who reported using each type of amenity in their neighborhood.
Estimated from multinomial logistic regression modeling transit mode to each amenity [car-only, walk-only, any biking, other mode combinations (not shown) versus car-only] as a function of the reported sociodemographic characteristics (referent group noted in parentheses), further controlling for age and study center. Estimates for other mode combinations were not reported because this was not an outcome of interest. Odds ratios tabulated are relative to prevalence of car only transit to the given amenity.
High physical activity represents above median physical activity index excluding walking and cycling.
Estimates may be unstable due to sparse data; based on cell sizes between 10 and 20.
Results suppressed due to sparse data; based on cell sizes <10.
Association Between Active Transit and CVD Risk Factors
Overall, both active transit modes were negatively associated with BMI and waist circumference and positively associated with fitness (Table 3). Associations were stronger and more consistently significant for any cycling than walking-only, and associations with any cycling were generally stronger in women than men. Any cycling, but not walking-only, for transit was generally related to lower lifetime CVD risk classification, particularly for elevated and major risk classifications (Figure 2). Associations were similar for each component of lifetime CVD risk (results not shown).
Table 3.
Association between walking and cycling to any amenity and anthropometrics and fitnessa (coeff (95% CI))b
| Men | Women | ||
|---|---|---|---|
| BMI (kg/m2) | Walk-only | −0.46 (−1.08, 0.17) | −0.62 (−1.33, 0.10) |
| Any cycling | −0.34 (−1.12, 0.44) | −1.68 (−2.81, −0.55)* | |
| Waist circumference (cm) | Walk-only | −1.63 (−3.18, −0.09)* | −0.33 (−1.78, 1.11) |
| Any cycling | −2.27 (−4.22, −0.32)* | −3.41 (−5.71, −1.11)* | |
| Fitness (treadmill test duration, in seconds) | Walk-only | 14.31 (−0.48, 29.10) | 17.07 (5.37, 28.77)* |
| Any cycling | 27.01 (8.39, 45.63)* | 36.65 (17.99, 55.31)* | |
All variables drawn from exam Year 20 (2005–06) of the Coronary Artery Risk Development in Young Adults (CARDIA) Study.
Estimated from linear regression modeling anthropometrics or fitness as a function of “walking only” to any destination and “any cycling” to any destination, controlling for age, race, education, household income, alcohol intake, physical activity other than walking, and study center. Dichotomous “other” mode combinations were included in the model but not presented, and “car-only” to any destination was excluded and therefore the comparison group)
Bold font indicates significant (p<0.05)
Figure 2.
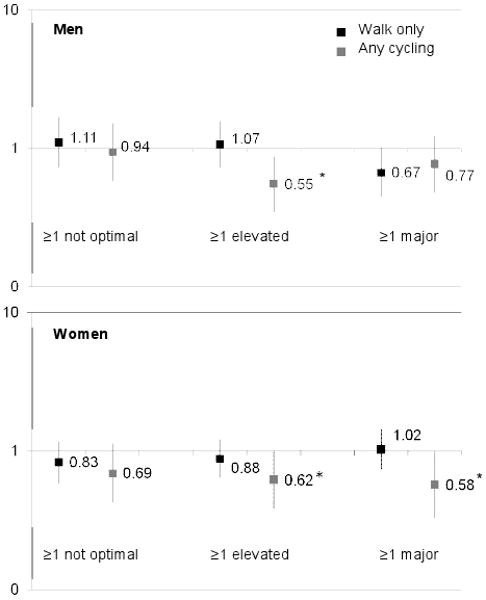
Odds ratios for walking-only and any cycling to any amenity and risk strata for lifetime CVD risk classificationa
aExam Year 20 (2005-06) of the Coronary Artery Risk Development in Young Adults (CARDIA) Study. Estimated from multinomial regression, adjusted for age, race, education, income, alcohol intake, physical activity other than walking and bicyling, “other” transit modes to any neighborhood amenity, and study center. Dependant variable categories were lifetime CVD risk classifications (“all optimal risk factors”, “≥1 not optimal risk factor”, “≥1 elevated risk factor”, and “≥1 major risk factor”) defined in footnote under Table 1. Odds ratios tabulated are relative to “all optimal risk factors”. Error bars represent 95% confidence intervals.
*significant (p<0.05)
Discussion
In this study, walking-only and any cycling for transit were associated with lower BMI, smaller waist circumference, and higher fitness, while only any cycling was associated with lower lifetime CVD risk classification. Parks and public transit stops were the most common amenities accessed using active transit, and walking-only was more common than any cycling. Transit modes varied by type of resource and individual characteristics, particularly gender and relationship, child, and employment status. These findings have implications for promotion of physical activity through community design and active transit research.
Characteristics and Destinations of Active Transit Users
Active transit was common in the CARDIA sample, with 42%–44% reporting walking-only and 11%–19% reporting any biking to neighborhood amenities. Active transit prevalence was higher than other studies (21%–28% walking10,11,30 and 6%–10% cycling30 for transit) which use more restrictive definitions incorporating trip duration or frequency not ascertained in the CARDIA study. Limiting examination of sociodemographic correlates of active transit to those who used each type of amenity helped to isolate associations related to mode choice by minimizing confounding due to differential availability and use of each amenity.
The finding of higher active transit prevalence in men and whites is consistent with higher total physical activity levels in these groups.31–34 Gender differences may stem from greater safety concerns in women,34 but relationships were similar after controlling for self-reported crime and lack of safety. Racial differences may reflect disparities in physical or social environments,35,36 suggesting that such disparities may need to be addressed for active transit to become a viable option. However, gender and race differences in walking and cycling appear even after controlling for built environment characteristics in prior research.37
Active transit was more common in those without a live-in partner or children, suggesting the importance of time constraints and lifestyle in mode choice decisions. Similarly, active transit was more common in individuals with less than full-time employment, who may have more time and less access to a car. Car transit may be more appealing for those with greater time constraints, or errands may be conducted en route between work and home. Financial resources and car ownership may influence transit mode choices, but associations with employment emerged even after controlling for education and income. Interestingly, active transit to most neighborhood amenities was positively related to education but negatively related to income, although most of these associations were not significant. While counterintuitive, similar patterns have been observed elsewhere,9,11 perhaps reflecting complex roles of factors such as resources (e.g., access to a car) and social norms (e.g., environmentalism).
Differences in Sociodemographic Correlates of Active Transit by Type of Neighborhood Amenity
Active transit correlates were consistent across neighborhood amenities, with a few exceptions. Walking-only for transit was generally more common in whites except to grocery stores and fast food restaurants. Given that these two amenities were least likely to be accessed using active transit, these results may be driven by necessity (e.g., lack of access to a car) rather than mode choice preference. Likewise, active transit was less common in those with above-median income except for transit to parks, suggesting that walking only or any cycling to parks may reflect leisure rather than utilitarian activity.
The majority (72%) of public transit users walked to a public transit stop, perhaps reflecting environmental factors such as limited parking that influence public transit use, or dedication to alternative transportation modes. Such factors may more strongly influence transit mode decisions than sociodemographic characteristics, several of which were correlated with active transit to amenities other than public transit stops. Public transit promotion may be valuable because active transit to public transit stations is common regardless of many individual characteristics, and public transit has been shown to be related to increased physical activity.3
Active Transit Associations with CVD Risk Factors
Associations between walking-only and any cycling for transit with favorable BMI, waist circumference, fitness levels, and lifetime CVD risk classification are consistent with a growing literature showing that active commuting and walking are associated with lower CVD risk4,38 and more favorable CVD risk profiles.5 These associations could reflect health benefits of active transit, selection of active transit by healthier people, or both, but longitudinal studies are needed to distinguish among these mechanisms.
Both Active, but not Equivalent: Walking-Only and any Cycling
In several cases, male gender, white race, and higher education were more strongly associated with any cycling than walking-only for transit. That is, incorporation of any cycling into trips to neighborhood amenities may be more strongly influenced to social norms and influences related to these characteristics. Indeed, almost half of the current sample reported walking-only for transit, which is consistent with evidence of walking as accessible to the general population, as opposed to the small proportion reporting cycling. Walking requires minimal equipment, skill, and transportation infrastructure (e.g., bike lanes) in the community. Thus, relative to walking, promotion of cycling may require distinct or enhanced interventions to the physical and social environments.
Any cycling is also more strongly related to CVD risk factors than walking-only for transit. Compared to walking-only, transit incorporating cycling may be more beneficial to health, perhaps because cycling can be performed at more vigorous intensities, more strongly influenced by health status, or more strongly confounded by unmeasured attributes of cyclists. This finding is consistent with stronger relationships between any cycling (as opposed to walking-only) and high physical activity other than walking and cycling, which further suggest that relationships between health and active transit measures that include cycling may be more vulnerable to confounding by other physical activity or fitness levels. These findings suggest potential limitations of combined walking/cycling measures because they represent heterogeneity in physical activity intensity and potential health benefits that may vary cross-culturally39 and across demographic subgroups.
Strengths and Limitations
The CARDIA data are observational and cross-sectional and study results do not imply causality. The analysis was limited by self-reported physical activity and other lifestyle factors, and cannot completely control for misreporting, which may include over-reporting of active transit and walking; resulting bias may be exacerbated by exclusion of generally less healthy individuals due to missing data, who may less likely to over-report healthy behaviors. Additionally, examination of self-reported amenities in self-defined neighborhoods has limitations,40 but many concerns were avoided by examining transit modes among those reporting use of each amenity. Measures of walking and cycling for transportation do not reflect frequency or duration of activity. Due to the relatively small number of cyclists in the sample, this study examined “any cycling,” a heterogeneous measure which may include walking and therefore does not provide a clear comparison with walking-only. Further, car ownership may be an important determinant of active transportation not examined in this study.9,12 More can be learned from reports of barriers and facilitators to active transit, but these variables were not collected in the CARDIA study.
Finally, classification of respondents reporting blood pressure– or cholesterol-lowering medications into the “elevated” risk category was based on clinical guidelines for initiation for medical treatment but likely resulted in some misclassification.
Conversely, study strengths include use of detailed data on active transit, measures of a variety of types of physical activity from an instrument with known reliability and validity, and extensive CVD risk biomarker data. Further, this study controlled for leisure physical activity, which is uncommon in most studies relating walking to CVD risk factors.41
Conclusions
These findings extend research on active commuting (active transit to work) to address walking and cycling for travel to neighborhood amenities. Study results provide evidence of independent influences of sociodemographic factors on active transit and associations between active transit and BMI, waist circumference, fitness, and lifetime CVD risk classification. Sociodemographic correlates of walking-only and any cycling and relationships with health measures suggest that cycling should be considered separately from walking as a sole means of transportation. However, more detailed measures and longitudinal data are needed to clarify these relationships. In particular, longitudinal analysis and more precise quantification of active transit can improve understanding of the effect of walking or cycling for transportation on health outcomes. Understanding active transit to neighborhood amenities can inform strategies to promote physical activity.
Acknowledgments
The CARDIA study is supported by the National Heart, Lung, and Blood Institute (N01-HC-95095, N01-HC-48047-48050, and N01-HC-05187). Analysis is supported by NCI (R01 CA12115, R01 CA109831) and NICHD (K01 HD044263). Additional funding comes from NIH (R01 AA12162), the UNC-CH Center for Environmental Health and Susceptibility (CEHS, the UNC-CH Clinic Nutrition Research Center (NIH DK56350), and the Carolina Population Center; and from contracts with the University of Alabama at Birmingham, Coordinating Center, N01-HC-95095; University of Alabama at Birmingham, Field Center, N01-HC-48047; University of Minnesota, Field Center, N01-HC-48048; Northwestern University, Field Center, N01-HC-48049; Kaiser Foundation Research Institute, N01-HC-48050 and R01-HL078972 from the National Heart, Lung and Blood Institute. The authors would like to thank Drs. Gina Wei and Ellen Funkhouser for their comments on the manuscript, Ms. Niobra Peterson for her help with the literature review and variable coding, and Ms. Frances Dancy for her helpful administrative assistance.
Footnotes
There were no potential or real conflicts of financial or personal interest with the financial sponsors of the scientific project.
No financial disclosures were reported by the authors of this paper.
Publisher's Disclaimer: This is a PDF file of an unedited manuscript that has been accepted for publication. As a service to our customers we are providing this early version of the manuscript. The manuscript will undergo copyediting, typesetting, and review of the resulting proof before it is published in its final citable form. Please note that during the production process errors may be discovered which could affect the content, and all legal disclaimers that apply to the journal pertain.
References
- 1.Berrigan D, Troiano RP, McNeel T, Disogra C, Ballard-Barbash R. Active transportation increases adherence to activity recommendations. Am J Prev Med. 2006;31:210–6. doi: 10.1016/j.amepre.2006.04.007. [DOI] [PubMed] [Google Scholar]
- 2.Shephard RJ. Is active commuting the answer to population health? Sports Med. 2008;38:751–8. doi: 10.2165/00007256-200838090-00004. [DOI] [PubMed] [Google Scholar]
- 3.Besser LM, Dannenberg AL. Walking to public transit: steps to help meet physical activity recommendations. Am J Prev Med. 2005;29:273–80. doi: 10.1016/j.amepre.2005.06.010. [DOI] [PubMed] [Google Scholar]
- 4.Hamer M, Chida Y. Active commuting and cardiovascular risk: a meta-analytic review. Prev Med. 2008;46:9–13. doi: 10.1016/j.ypmed.2007.03.006. [DOI] [PubMed] [Google Scholar]
- 5.von Huth Smith L, Borch-Johnsen K, Jorgensen T. Commuting physical activity is favourably associated with biological risk factors for cardiovascular disease. Eur J Epidemiol. 2007;22:771–9. doi: 10.1007/s10654-007-9177-3. [DOI] [PubMed] [Google Scholar]
- 6.Rodriguez DA, Khattak AJ, Evenson KR. Can New Urbanism encourage physical activity? J Am Plan Assn. 2006;72:43–54. [Google Scholar]
- 7.McCormack GR, Giles-Corti B, Bulsara M. The relationship between destination proximity, destination mix and physical activity behaviors. Prev Med. 2008;46:33–40. doi: 10.1016/j.ypmed.2007.01.013. [DOI] [PubMed] [Google Scholar]
- 8.Frank LD. Economic determinants of urban form: resulting trade-offs between active and sedentary forms of travel. Am J Prev Med. 2004;27:146–53. doi: 10.1016/j.amepre.2004.06.018. [DOI] [PubMed] [Google Scholar]
- 9.Agrawal AW, Schimek P. Extent and correlates of walking in the USA. Transportation Research Part D-Transport and Environment. 2007;12:548–563. [Google Scholar]
- 10.Ham SA, Macera CA, Lindley C. Trends in walking for transportation in the United States, 1995 and 2001. Prev Chronic Dis. 2005;2:A14. [PMC free article] [PubMed] [Google Scholar]
- 11.Kruger J, Ham SA, Berrigan D, Ballard-Barbash R. Prevalence of transportation and leisure walking among U.S. adults. Prev Med. 2008 doi: 10.1016/j.ypmed.2008.02.018. [DOI] [PubMed] [Google Scholar]
- 12.Lee C, Moudon AV. Correlates of walking for transportation or recreational purposes. J Phys Act Health. 2006;3:S77–98. doi: 10.1123/jpah.3.s1.s77. [DOI] [PubMed] [Google Scholar]
- 13.Rafferty AP, McGee HB, Petersmarck KA, Miller CE. Proportion of trips made by walking: estimating a state-level baseline for Healthy People 2010 Objective 22–14. Am J Health Promot. 2004;18:387–91. doi: 10.4278/0890-1171-18.5.387. [DOI] [PubMed] [Google Scholar]
- 14.Martin SL, Lee SM, Lowry R. National prevalence and correlates of walking and bicycling to school. Am J Prev Med. 2007;33:98–105. doi: 10.1016/j.amepre.2007.04.024. [DOI] [PubMed] [Google Scholar]
- 15.Wagner A, Simon C, Evans A, et al. Physical activity and coronary event incidence in Northern Ireland and France: the Prospective Epidemiological Study of Myocardial Infarction (PRIME) Circulation. 2002;105:2247–52. doi: 10.1161/01.cir.0000016345.58696.4f. [DOI] [PubMed] [Google Scholar]
- 16.Hu G, Sarti C, Jousilahti P, Silventoinen K, Barengo NC, Tuomilehto J. Leisure time, occupational, and commuting physical activity and the risk of stroke. Stroke. 2005;36:1994–9. doi: 10.1161/01.STR.0000177868.89946.0c. [DOI] [PubMed] [Google Scholar]
- 17.Timperio A, Ball K, Salmon J, et al. Personal, family, social, and environmental correlates of active commuting to school. Am J Prev Med. 2006;30:45–51. doi: 10.1016/j.amepre.2005.08.047. [DOI] [PubMed] [Google Scholar]
- 18.Ogilvie D, Egan M, Hamilton V, Petticrew M. Promoting walking and cycling as an alternative to using cars: systematic review. Br Med J. 2004;329:763. doi: 10.1136/bmj.38216.714560.55. [DOI] [PMC free article] [PubMed] [Google Scholar]
- 19.Hughes GH, Cutter G, Donahue R, et al. Recruitment in the Coronary Artery Disease Risk Development in Young Adults (CARDIA) Study. Control Clin Trials. 1987;8:S68–73. doi: 10.1016/0197-2456(87)90008-0. [DOI] [PubMed] [Google Scholar]
- 20.Jacobs DR, Hahn LP, Haskell WL, Pirie P, Sidney S. Validity and reliability of short physical activity history: CARDIA and the Minnesota Heart Health Program. J Cardiopulmonary Rehabil. 1989;9:448–58. doi: 10.1097/00008483-198911000-00003. [DOI] [PMC free article] [PubMed] [Google Scholar]
- 21.Jacobs D, Jr, Ainsworth B, Hartman T, Leon A. A simultaneous evaluation of 10 commonly used physical activity questionnaires. Med Sci Sports Exerc. 1993;25:81–91. doi: 10.1249/00005768-199301000-00012. [DOI] [PubMed] [Google Scholar]
- 22.Sidney S, Haskell W, Crow R, et al. Symptom-limited graded treadmill exercise testing in young adults in the CARDIA study. Med Sci Sports Exerc. 1992;24:177–83. [PubMed] [Google Scholar]
- 23.Cutter GR, Burke GL, Dyer AR, et al. Cardiovascular risk factors in young adults. The CARDIA baseline monograph. Control Clin Trials. 1991;12:S1–77. doi: 10.1016/0197-2456(91)90002-4. [DOI] [PubMed] [Google Scholar]
- 24.Lloyd-Jones DM, Leip EP, Larson MG, D'Agostino RB, Beiser A, Wilson PW, et al. Prediction of lifetime risk for cardiovascular disease by risk factor burden at 50 years of age. Circulation. 2006;113:791–8. doi: 10.1161/CIRCULATIONAHA.105.548206. [DOI] [PubMed] [Google Scholar]
- 25.Wilson PW, D'Agostino RB, Levy D, Belanger AM, Silbershatz H, Kannel WB. Prediction of coronary heart disease using risk factor categories. Circulation. 1998;97:1837–47. doi: 10.1161/01.cir.97.18.1837. [DOI] [PubMed] [Google Scholar]
- 26.Carnethon MR, Loria CM, Hill JO, Sidney S, Savage PJ, Liu K. Risk factors for the metabolic syndrome: the coronary artery risk development in young adults (CARDIA) study, 1985–2001. Diabetes Care. 2004;27:2707–15. doi: 10.2337/diacare.27.11.2707. [DOI] [PubMed] [Google Scholar]
- 27.Friedman GD, Cutter GR, Donahue RP, et al. CARDIA: study design, recruitment, and some characteristics of the examined subjects. J Clin Epidemiol. 1988;41:1105–16. doi: 10.1016/0895-4356(88)90080-7. [DOI] [PubMed] [Google Scholar]
- 28.Folsom AR, Jacobs DR, Jr, Wagenknecht LE, et al. Increase in fasting insulin and glucose over seven years with increasing weight and inactivity of young adults: the CARDIA Study. Am J Epidemiol. 1996;144:235–46. doi: 10.1093/oxfordjournals.aje.a008918. [DOI] [PubMed] [Google Scholar]
- 29.Warnick GR, Mayfield C, Benderson J, Chen JS, Albers JJ. HDL cholesterol quantitation by phosphotungstate-Mg2+ and by dextran sulfate-Mn2+-polyethylene glycol precipitation, both with enzymic cholesterol assay compared with the lipid research method. Am J Clin Pathol. 1982;78:718–23. doi: 10.1093/ajcp/78.5.718. [DOI] [PubMed] [Google Scholar]
- 30.Butler GP, Orpana HM, Wiens AJ. By your own two feet: factors associated with active transportation in Canada. Can J Public Health. 2007;98:259–64. doi: 10.1007/BF03405399. [DOI] [PMC free article] [PubMed] [Google Scholar]
- 31.Caspersen CJ, Pereira MA, Curran KM. Changes in physical activity patterns in the United States, by sex and cross-sectional age. Med Sci Sports Exerc. 2000;32:1601–9. doi: 10.1097/00005768-200009000-00013. [DOI] [PubMed] [Google Scholar]
- 32.Winkleby MA, Kraemer HC, Ahn DK, Varady AN. Ethnic and socioeconomic differences in cardiovascular disease risk factors: findings for women from the Third National Health and Nutrition Examination Survey, 1988–1994. JAMA. 1998;280:356–62. doi: 10.1001/jama.280.4.356. [DOI] [PubMed] [Google Scholar]
- 33.Crespo CJ, Smit E, Andersen RE, Carter-Pokras O, Ainsworth BE. Race/ethnicity, social class and their relation to physical inactivity during leisure time: results from the Third National Health and Nutrition Examination Survey, 1988–1994. Am J Prev Med. 2000;18:46–53. doi: 10.1016/s0749-3797(99)00105-1. [DOI] [PubMed] [Google Scholar]
- 34.Roman CG, Chalfin A. Fear of walking outdoors. A multilevel ecologic analysis of crime and disorder. Am J Prev Med. 2008;34:306–12. doi: 10.1016/j.amepre.2008.01.017. [DOI] [PubMed] [Google Scholar]
- 35.Gordon-Larsen P, Nelson MC, Page P, Popkin BM. Inequality in the built environment underlies key health disparities in physical activity and obesity. Pediatrics. 2006;117:417–24. doi: 10.1542/peds.2005-0058. [DOI] [PubMed] [Google Scholar]
- 36.Cerin E, Leslie E. How socio-economic status contributes to participation in leisure-time physical activity. Soc Sci Med. 2008;66:2596–609. doi: 10.1016/j.socscimed.2008.02.012. [DOI] [PubMed] [Google Scholar]
- 37.Cervero R, Duncan M. Walking, bicycling, and urban landscapes: evidence from the San Francisco Bay Area. Am J Public Health. 2003;93:1478–83. doi: 10.2105/ajph.93.9.1478. [DOI] [PMC free article] [PubMed] [Google Scholar]
- 38.Hu G, Jousilahti P, Borodulin K, et al. Occupational, commuting and leisure-time physical activity in relation to coronary heart disease among middle-aged Finnish men and women. Atherosclerosis. 2007;194:490–7. doi: 10.1016/j.atherosclerosis.2006.08.051. [DOI] [PubMed] [Google Scholar]
- 39.Bassett DR, Jr, Pucher J, Buehler R, Thompson DL, Crouter SE. Walking, cycling, and obesity rates in Europe, North America, and Australia. J Phys Act Health. 2008;5:795–814. doi: 10.1123/jpah.5.6.795. [DOI] [PubMed] [Google Scholar]
- 40.Owen N, Humpel N, Leslie E, Bauman A, Sallis JF. Understanding environmental influences on walking; Review and research agenda. Am J Prev Med. 2004;27:67–76. doi: 10.1016/j.amepre.2004.03.006. [DOI] [PubMed] [Google Scholar]
- 41.Hamer M, Chida Y. Walking and primary prevention: a meta-analysis of prospective cohort studies. Br J Sports Med. 2008;42(4):238–43. doi: 10.1136/bjsm.2007.039974. [DOI] [PubMed] [Google Scholar]