

Abstract
Motivation: Identification of post-translationally modified proteins has become one of the central issues of current proteomics. Spectral library search is a new and promising computational approach to mass spectrometry-based protein identification. However, its potential in identification of unanticipated post-translational modifications has rarely been explored. The existing spectral library search tools are designed to match the query spectrum to the reference library spectra with the same peptide mass. Thus, spectra of peptides with unanticipated modifications cannot be identified.
Results: In this article, we present an open spectral library search tool, named pMatch. It extends the existing library search algorithms in at least three aspects to support the identification of unanticipated modifications. First, the spectra in library are optimized with the full peptide sequence information to better tolerate the peptide fragmentation pattern variations caused by some modification(s). Second, a new scoring system is devised, which uses charge-dependent mass shifts for peak matching and combines a probability-based model with the general spectral dot-product for scoring. Third, a target-decoy strategy is used for false discovery rate control. To demonstrate the effectiveness of pMatch, a library search experiment was conducted on a public dataset with over 40 000 spectra in comparison with SpectraST, the most popular library search engine. Additional validations were done on four published datasets including over 150 000 spectra. The results showed that pMatch can effectively identify unanticipated modifications and significantly increase spectral identification rate.
Availability: http://pfind.ict.ac.cn/pmatch/
Contact: yfu@ict.ac.cn; rxsun@ict.ac.cn
Supplementary information: Supplementary data are available at Bioinformatics online.
1 INTRODUCTION
Liquid chromatography coupled with tandem mass spectrometry (LC-MS/MS) is the key experimental method for large-scale protein identification. In this method, proteins are digested into peptides, which are then ionized and dissociated in a mass spectrometer. The mass-to-charge ratios (m/z) and the intensities of the resulting product ions are measured to produce MS/MS spectra. To identify the peptides and proteins, sequence database search has achieved great success in the past years, and a variety of search tools have been developed, e.g. SEQUEST (Eng et al., 1994), Mascot (Perkins et al., 1999) and pFind (Fu et al., 2004). Such an approach is implemented by comparing the similarities between the experimental spectra and the theoretical spectra predicted from peptide sequences in a database. Unfortunately, due to insufficient understanding of the factors that determine peptide fragmentation, most current search tools employ simplified fragmentation models, such as the uniform backbone dissociation model, leading to many unidentified or misidentified spectra. In recent years, with the availability of millions of confidently identified MS/MS spectra, an alternative as well as complementary approach called spectral library search has emerged. Its essential idea is to build a library of experimental reference spectra rather than theoretically predicted ones. Since this approach was first introduced to the field of protein identification by Yates et al. (1998), the last decade has witnessed a group of mass spectral library search tools, such as SpectraST (Lam et al., 2007, 2008), NIST MSPepSearch (http://peptide.nist.gov/), BiblioSpec (Frewen et al., 2006), X!Hunter (Craig et al., 2006), ProMEX (Hummel et al., 2007), HMMatch (Wu et al., 2007) and MSDash (Wu et al., 2008).
Compared to the sequence database search, the spectral library search takes advantage of the previously obtained knowledge and has three obvious merits. First, improved sensitivity. Spectral library search takes into account the fragmentation pattern individually for each experimental spectrum. It yields more discriminative match scores than does the sequence database search. Second, high search speed. Experiments show that in shotgun proteomics some peptides are detected all the time while some are never (Lam et al., 2008). Thus a well-organized spectral library consisting of empirically observed experimental spectra permits a smaller and more accurate search space. Third, convenient identification of extraordinary spectra, such as those produced from peptides with unusual post-translational modifications (PTMs). These spectra are big challenges to sequence database search engines, but could be identified as easily as the ordinary ones by spectral library search (Craig et al., 2006; Hummel et al., 2007; Lam et al., 2007; Wu et al., 2007). Apparently, the above merits are based on reliable and comprehensive spectral libraries. One of the main obstacles is library coverage (Lam et al., 2007; Yates et al., 1998). Many efforts have been made on library constructions, such as NIST (http://peptide.nist.gov/) and PeptideAtlas (http://www.peptideatlas.org/speclib/). However, it remains difficult considering that PTMs may generate substantial modified forms of a peptide. Note that there have been hundreds of known modifications (e.g. 512 entries recorded in the RESID modification database by February 26, 2010) and only a few of them, e.g. phosphorylation, were extensively studied in the past.
In fact, PTM mapping has become the central issue of current proteomics. The conventional sequence database search approach meets inevitable difficulties in PTM-centric data analysis, since the PTM types have to be explicitly specified by users. In this case, not only are some possible unanticipated PTMs missed, but also the number of the PTMs considered has to be restricted to avoid combinatorial explosion of theoretical peptides in all possible modified forms. To solve these problems, the mode of open search has been proposed, in which the peptide precursor ion mass tolerance is largely expanded and one or more modification masses are inferred to compensate for the peptide mass difference (Chen et al., 2009; Tsur et al., 2005). Such an approach does not require specifying PTM types and is able to identify spectra from peptides with unanticipated PTMs, though it still has some defects to overcome (e.g. low search speed). Also, Bandeira et al. (2007) developed a database-independent algorithm, named Spectral-Networks, to detect spectral pairs produced from modified and unmodified versions of the same peptide and identify the unanticipated modifications by propagating spectral annotations in the networks of related spectral pairs. However, the potential of applying the same idea to the spectral library search had not been explored until very recently. Ahrne et al. (2009) proposed a workflow to combine open library search with sequence database search to increase spectral identification rate, but the library search engine they used was not deliberately designed for the open search mode. Besides, a spectral matching algorithm Bonanza is sometimes considered as an open library search tool (Falkner et al., 2008; Menschaert et al., 2009), but it was actually devised in a clustering framework and it is unknown whether the methods in it are directly applicable to general library search, such as the method for false discovery rate (FDR) control.
There are three key issues that have to be addressed when designing an open library search tool. The first one is the shifted m/z values of the product ions carrying PTMs. One solution to this issue lies in the proper use of precursor ion mass differences between the spectral pairs to be matched; that is, the mass differences should be considered as the potential PTM masses, as done by some open sequence database search engines, e.g. PTMap (Chen et al., 2009). However, none of the current library search algorithms has considered it. Although Bonanza does allow a mass shift equal to the mass difference when matching product ion peaks, the mass shift value is roughly determined without considering the charge states of product ions. The second issue is how to use the sequence information behind library spectra. Although some of the current library search algorithms have tried some ways to use the sequence information by annotating the explained peaks in library spectra, they do not make the best of it, especially for scoring. Usually, only a proportion of the theoretical product ions are observed in an experimental spectrum. However, the omitted proportion may also be valuable, in particular for the open search where the changes of peptide fragmentation patterns caused by some unanticipated PTM(s) should be considered. The third issue is FDR control of search results. The FDR control methods used in current library search engines are not as mature as those used in sequence database search, e.g. the widely adopted target-decoy database search strategy (Elias and Gygi, 2007).
In this article, we present a dedicated open spectral library search tool, named pMatch, to identify unanticipated PTMs from MS/MS data. It is the first time, to our knowledge, that the issues mentioned above are comprehensively addressed. First, the library is constructed with spectra optimized by the full peptide sequence information to better tolerate the peptide fragmentation pattern variations caused by some PTMs. Second, a new scoring system is devised, which uses charge-dependent mass shifts for peak matching and combines a probability-based model with the general spectral dot-product for scoring. Third, a target-decoy strategy is used for FDR control. To demonstrate the effectiveness of pMatch, a library search experiment was conducted on a public dataset of standard proteins with over 40 000 spectra. Since no open library search tool is currently available, comparison was made with SpectraST, the most popular library search engine. As expected, pMatch significantly outperformed SpectraST in detecting unanticipated PTMs and increasing the number of identified spectra. Additional validations were done on four published datasets including over 150 000 spectra; a variety of PTMs were found and the spectral identification rates were increased to a large extent.
2 METHODS
As an integrated library search engine, pMatch supports an entire workflow including library construction, spectral matching and result evaluation.
2.1 Library construction
pMatch enrolls the identified raw spectra and makes full use of their corresponding sequence information to construct the library of ‘optimized’ consensus spectra.
At the beginning, consensus spectra are generated from duplicate spectra for redundancy removal. Here, the credibly identified raw spectra with the same peptide sequence, charge and modification states are assumed as duplicate spectra. To produce a consensus spectrum, the peaks from each raw spectrum have their intensities normalized such that the top intensity value is one. The common peaks (peaks from different spectra but with small differences in m/z according to the instrument precision, e.g. ±0.5 Th for ion trap) in duplicate spectra are combined into a consensus peak, with the averaged m/z and intensity values. Only those consensus peaks occurring in the majority of the duplicate spectra are retained. All the peak intensities are then rescaled by taking their square roots. This strategy has been demonstrated to lead to better performance in spectral similarity comparison (Liu et al., 2007; Stein and Scott, 1994).
Next, consensus spectra are optimized by incorporating the peptide sequence information to make theoretical peaks ‘bud’ (including those unobserved ones). As is shown in Figure 1, for each consensus (experimental) spectrum, a theoretical spectrum is generated with theoretical ion peaks (the b/y series product ions for collision-induced dissociation (CID) in this study) in the observed m/z range, with a uniform intensity value one. In each consensus spectrum, peak intensities are normalized making the top intensity value be one. Then, the intensities of the peaks in the theoretical and consensus spectra are, respectively, multiplied by the factor of θ (0 ≤ θ ≤ 1) and 1 − θ, and the two spectra are merged by superimposing their common peaks. Thus, the optimized consensus spectra are generated, with each explained peak annotated by its ion type, fragmentation position and charge state. This ‘budding’ strategy regains a part of sequence information that was lost in the experimental spectra. The optimized spectra emerge as a theoretical and experimental duality and are expected to tolerate the variations in peptide fragmentation patterns introduced by some PTMs.
Fig. 1.
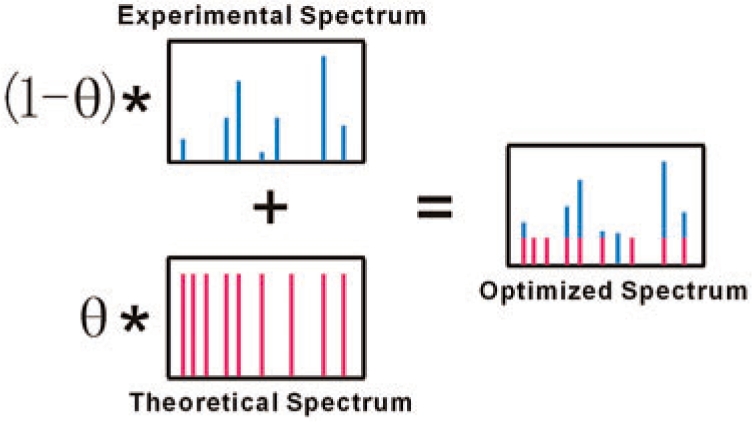
An optimized spectrum holds the duality of experimental and theoretical spectra. The parameter θ spanning from 0 to 1 can be considered as the tendency towards the theoretical spectrum. The optimized spectrum equals the experimental spectrum when θ is 0, and is shaped the same as the theoretical spectrum when θ reaches 1.
The last procedure is to generate a group of decoy spectra with the same volume as the optimized consensus spectra, since pMatch uses a target-decoy strategy to evaluate its search results. The details of decoy spectrum generation scheme will be described later in this article.
2.2 Spectral matching
Given a query spectrum, those library spectra with their precursor ion mass differences within a user-set tolerance and with the same charge state are selected as candidates for comparison. The precursor ion mass tolerance may be very large for the open search, e.g. ±300 Da. Finally, the candidate spectrum with the highest match score is assigned as the identification result of the query one.
2.2.1 Preprocessing
Before matching, each query spectrum undergoes a simple preprocessing procedure. Isotopic peaks are removed and the peak intensities are rescaled by taking their square roots. At most the top 6 peaks per 100 Th are reserved for later matching.
2.2.2 Peak hit determination
To determine peak hits when matching two spectra, the precursor ion mass difference (which we call ΔM in the following parts of this article) is used to compute the allowed mass shifts for peak matching. Since the charge states of the explained peaks in library spectra are already known, the mass shifts could be accurately determined. The specific rules to find out peak hits are exhibited as follows. Peaks from the query spectrum are examined in the descending order of their intensities. If the query peak being examined has its m/z value mQ, and the user-set product ion m/z tolerance is Tp, then two sets of library peaks are selected:
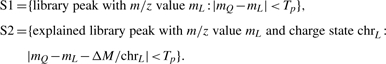 |
The peaks from either S1 or S2 are chosen as candidate peaks if the ΔM is big enough to cause a PTM (say beyond ±0.5 Da); otherwise, only peaks from S1 are chosen. The most intensive candidate peak is finally determined as the hit peak to the query peak. Each peak can only be hit at most once.
2.2.3 Similarity scoring
As for spectral similarity scoring, pMatch employs two sub-scores: a spectral dot-product score and a probability-based score.
The spectral dot-product score (SDP_Score) is calculated as:
| (1) |
where IL and IQ denote the intensities of the library peak and the query peak, respectively.
For a query spectrum, there are usually several candidate library spectra (here we let the number be W). To determine whether one match ‘stands out’ from the remaining candidates, we use a probability-based score. A peak in a query spectrum is defined as a capital peak if its intensity is no less than 5% of the most intensive peak and is ranked in the top 10 in this spectrum. A hit between a capital peak and an explained library peak is called a mighty hit. Let n be the number of the capital peaks in the query spectrum, ki be the number of mighty hits in the match between the query and the i-th candidate spectrum, and mi be the number of explained peaks of the i-th candidate (the value of mi is doubled if mass shifts are triggered in the i-th match). Then the global average probability (p) that a capital query peak and an explained library peak make a peak hit can be calculated as follows:
| (2) |
For each capital peak in the query spectrum, the probability (P) that a mighty hit occurs by chance between it and one of the explained peaks in the i-th candidate library spectrum is:
| (3) |
The probability (P_value) that ki or more mighty hits occur by chance between the query and the i-th candidate library spectrum is:
| (4) |
The probability-based score, denoted by P_Score, is then calculated according to Equation (5). It evaluates the significance of a certain match on the basis of the statistic background of all candidate matches.
| (5) |
The final score of a match between a library spectrum and the query spectrum, as we call ‘pMatch_Score’, is the product of SDP_Score and P_Score:
| (6) |
2.2.4 PTM locating
After the library spectrum with the highest pMatch_Score is found, the location of the PTM on the peptide is assigned as follows. Each amino acid residue is assumed as the PTM site and a theoretical spectrum is predicted from the peptide with the PTM-containing product ion peaks shifted accordingly. Then this series of theoretical spectra are scored against the query spectrum using the common spectral dot-product. The highest scored site is accepted as the PTM location.
2.3 Control of false discovery rate
If a large set of query spectra are searched, then the control of FDR is necessary. Since the target-decoy search strategy has been the leading way to estimate the FDR of the sequence database search results, a natural idea is to extend it to the spectral library search. Yen et al. (2009) and Lam et al. (2010) have demonstrated the feasibility of using decoy spectra for FDR estimation in the spectral library search. Here, we extend this idea into the open search mode, and employ a similar approach for decoy spectra generation. For each optimized consensus spectrum in the library, a decoy spectrum is generated with the same precursor ion mass and charge state. Since the amino acid sequence is already known, a ‘pseudo-reversed’ (Elias and Gygi, 2007) sequence is made from the original peptide sequence; that is, the sequence of all the amino acid residues is reversed except the C-term one, by which means the enzyme digestion feature is reserved. Then, the corresponding decoy spectrum is born with explained peaks moved to the new m/z positions determined by their annotations and the pseudo-revered sequence.
pMatch filters search results by their pMatch_Scores and estimates FDR using the formula FDR = FP/TP, where FP and TP represent the numbers of matches to the decoy and original spectra, respectively. Importantly, for the open search mode, an issue that could produce considerable impact on spectral identification rate is the result filtration rule. The normal rule is to rank the whole result list by score and then calculate the estimated FDR. Because of the mass shifting strategy used in the open search, however, a pair of spectra with significant ΔM (where mass shifting works) raises the chance of peak hits, and thus are likely to produce a higher score compared to the pairs with insignificant ΔM. Obviously, the false positive identifications with significant ΔM would have higher chance to pass a uniform score cutoff. Therefore, a more reasonable filtration rule that we advocate is to group all the results into two lists according to their ΔM values, i.e. those with insignificant ΔM and those with significant ΔM. Afterwards, the results in the two groups are ranked separately for FDR estimation. This separate filtration rule is expected to increase the spectral identification rate compared to the normal rule.
3 RESULTS
In this study, a comparison experiment on a public dataset was carried out with detailed analysis between pMatch and SpectraST in both the conventional and the open search modes. To further validate pMatch, four additional published datasets were analyzed in the open search mode. The five datasets including ∼200 000 spectra in total were all engaged in the same experimental workflow.
3.1 Datasets and library construction
The five published datasets chosen in this study were from different species. The MS spectra were derived from high- or medium-precision instruments, as the use of high-precision instruments becomes the trend of proteomics development (Mann and Kelleher, 2008), and it is practical to gain more accurate PTM masses determined by the precursor ion mass differences. The brief summaries of the datasets are given below:
ISB-18mix is designed deliberately for the purpose of testing peptide and protein identification software tools (Klimek et al., 2008). Eighteen purified recombinant proteins were mixed and digested by trypsin into peptide mixtures, which were then analyzed by LC-MS/MS on diverse mass spectrometers under various conditions. In this study, the Mixture 3 on a LTQ-FT mass spectrometer with all 10 LC-MS/MS runs was chosen for our experiment. We focused on the analysis of this data for comparison between pMatch and SpectraST.
TAP-PSD95 refers to the samples from the mice with proteins in gene-targeted TAP tagging. The samples were purified in four replicates, which were then analyzed by LTQ-FT mass spectrometer (Fernandez et al., 2009). Replicate_2 was randomly chosen for our experiment.
HUPO-14 is from a study in which 20 highly purified recombinant human proteins were distributed to 27 laboratories for mass spectrometry-based analysis (Bell et al., 2009). The data from Lab 14 was chosen in our study and the instrument they used was LTQ-FT.
Haas-Data refers to a yeast sample digested by trypsin, from which the collision activated dissociation (CAD) MS/MS spectra were produced by different mass spectrometers (Haas et al., 2006). Only the dataset from the LTQ-FT instrument was used here.
Gygi-Qstar refers to the yeast proteome digested by trypsin which was analyzed by LC-MS/MS using a Q-STAR mass spectrometer (Elias et al., 2005).
The way to construct the spectral libraries is similar to that proposed by Ahrne et al. (2009). This way has been demonstrated to be very effective in increasing the spectral identification rate of a dataset. First, the spectra in a dataset are searched against a protein sequence database. Then, the credibly identified spectra are accumulated to construct a spectral library, against which the remaining spectra are afterwards searched.
3.2 Results on the ISB-18mix dataset
To identify some of the spectra for library construction, the pFind search engine (Fu et al., 2004; Li et al., 2005; Wang et al., 2007) (version 2.3) was used to search a target-decoy sequence database including the standard, pollution and background proteins (see Supplementary Data for the detailed description of the database). During searching, the precursor ion mass tolerance was set to ±50 ppm, and the product ion m/z tolerance was ±0.5 Th. Full tryptic specificity was applied, allowing up to two missed cleavage sites. Carbamidomethylation of cysteine was specified as a fixed modification, and oxidation of methionine as a variable one. After sequence database search, we observed that most of the identified spectra with high confidence had their precursor ion mass biases of around +2 ppm. The search results were then filtered with precursor ion mass deviation from −2 to +6 ppm at 1% FDR. Additionally, only those spectra from the proteins containing at least two unique detected peptides were reserved. Finally, a total of 12 032 identified spectra, including 577 unique peptides (with distinct amino acid sequences and PTMs) and 963 unique precursor ions (with distinct sequences, PTMs and charge states), were obtained and used to construct a spectral library.
In terms of the library search, pMatch (version 1.0) and SpectraST (version 3.1) were engaged with the same spectral source for library constructions and searches, and both the conventional and the open searches were carried out. For SpectraST, the precursor ion m/z tolerances were set to ±2 and ±150 Th, respectively, for the conventional and the open searches. The parameter to control the production m/z tolerance was 1 bin/Th (equal to ±0.5 Th). The search results were post-processed by PeptideProphet (Keller et al., 2002) for FDR estimation, as suggested by Lam et al. (2007, 2008). While for pMatch, in library construction, the θ in the ‘budding’ step was set to zero for conventional search to reduce spectral distortion and was set to 0.2 for open search to increase the robustness of the library. Given that the lowest charge state of the spectra in this dataset was 2+, the precursor ion mass tolerances were set to ±4 and ±300 Da, respectively, for the conventional and the open searches. The product ion m/z tolerance was ±0.5 Th. The FDRs of the search results were controlled by the target-decoy strategy with the normal filtration rule (not the separate filtration rule for a fair comparison).
The number of identified spectra from both engines at different FDR cutoffs are illustrated in Figure 2. It can be seen that compared to the conventional search, the open search significantly increased the number of identified spectra for both search engines. pMatch and SpectraST comparably performed in the conventional search. When it comes to the open search, however, pMatch identified nearly twice as many spectra as SpectraST through the whole FDR range considered.
Fig. 2.

FDR curves for pMatch (solid lines) and SpectraST (dashed lines) search engines. The x-axis denotes the FDR value and the y-axis denotes the number of identified spectra. The thin and thick lines represent the results of the conventional and the open searches, respectively.
In order to explore the differences between the two engines, a careful analysis was conducted on the results under 1% FDR. In the conventional search, as shown in Figure 3a, there were 2462 spectra identified by both engines, among which 2451 had agreeable matches and 11 conflicted. After manually validating the 11 spectra by taking a close-up view of their MS/MS spectra and tracing back to the corresponding MS spectra, we found all of the 11 query spectra were co-eluted spectra and their identifications by the two engines caught different components. Supplementary Figure S1 gives a typical example of a co-eluted spectrum. Unlike the conventional search where the two engines showed over 80% overlap between their results, in the open search, as revealed by Figure 3b, only <40% of the pMatch's identifications could be found in SpectraST's results, although the 13 disagreements all came from co-eluted spectra also.
Fig. 3.

Venn diagrams of the number of identified spectra at 1% FDR from pMatch and SpectraST in the conventional (a) and open (b) search modes. The ashen regions denote the spectra with inconsistent identifications from the two engines.
As is discussed previously, each identification has the precursor ion ΔM as the potential PTM mass in the open search. The histograms of the ΔM values detected by the two engines are exhibited in Figure 4. As shown, some intensive ΔM detected by pMatch were not or rarely detected by SpectraST, for example, −128 Da (lysine loss), 22 Da (sodium adduct), 38 Da (calcium adduct) and 152 Da (carbamidomethylDTT). The crucial reasons should be that some modified spectra have a considerable percent of the observed peaks with their m/z values shifted and that some special PTMs might largely vary the fragmentation pattern of a peptide (see Supplementary Figure S2 for a spectrum with a sodium adduct and Supplementary Figure S3 for the influence of the ‘budding’ strategy on PTM detecting). However, neither did SpectraST consider the mass shifts caused by unanticipated PTMs during peak matching, nor made use of the sequence information to tolerate the peptide fragmentation pattern variations. On the contrary, SpectraST identified more spectra with very small absolute ΔM values (within ±5 Da), which mainly resulted from duplicate spectra, co-eluted spectra and spectra from deamidated peptides.
Fig. 4.

Histograms of ΔM detected by pMatch (top) and SpectraST (bottom). The intensive peaks are annotated by their ΔM values in integer accuracy.
Then, we concentrated on the abundant ΔM (with ≥20 spectra for either engine) and manually validated some representative spectra. Nearly all of the abundant ΔM were explained (see Supplementary Table S1 for their frequencies and explanations). Among these ΔM, many PTMs were found (shown in Table 1); for example, a disulfide bridge was detected (shown in Figure 5). Additionally, some ΔM were caused by amino acid substitutions, or missed cleavages, or semi-digestions, while some corresponded to the combinations of two or more other ΔM values. Only two ΔM were not explained using our current knowledge. One of them had evidence supporting that there was indeed something happened on the peptides (see Supplementary Figure S4), while the other one might be a false positive.
Table 1.
The open search results of pMatch on all datasets
| Dataset | Total MS/MS | Identified spectra |
Identification rate raised by Spec Lib | Abundant modifications (Da) | |
|---|---|---|---|---|---|
| Seq DB | Spec Lib | ||||
| ISB-18mix | 40 376 | 12 032 | +8025 | 29.80% → 49.68% | −116 (a disulfide bridge); −18 (dehydration); −17 (ammonia loss); |
| −16 (ammonia loss and deamidation); 1 (deamidation); | |||||
| 2 (two deamidations); 16 (oxidation); 22 (sodium); | |||||
| 23 (sodium and deamidation); 26 (acetaldehyde +26); | |||||
| 38 (calcium); 39 (calcium and deamidation); | |||||
| 152 (carbamidomethylDTT); | |||||
| 153 (carbamidomethylDTT and deamidatoin); | |||||
| 174 (carbamidomethylDTT and sodium) | |||||
| TAP-PSD95 | 36 387 | 3575 | +1882 | 9.82% → 15.00% | −18 (dehydration); −17 (ammonia loss); 1 (deamidation); |
| 14 (methylation); 16 (oxidation); 22 (sodium); | |||||
| 26 (acetaldehyde +26); 28 (formylation); 32 (dioxidation); | |||||
| 42 (acetylation); 54 (acetaldehyde +26 and formylation); | |||||
| 70 (formylation and acetylation); 80 (phosphorylation) | |||||
| HUPO-14 | 15 221 | 7281 | +2418 | 47.84% → 63.72% | −17 (ammonia loss); 1 (deamidation); |
| 12 (formaldehyde induced modification); | |||||
| 71 (propionamide); 26 (acetaldehyde +26); 42 (acetylation) | |||||
| Haas-Data | 56 599 | 9172 | +2558 | 16.21% → 20.74% | −17 (ammonia loss); 1 (deamidation); 43 (carbamylation); |
| 171 (carbamylation and lysine added) | |||||
| Gygi-Qstar | 46 195 | 9255 | +4357 | 20.03% → 29.40% | 1 (deamidation); 12 (formaldehyde induced modification); |
| 22 (sodium); 28 (formylation) | |||||
Fig. 5.

An example of a disulfide bridge. (a and b) are the tandem mass spectra of a same peptide sequence IVSNASCTTNCLAPLAK, but the former one is with two carbamidomethylated cysteines, while the latter one has a disulfide bridge across the two cysteines. The spectrum in (a) has several product ions indicating the CID fragmentations between the two cysteines, while in (b) no noticeable ions supporting such fragmentations can be found in the query spectrum identified with the ΔM of −116.06 Da. Most of intensive peaks are explained with low m/z errors.
In addition to those abundant ΔM, low-abundance ones also provided a wealth of information. Some of them corresponded to important PTMs, such as phosphorylation. pMatch and SpectraST identified 13 and eight spectra, respectively, with ΔM of 79.97 Da. These spectra are supposed to be derived from phosphorylated peptides.Figure 6 gives an example of such spectra.
Fig. 6.

A spectrum from a phosphorylated peptide. This triply charged spectrum was identified to have the peptide sequence of TGKPDYVTDSAASATAWSTGVK, with a ΔM of 79.97 Da that implies a phosphorylation. The modified site is the 10th amino acid residue (the first serine) from the N-term. The neutral loss peaks of precursor ions by masses of −98 and −116 Da are obvious, and there are also many neutral loss peaks of product ions by −98 Da. These features are typical for spectra of phosphorylated peptides. Most of intensive peaks are explained with low m/z errors.
3.3 Results on four additional datasets
For further validations, four additional published datasets were analyzed by pMatch in the open search mode, obeying the same workflow as above. The detailed search parameters are listed in Supplementary Table S2. To explore how much in the end pMatch could help to increase the spectral identification rate, here we used the separate filtration rule for FDR estimation. Table 1 shows the analysis results. For completeness, the result of the ISB-18mix dataset is also listed. We can see that the spectral identification rates significantly grew after library search and some interesting modifications were detected. For example, the ΔM of 12 Da detected in two datasets all occurred on peptide N-terms or basic amino acids. This modification is induced by formaldehyde (Toews et al., 2008), and has been recently detected in other datasets (Menschaert et al., 2009). Other detected PTMs include formylation (28 Da), acetylation (42 Da), methylation (14 Da), etc. Interestingly, in the Gygi-Qstar dataset, a number of spectra are identified with ΔM distributed from −20 to −3 Da. Many of them show no mass shift in product ions, compared with their matched library spectra (see Supplementary Figure S5), indicating that their precursor ion masses might have been incorrectly judged.
4 CONCLUSION
We have presented a novel spectral library search tool, pMatch, deliberately designed for the open search mode. Its ability to identify spectra with unanticipated PTMs was demonstrated on several datasets. In cooperation with traditional sequence database search, pMatch is able to push up the spectral identification rate to a large extent. The key points to contributing the success of this method lie in three aspects: the consideration of accurate mass shifts for peak matching; the use of full peptide sequence information for consensus spectral optimization; a new scoring function that combines the general intensity-based dot-product with a probabilistic model of peak matching.
Supplementary Material
ACKNOWLEDGEMENTS
The authors thank Dr Wilhelm Haas (Harvard Medical School) for providing the dataset Haas-Data in RAW format, and thank Dr Henry H.N. Lam (Department of Chemical and Biomolecular Engineering, HKUST) and Dr Stephen E. Stein (National Institute of Standards and Technology) for valuable discussions.
Funding: This study was supported by the National Natural Science Foundation of China under grant no. 30900262; the CAS Knowledge Innovation Program under grant no. KGGX1-YW-13; the National Key Basic Research and Development Program (973) of China under grant no. 2010CB912701; and the National High Technology Research and Development Program (863) of China under grant nos. 2007AA02Z315, 2008AA02Z309.
Conflict of Interest: none declared.
REFERENCES
- Ahrne E, et al. A simple workflow to increase MS2 identification rate by subsequent spectral library search. Proteomics. 2009;9:1731–1736. doi: 10.1002/pmic.200800410. [DOI] [PubMed] [Google Scholar]
- Bandeira N, et al. Protein identification by spectral networks analysis. Proc. Natl Acad. Sci. USA. 2007;104:6140–6145. doi: 10.1073/pnas.0701130104. [DOI] [PMC free article] [PubMed] [Google Scholar]
- Bell AW, et al. A HUPO test sample study reveals common problems in mass spectrometry-based proteomics. Nature Methods. 2009;6:423–440. doi: 10.1038/nmeth.1333. [DOI] [PMC free article] [PubMed] [Google Scholar]
- Chen Y, et al. PTMap-A sequence alignment software for unrestricted, accurate, and full-spectrum identification of post-translational modification sites. Proc. Natl Acad. Sci. USA. 2009;106:761–766. doi: 10.1073/pnas.0811739106. [DOI] [PMC free article] [PubMed] [Google Scholar]
- Craig R, et al. Using annotated peptide mass spectrum libraries for protein identification. J. Proteome Res. 2006;5:1843–1849. doi: 10.1021/pr0602085. [DOI] [PubMed] [Google Scholar]
- Elias JE, Gygi SP. Target-decoy search strategy for increased confidence in large-scale protein identifications by mass spectrometry. Nat. Methods. 2007;4:207–214. doi: 10.1038/nmeth1019. [DOI] [PubMed] [Google Scholar]
- Elias JE, et al. Comparative evaluation of mass spectrometry platforms used in large-scale proteomics investigations. Nature Methods. 2005;2:667–675. doi: 10.1038/nmeth785. [DOI] [PubMed] [Google Scholar]
- Eng JK, et al. An approach to correlate tandem mass-spectral data of peptides with amino-acid-sequences in a protein database. J. Am. Soc. Mass Spectrometry. 1994;5:976–989. doi: 10.1016/1044-0305(94)80016-2. [DOI] [PubMed] [Google Scholar]
- Falkner JA, et al. A spectral clustering approach to MS/MS identification of post-translational modifications. J. Proteome Res. 2008;7:4614–4622. doi: 10.1021/pr800226w. [DOI] [PubMed] [Google Scholar]
- Fernandez E, et al. Targeted tandem affinity purification of PSD-95 recovers core postsynaptic complexes and schizophrenia susceptibility proteins. Mol. Syst. Biol. 2009;5:269. doi: 10.1038/msb.2009.27. [DOI] [PMC free article] [PubMed] [Google Scholar]
- Frewen BE, et al. Analysis of peptide MS/MS spectra from large-scale proteomics experiments using spectrum libraries. Anal. Chem. 2006;78:5678–5684. doi: 10.1021/ac060279n. [DOI] [PubMed] [Google Scholar]
- Fu Y, et al. Exploiting the kernel trick to correlate fragment ions for peptide identification via tandem mass spectrometry. Bioinformatics. 2004;20:1948–1954. doi: 10.1093/bioinformatics/bth186. [DOI] [PubMed] [Google Scholar]
- Haas W, et al. Optimization and use of peptide mass measurement accuracy in shotgun proteomics. Mol. Cell. Proteomics. 2006;5:1326–1337. doi: 10.1074/mcp.M500339-MCP200. [DOI] [PubMed] [Google Scholar]
- Hummel J, et al. ProMEX: a mass spectral reference database for proteins and protein phosphorylation sites. BMC Bioinformatics. 2007;8:216. doi: 10.1186/1471-2105-8-216. [DOI] [PMC free article] [PubMed] [Google Scholar]
- Keller A, et al. Empirical statistical model to estimate the accuracy of peptide identifications made by MS/MS and database search. Anal. Chem. 2002;74:5383–5392. doi: 10.1021/ac025747h. [DOI] [PubMed] [Google Scholar]
- Klimek J, et al. The standard protein mix database: a diverse data set to assist in the production of improved peptide and protein identification software tools. J. Proteome Res. 2008;7:96–103. doi: 10.1021/pr070244j. [DOI] [PMC free article] [PubMed] [Google Scholar]
- Lam H, et al. Development and validation of a spectral library searching method for peptide identification from MS/MS. Proteomics. 2007;7:655–667. doi: 10.1002/pmic.200600625. [DOI] [PubMed] [Google Scholar]
- Lam H, et al. Building consensus spectral libraries for peptide identification in proteomics. Nature Methods. 2008;5:873–875. doi: 10.1038/nmeth.1254. [DOI] [PMC free article] [PubMed] [Google Scholar]
- Lam H, et al. Artificial decoy spectral libraries for false discovery rate estimation in spectral library searching in proteomics. J. Proteome Res. 2010;9:605–610. doi: 10.1021/pr900947u. [DOI] [PubMed] [Google Scholar]
- Li DQ, et al. pFind: a novel database-searching software system for automated peptide and protein identification via tandem mass spectrometry. Bioinformatics. 2005;21:3049–3050. doi: 10.1093/bioinformatics/bti439. [DOI] [PubMed] [Google Scholar]
- Liu J, et al. Methods for peptide identification by spectral comparison. Proteome Science. 2007;5:3. doi: 10.1186/1477-5956-5-3. [DOI] [PMC free article] [PubMed] [Google Scholar]
- Mann M, Kelleher NL. Precision proteomics: the case for high resolution and high mass accuracy. Proc. Natl Acad. Sci. USA. 2008;105:18132–18138. doi: 10.1073/pnas.0800788105. [DOI] [PMC free article] [PubMed] [Google Scholar]
- Menschaert G, et al. Spectral clustering in peptidomics studies helps to unravel modification profile of biologically active peptides and enhances peptide identification rate. Proteomics. 2009;9:4381–4388. doi: 10.1002/pmic.200900248. [DOI] [PubMed] [Google Scholar]
- Perkins DN, et al. Probability-based protein identification by searching sequence databases using mass spectrometry data. Electrophoresis. 1999;20:3551–3567. doi: 10.1002/(SICI)1522-2683(19991201)20:18<3551::AID-ELPS3551>3.0.CO;2-2. [DOI] [PubMed] [Google Scholar]
- Stein SE, Scott DR. Optimization and testing of mass-spectral library search algorithms for compound identification. J. Am. Soc. Mass Spectrometry. 1994;5:859–866. doi: 10.1016/1044-0305(94)87009-8. [DOI] [PubMed] [Google Scholar]
- Toews J, et al. Mass spectrometric identification of formaldehyde-induced peptide modifications under in vivo protein cross-linking conditions. Anal. Chim. Acta. 2008;618:168–183. doi: 10.1016/j.aca.2008.04.049. [DOI] [PubMed] [Google Scholar]
- Tsur D, et al. Identification of post-translational modifications by blind search of mass spectra. Nature Biotechnology. 2005;23:1562–1567. doi: 10.1038/nbt1168. [DOI] [PubMed] [Google Scholar]
- Yates JR, et al. Method to compare collision-induced dissociation spectra of peptides: potential for library searching and subtractive analysis. Anal. Chem. 1998;70:3557–3565. doi: 10.1021/ac980122y. [DOI] [PubMed] [Google Scholar]
- Yen CY, et al. A simulated MS/MS library for spectrum-to-spectrum searching in large scale identification of proteins. Mol. Cell. Proteomics. 2009;8:857–869. doi: 10.1074/mcp.M800384-MCP200. [DOI] [PMC free article] [PubMed] [Google Scholar]
- Wang LH, et al. pFind 2.0: a software package for peptide and protein identification via tandem mass spectrometry. Rapid Commun. Mass Spectrometry. 2007;21:2985–2991. doi: 10.1002/rcm.3173. [DOI] [PubMed] [Google Scholar]
- Wu X, et al. HMMatch: peptide identification by spectral matching of tandem mass spectra using hidden Markov models. J. Comput. Biol. 2007;14:1025–1043. doi: 10.1089/cmb.2007.0071. [DOI] [PMC free article] [PubMed] [Google Scholar]
- Wu Z, et al. MSDash: mass spectrometry database and search. Comput. Syst. Bioinformatics Conf. 2008;7:63–71. [PubMed] [Google Scholar]
Associated Data
This section collects any data citations, data availability statements, or supplementary materials included in this article.