Abstract
We present a new, first-of-its-kind, fully automated computational tool MOTIF-EM for identifying regions or domains or motifs in cryoEM maps of large macromolecular assemblies (such as chaperonins, viruses, etc.) that remain conformationally conserved. As a by-product, regions in structures that are not conserved are revealed: this can indicate local molecular flexibility related to biological activity. MOTIF-EM takes cryoEM volumetric maps as inputs. The technique used by MOTIF-EM to detect conserved sub-structures is inspired by a recent breakthrough in 2D object recognition. The technique works by constructing rotationally invariant, low-dimensional representations of local regions in the input cryoEM maps. Correspondences are established between the reduced representations (by comparing them using a simple metric) across the input maps. The correspondences are clustered using hash tables and graph theory is used to retrieve conserved structural domains or motifs. MOTIF-EM has been used to extract conserved domains occurring in large macromolecular assembly maps, including as those of viruses P22 and epsilon 15, Ribosome 70S, GroEL, that remain structurally conserved in different functional states. Our method can also been used to build atomic models for some maps. We also used MOTIF-EM to identify the conserved folds shared among dsDNA bacteriophages HK97, Epsilon 15, and ô29, though they have low-sequence similarity.
Contact: mitul@cs.stanford.edu
Supplementary information: Supplementary data are available at Bioinformatics online.
1 INTRODUCTION
The key processes in a cell, the fundamental building block of life, are carried out or at-least influenced by large macromolecular assemblies (LMAs) such as ribosomes and chaperonins. Understanding their structures and interactions is needed for understanding their mechanisms and hence essential for a complete understanding of life processes at the molecular level. A major development over the last 15 years has been the success of cryoEM in the very challenging task of determining and understanding the structures of LMAs (often in the molecular mass range 1–100 million Da). CryoEM has emerged as a method distinctly more suited for determining and understanding structures of LMAs in under near-native conditions and inferring conformation flexibility (by capturing ‘snapshots’ of dynamic processes) associated with their working mechanisms (Chiu et al., 2006; Jiang and Ludtke, 2005). With recent automation advances, CryoEM structures of large assemblies can be obtained at subnanometer resolution within few days of work (Zhang et al., 2009).
Structural comparison is a critical step in structural biology research using cryoEM. For instance, in order to derive the functional mechanism of a newly determined structure, it is often compared with structures (for instance, same molecule in different functional states) already determined and studied by X-ray crystallography or cryoEM. In this article we present a new fully automated first-of-its-kind computational tool MOTIF-EM, which is meant to solve an important structural comparison problem P.
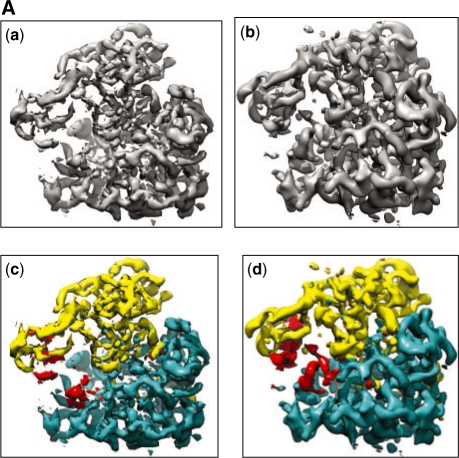
P is defined as follows: compare a non-atomic resolution structure (i.e. a cryoEM map from EMDB) with another structure (either another cryoEM map or a map blurred from a crystal structure) and identify conserved structural domains or motifs or sub-map (if there is any) between the pair of input structures. The by-product of solving P is revelation of the regions in the input pair which are not-conserved between them. These non-conserved regions can point to local molecular flexibility related to biological activity, if the input pair are same molecule in two different functional states. For instance, two cryoEM maps of ribosome 70S are shown in Figure 9Aa and b Solving P with these two maps as input means detecting the location and shape (or domain boundary) of the two domains: 50S and 30S (shown as yellow and blue regions, respectively, in Fig. 9Ac and d) that are known to be structurally conserved between the two maps. The by-product of solving P for this pair of 70S, is the revelation of the regions which are not-conserved or flexible between the input structure pair, i.e. the red regions, as detected by MOTIF-EM, in Figure 9Ac and d. This region has been implicated with EF-G binding and and tRNA locomotion (Valle et al., 2003).
Fig. 9A.
(Aa and Ab) Input pair for MOTIF-EM: CryoEM maps corresponding to the pre- (Aa) and post- (Ab) translocational states of ribosome 70S. (Ac and Ad) The input map pair shown in Figure 9A (a and b) is now color-coded. The two conserved domains in (Ac) and their counterparts in (Ad), as determined by MOTIF-EM, are shown as yellow and blue regions, respectively. The red region in (Ac and Ad) is the remnant non-conserved region in the input maps.
Prior to MOTIF-EM, there was no direct and fully automated way of solving P, without substantial prior knowledge (unavailable at times)—such as, the occurrence of the common conserved sub-region in the two input maps as a high-resolution structural homolog in some domain databank (such as SCOP). See Section 2 for more details.
Structural comparison tools like MOTIF-EM are useful as conserved motifs or domains can point to conserved active sites, indicating function sharing, evolutionary relationships or drug binding targets for therapies. The remaining non-conserved regions in the input structure pair, revealed as by-product, can point to local molecular flexibility related to biological activity. MOTIF-EM is expected to work with cryoEM maps upto the resolution when structural domains and assembly components in the maps remain detectable, which is typically believed to be 15 Å or better resolution (Lasker et al., 2007). Apart from breaking a map into conserved and non-conserved regions, we will show that MOTIF-EM can be used to:
infer conformation changes (Section 4.2.1),
dock atomic-resolution domains (from NMR and X-ray crystallography based methods) into cryoEM maps (Sections 4.2.2),
propose atomic models for cryoEM maps in some cases (Section 4.2.2), and
compare maps of proteins with little sequence similarity (Section 4.2.3).
The technique used by MOTIF-EM to detect conserved sub-structures is inspired by Lowe (2004)—a recent breakthrough in 2D object recognition.
2 RELATED WORK
The indirect approach in Lasker et al. (2005, 2007) to solve P is to first convert input maps into collections of helices (which requires manual specification of appropriate map density thresholds (Jiang et al., 2001) that can be found in the input maps, ignoring any other non-helical information in the input maps. Hence this approach is not suitable for those cryoEM maps which are predominantly defined by non-helical entities (such as, beta sheets) or even hardly detectable helices (like ones that are short or occur in maps coarser than 10 Å resolution). MOTIF-EM, on the other hand, does not do any reduction of input maps and works on their full form and is fully automated (i.e. does not require the user to guess and provide input parameters). Hence, unlike Lasker et al. (2005, 2007), MOTIF-EM is applicable to any kind of macromolecular cryoEM map.
Other available methods that could help solve P, but in limited cases, can be described in two classes:
‘Compare and dock’ methods: Methods like (Ceulemans and Russell, 2004; Jiang et al., 2001; Roseman, 2000; Rossmann et al., 2001; Topf et al., 2005; Volkmann and Hanein, 2003) search atomic-resolution domain banks (e.g. SCOP) for structural homologs of the domains in a given cryoEM map. Structural homologs, if found, are docked into appropriate regions of the maps resulting in full or partial atomic resolution models for the map. Some, like (Tama and Miyashita, 2004; Wriggers and Birmanns, 2001), also allow conformational flexibility in the docked homologs.
De novo methods: These methods (Baker et al., 2007; Yu and Bajaj, 2007) try to detect long helices and large beta sheets in maps with sub-nanometer resolution. In the cryoEM maps with resolution better than 4.5 Å, backbone tracing has also been achieved (Jiang et al., 2008; Ludtke et al., 2008).
One could use methods from these two classes to construct the backbone (which can have construction errors), of the macromolecular assembly, after which one could use existing common protein substructure determination methods to solve P. But this approach has a very limited applicability as constructing the backbone using the class (I) and (II) methods is not easy in the first place. For instance, class (I) methods assume that isolated high-resolution structural homologs of different parts of a given cryoEM are available in some databank, which is often not the case. Moreover, class (II) methods can only be used in maps which are predominantly composed of long helices and large sheets and are in the sub-nanometer resolution range, which is again not common. Also both (I) and (II) may require significant amount of manual intervention. On the other hand, MOTIF-EM searches for conserved domains between the input cryoEM maps without depending on the availability of isolated structural homologs or backbone trace or even detectable secondary-structure elements in the maps and in a fully automated way. As indicated earlier, MOTIF-EM can also be used to compare a cryoEM map with an atomic-resolution structure, from say X-ray crystallography or NMR-based methods.
3 METHOD: THE ALGORITHM MOTIF-EM
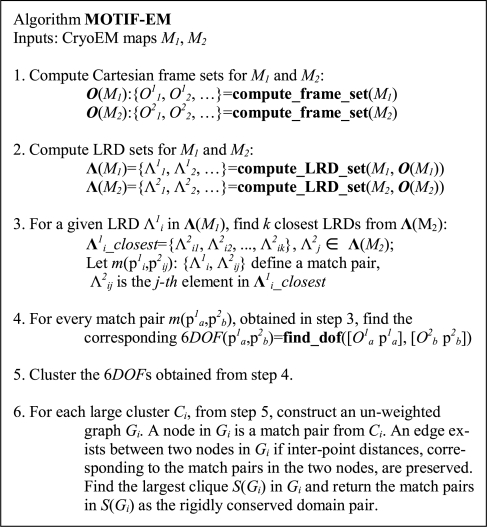
In this section we describe the working mechanism of our new structural comparison computational tool MOTIF-EM. Its main steps are summarized in Figure 1A. MOTIF-EM takes as input a pair of cryoEM maps M1, M2. If one of the inputs is an atomic resolution structure, then it has to be converted to a simulated cryoEM map using, say, ‘pdb2mrc’ in the EMAN package (Ludtke et al., 1999).
Fig. 1A.
Outline of the MOTIF-EM algorithm.
Notations:
Mi: map i, i = 1,2.
pij: grid point pj in map i.
Λij: LRD at grid point pj in map i
m(pij, pkl): A match pair of grid points pij (from map i) and pkl (from map k), i∼=k.
O(pij) or Oij: O-XYZ Cartesian reference frame at grid point pij.
If S is a set, S(i) is the i-th element of S.
X′: transpose of X.
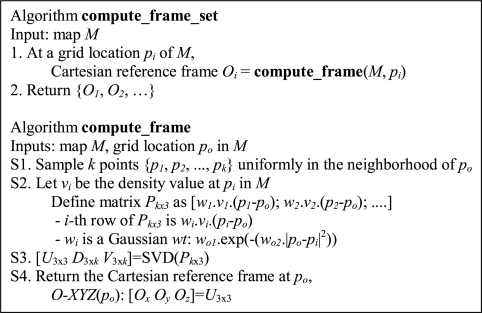
In Step 1 of Figure 1A (also see Fig. 2), MOTIF-EM finds local O-XYZ Cartesian reference frames for all the grid points in M1 and M2 using ‘compute_frame_set’ (Fig. 1B). At a given grid point po, an O-XYZ Cartesian reference frame is placed, such that the orthogonal directions X, Y, Z represent directions of larger local density variations. This is achieved by sampling k points in the neighborhood of po (Figs 1B, S1). Singular value decomposition (SVD) is done on the density variations of the sampled points (Figs 1B, S2) to obtain the orientation of O-XYZ (Figs 1B, S3 and S4: X is the first column of U, and so on).
Fig. 2.
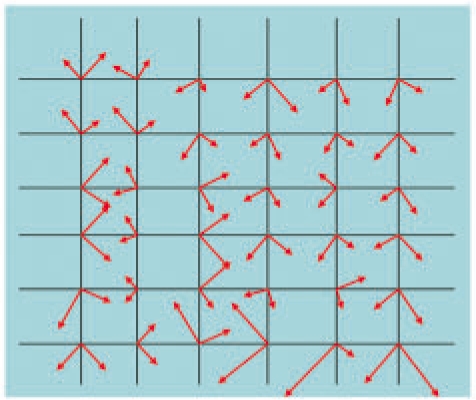
Step 1 of MOTIF-EM (Fig. 1A), mimicked in 2D. A Cartesian reference frame is placed at each of the grid points. The length of a frame axis reflects the extent of local density variation along the axis.
Fig. 1B.
Outline of algorithm for computing local Cartesian reference frames.
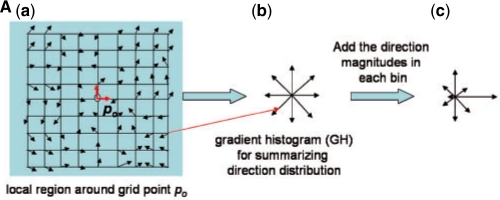
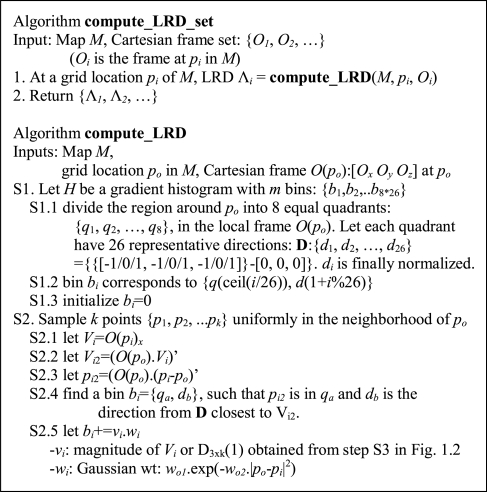
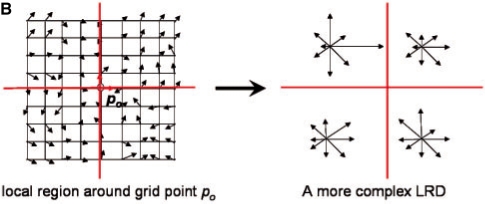
In Step 2 of Figure 1A (also see Fig. 3A), MOTIF-EM finds a local region descriptor (LRD), denoted by Λ, for all the grid points in M1 and M2 (Fig. 1C). For a grid point po, Λ(po) is a rotationally invariant, reduced representation of the local region around po. Rotational invariance enables comparison of local regions around a pair of grid points, via respective Λ's, directly without worrying about pre-aligning the local regions. Λ is essentially a 3D extension of the 2D LRD proposed in Lowe (2004) (referred to as ‘Keypoint’). Figure 1C describes the construction of Λ's. K points {p1, p2,…, pk} are first sampled around po (Figs 1C, S2). Then Λ(po) is essentially a gradient histogram GH(po) (Fig. 3Ab), representing a coarse discretization of the [-π, π]× [0, π] direction space, in which the local gradients at the sampled points are distributed. In our implementation a GH has 26 bins (or representative gradient directions). For a sampled point pi, the local gradient gi (the first axis of the local frame at pi) is first re-expressed in the local frame at po (Figs 1C, S2.1–2) and then put into the GH bin which represents the direction closest to gi (Figs 1C, S2.4). Re-expressing the gi's in the local frame of po makes Λ(po) rotationally invariant (Lowe, 2004). After putting all gi's in the bins, for a given bin the magnitudes of the gradients stored in it are summed up to get a numerical value for that bin (Figs 1C, S2.5). Then Λ(po) is essentially the numerical values of the bins stacked as a vector. A more complex LRD (the one actually described in Fig. 1C) is constructed by dividing the region around po into eight quadrants, constructing a Λ(po)i for each quadrant, and stacking the Λ(po)i's together as a vector [Λ(po)1, Λ(po)2,…, Λ(po)8] (Fig. 3B).
Fig. 3A.
(A) Step 2 of MOTIF-EM (Fig. 1A), LRD or gradient histogram construction, mimicked in 2D. The principal direction (x-axis) of the reference frame of a grid point around po is first re-expressed in po's reference frame and then stored in the bin (of the gradient histogram) representing the direction closest to the re-expressed one. The magnitudes of the stored gradients in a bin are summed up to obtain a numerical value for each bin [reflected in the length of the directions in (c)].
Fig. 1C.
Outline of algorithm for computing local region descriptors (LRDs).
Fig. 3B.
(B) The local region around po can be divided into quadrants. LRDs, one from each quadrant, can be stacked together as a single vector to construct a more complex LRD.
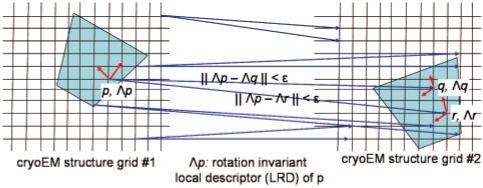
In Step 3 of Figure 1A (also see Fig. 4), for a LRD Λ1i in Λ(M1), MOTIF-EM finds k LRDs, Λ1i_closest={Λ2j1, Λ2j2,…, Λ2jk}, from Λ(M2) which are most similar (using the Euclidean metric) to Λ1i. That is, the grid points {p2j1, p2j2,…, p2jk} in M2 are ‘locally similar’ to p1i in M1. Hence at p1i, we get k match pairs: {m(p1i, p2j1), m(p1i, p2j2),…, m(p1i, p2jk)}. There may be false positives in Λ1i_closest, as computation of local reference frames are noisy and Λ is a dimensionally reduced description (resulting in loss of information) of a local 3D region. The interfering false positives will be removed at the end, in Step 6.
Fig. 4.
Step 3 of MOTIF-EM (Fig. 1A), mimicked in 2D. For a given grid point p in input cryoEM grid 1, locally similar grid points are found in the input cryoEM grid 2 by comparing the LRD at p with LRDs in grid 2.
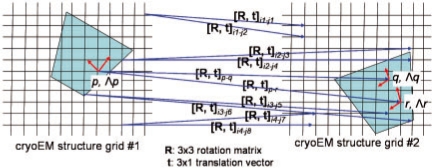
In Step 4 of Figure 1A (also see Fig. 5), MOTIF-EM has k match pairs for each grid point in M1. Hence, n grid points in M1 results in n*k match pairs. For a given match pair m(p1a, p2b), let T(p1a, p2b) be the 4 × 4 spatial rigid body transformation matrix that transforms p1a onto p2b and O(p1a) onto O(p2b). Let 6DOF be the six degrees-of-freedom that parameterizes T. T and 6DOF are computed by the function ‘find_dof’ as described in Craig (2005: Chapter 2) and Horn (1987).
Fig. 5.
Step 4 of MOTIF-EM (Fig. 1A), mimicked in 2D. For a given match, there exists a spatial rotation R and a spatial translation t, that transforms the match pair onto each other.
In Step 5 of Figure 1A (also see Fig. 6), MOTIF-EM clusters the n*k match pairs found in Step 3 of Figure 1A. The distance between two match pairs m(p1a, p2b) and m(p1c, p2d) is defined as the distance between 6DOF(p1a, p2b) and 6DOF(p1c, p2d). Suppose D is a domain/sub−region that is rigidly conserved in M1 and M2 and appears in them as D1 and D2, respectively. Then all the points in D1 will map onto corresponding points in D2 using same T and hence same 6DOF. Hence a cluster corresponds to a potential rigidly conserved domain between M1 and M2, as all the matches in a cluster would have approximately same 6DOF and hence T. Let C be a prominent cluster found during clustering and contains D. C is a collection M(C): {m1, m2, m3,…}, where mi is a match pair (p1a, p2b). Since computation of T is usually noisy, all the match pairs in C may not correspond to D.
Fig. 6.
Step 5 of MOTIF-EM (Fig. 1A), mimicked in 2D. The match pairs obtained from Step 4 of MOTIF-EM are clustered in the [rotation x translation] space.
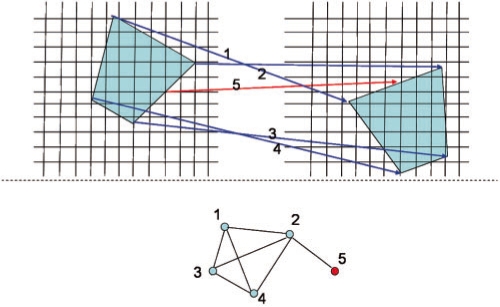
MOTIF-EM uses another step, Step 6 of Figure 1A (also see Fig. 7), to remove the false positives in C, i.e. those match pairs that do not correspond to D. For a domain/sub-region D to be rigidly conserved as D1 and D2 in M1 and M2, respectively, inter-point distances in D have to be conserved both in D1 and D2. To use this property, we construct a graph G, corresponding to C, such that a node ni in the graph is a match pair mi from M(C). Suppose the nodes ni and nj correspond to match pairs m(p1i1, p2i2) and m(p1j1, p2j2), respectively. An edge occurs between ni and nj, if the distance between the p1i1 and p1j1 is the same as that between p2i2 and p2j2, within a small threshold—let us call this construction C1. Having defined G like this, MOTIF-EM extracts large cliques from G using graph methods described in Abu-Khzam et al. (2005). A clique corresponds to a maximal sub-graph S(G) in G, such that there is an edge between every pair of nodes in S(G)– – –let us call this axiom A1. Since the nodes of G corresponds to M(C), S(G) corresponds to a subset of M(C), which we call SM(C): {mi1, mi2,…}, where mj:(p1aj, p2bj). Hence the match pairs in SM(C) define a set of grid points S1: {p1a1, p1a2,…} in M1 and a corresponding set of grid points S2: {p2b1, p2b2,…} in M2, such that the inter-point distances are preserved between S1 and S2, i.e. distance[S1(i), S1(j)]–distance[S2(i), S2(j)]. This follows from the construction C1 and the axiom A1, just laid. This is partially illustrated in Figure 7. The grid point sets S1 and S2 are reported as identified conserved domain/sub-region pair by MOTIF-EM.
Fig. 7.
Step 6 of MOTIF-EM (Fig. 1A), mimicked in 2D. A graph is constructed such that match pairs are nodes. An edge between two nodes indicates that the distance between the corresponding two grid points is preserved between the two maps. A clique in the graph (formed by blue nodes) is a collection of grid points whose inter-point distances are preserved between the maps.
The computational complexity of the MOTIF-EM algorithm will be discussed in the extended version of this article.
4 RESULTS
Now we report the outcome of applying MOTIF-EM on some instances of P. MOTIF-EM was run on a 2.33 GHz, 512 CPU cluster, located at Stanford University (http://biox2.stanford.edu). MOTIF-EM took upto 60 min on the cluster to generate the outcomes. The same implementation of MOTIF-EM is available for download and use at: http://ai.stanford.edu/∼mitul/motifEM. The images of structures shown were generated using UCSF Chimera package (Pettersen et al., 2004) from the Resource for Biocomputation, Visualization and Informatics at the University of California, San Francisco (for cryoEM maps, surface representation was used).
4.1 A simulated case
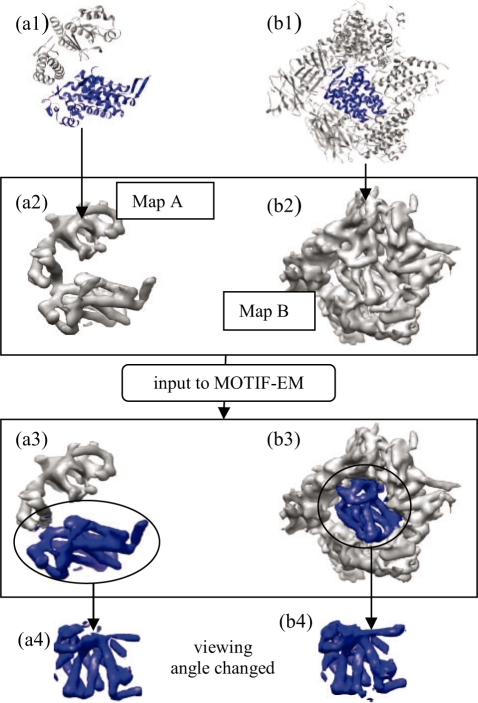
First, in this section, we verify the sanity of MOTIF-EM on a simulated testcase. We create two synthetic cryoEM maps A and B. Map A is simulated from an ‘open’ conformation GroEL atomic coordinates (PDB id: 1oel) containing a domain called ‘equatorial’. Map B is simulated by arbitrarily placing a part of the same GroEL equatorial domain in a protein environment [Fig. 8(b1 and b2)]. MOTIF-EM is used to compare A and B and extract the part of GroEL equatorial domain co-occurring in them. This is done in two rounds of tests (or two varying conditions).
Fig. 8.
(a1 and b1) are the high-resolution models (blue region is equatorial domain) used to generate synthetic cryoEM maps (a2 and b2), respectively. (a3 and b3): regions in (a2 and b2) detected by MOTIF-EM as conserved colored as blue. (a4 and b4): the blue regions isolated and viewed from angles which make their similarity evident.
Testing under varying map resolution: In the first round of tests, four sets of cryoEM map pair A and B are synthesized, evenly in the resolution range 5–20 Å (Table 1, column 1). The size or spatial volume occupied by the atomic resolution equatorial domain, included while generating A and B, was kept constant at v0. MOTIF-EM is applied to each set of the map pair to extract the part of equatorial domain co-occurring in them. As seen in Table 1, second column, in all five cases, MOTIF-EM successfully determined the geometric locations of the co-occurring equatorial domain with error below 1%. The blue regions in Fig. 8(a3/a4 and b3/b4) are the co-occurring equatorial regions, as detected by MOTIF-EM, in the 10 Å maps A and B, respectively. Also, the third column in Table 1, reports the relative size (v/v0 × 100) of the equatorial map region (size or spatial volume: v) co-occurring in maps A and B, retrieved by MOTIF-EM [i.e. ratio of blue regions in Fig. 8(a3 and a1)]. We see in Table 1, that the relative size of the extracted conserved region pair is in the range 93–56%, as the resolution of the map pair is varied from 5 to 20 Å. The shrinking size of the extracted conserved region pair is not the inability of MOTIF-EM, but is due to the fact that more and more structural information is lost, especially near domain boundary, as the map resolution worsens. As noted in (Lasker et al., 2007), one expects domains and assembly components less likely to be detected as the resolution of a cryoEM map approaches 15 Å.
Table 1.
Error in predicted transformation (column 2) and percentage size (column 3) of conserved domain extracted by MOTIF-EM from a simulated map, as the map resolution is varied from 5 to 20 Å (column 1)
| Map resolution | Predicted transformation error (%) | Extracted domain size (%) |
|---|---|---|
| 5 | <1 | 93 |
| 10 | <1 | 83 |
| 15 | <1 | 60 |
| 20 | <1 | 56 |
Testing under varying conserved domain size: In the second round of tests, four sets of cryoEM map pair A and B are synthesized such that the size or spatial volume occupied by the high-resolution equatorial domain [blue regions in Fig. 8(a1 and b1)], included while generating A and B, was reduced from v02 = v0 to v02 = 0.25v0 (Table 2, column 1). The resolution of the maps was kept fixed at 10 Å. Again, MOTIF-EM is applied to each set of the map pair. Here also, as seen in Table 2, second column, in all five cases, MOTIF-EM successfully determined the geometric locations of the co-occurring equatorial domain portion with error below 1%. The 3rd column in Table 2, reports the relative size (100 × v/v02) of the conserved sub-region (size or spatial volume: v) or the equatorial map region co-occurring in maps A and B, extracted by MOTIF-EM, for each set. We see in Table 2, that the size of the extracted conserved domain pair is reduced from 83 to 45%, as the size v0 of the common equatorial domain used in the simulated maps is reduced from 100 to 25%. Again this is expected, as noted in (Lasker et al., 2007)—as the size of a conserved structural regions decreases it becomes harder to detect it. For example, smaller entities like alpha-helices are reasonably detectable in maps only upto 10 Å resolution.
Table 2.
Error in predicted transformation (column 2) and percentage size of conserved domain (column 3) extracted by MOTIF-EM from a simulated map, as the domain size in the map is reduced from 100 to 25% (column 1)
| Equatorial domain size (%) | Error in predicted Transformation (%) | Extracted domain size (%) |
|---|---|---|
| 100 | <1 | 83 |
| 75 | <1 | 68 |
| 50 | <1 | 58 |
| 25 | <1 | 45 |
4.2 Applying MOTIF-EM to real data
4.2.1 Conformation change in ribosome 70S
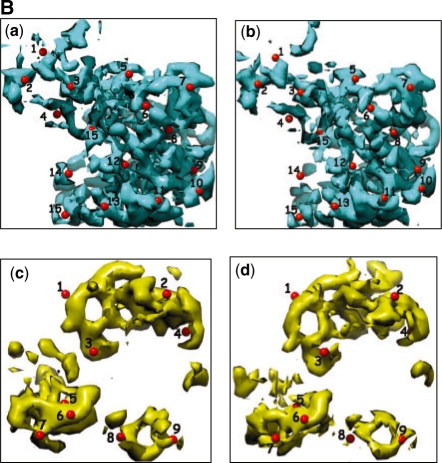
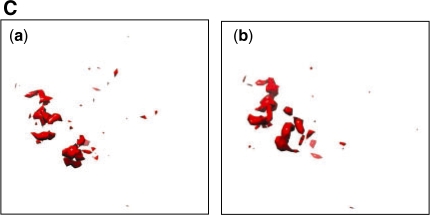
We used MOTIF-EM to compare a pair of cryoEM maps [(http://www.ebi.ac.uk/pdbe-srv/emsearch/) EMD ids: 1362 and 1363], corresponding to the pre- and post- translocational states, respectively, of ribosome 70S (Fig. 9Aa and b). MOTIF-EM yielded two distinct conserved domain pairs between them, as shown in Fig. 9Ac and d and B. The remnant non-conserved regions are shown in red in Fig. 9Ac and d and C. The two domains when compared with the data in Valle et al. (2003) turned out to be predominantly the 30S and 50S subunits of 70S ribosome. Valle et al. (2003) also indicates that the remnant non-conserved region is likely to be marked by activities such as EF-G binding and tRNA locomotion. We measured the relative positions of extracted domains, corresponding to 30S and 50S subunits, in the two conformations and verified the ratchet like motion reported in Valle et al. (2003). The animation in http://ai.stanford.edu/∼mitul/motifEM/rna_anim.gif depicts this ratchet like motion of the two subunits in 70S, upon conformation change, deduced by MOTIF-EM.
We validate these results from MOTIF-EM in the following ways:
Visual inspection using markers: Figure 9Ba and b show the correspondences (numbered red balls) established by MOTIF-EM between the first extracted domain pair. Likewise, Figure 9Bc and d correspond to the second extracted domain pair. The correspondences are reasonably located.
Both the extracted domain pairs, when aligned, have high map density cross-correlation values of 0.92 and 0.91, respectively.
The geometric transformation yielded by MOTIF-EM that aligns the extracted domain pair has been confirmed by realigning the extracted domains using FOLDHUNTER (Jiang et al., 2001) (an existing software to dock a cryoEM submap into another map).
The plasticity of the remnant map regions [shown as red in Fig. 9Ac and d] is best justified by visual inspection. This is partly evident by looking at Figure 9C.
Fig. 9B.
(Magnified compared to Fig. 9A). (Ba and Bb) The first pair of conserved domain extracted from the input map pair by MOTIF-EM. As per (Valle et al., 2003), this is predominantly the 30S subunit of the 70S ribosome. (Bc and Bd): The second pair of conserved domain extracted from the input map pair by MOTIF-EM. As per (Valle et al., 2003), this is predominantly the 50S subunit of the 70S ribosome.
Fig. 9C.
The remnant un-conserved region in the two input maps shown in Figure 9Aa and b. This is effectively Figure 9Ac and d, with conserved parts (yellow and blue regions) deleted. This un-conserved region could either be an interesting activity site or just noise in the input maps.
The detection of the two conserved regions and the remnant non-conserved region in the two 70S conformations in the work of Valle et al. (2003) required significant manual intervention. Such as, first appropriate structural homologs from some database (such as SCOP) were searched. Then these homologs were docked into the cryoEM maps using semi-automated means. However, as we saw in this section, MOTIF-EM is able to detect the conserved and non-conserved regions in an automated fashion.
4.2.2 Model building using MOTIF-EM
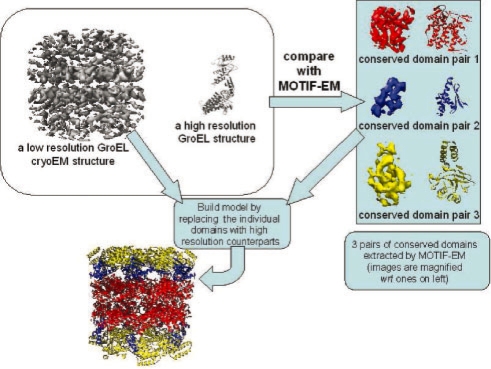
Next we show the potential of MOTIF-EM to build Cα backbone models for cryoEM maps in special cases. We demonstrate this by doing model building for the GroEL cryoEM 6 Å map (Ludtke et al., 2004). The map and the Cα backbone structure of a closed conformation GroEL ring (PDB ID: 1aon) were compared using MOTIF-EM (Fig. 10, left, top block). This yielded the three conserved domain pairs (Fig. 10, right block), between the two input structures, corresponding to the known equatorial, intermediate and apical domain demarcations in GroEL. MOTIF-EM also gives relative geometric rigid body transformation matrices needed to dock/fit the extracted conserved domains from the Cα backbone structure into the cryoEM map. Based on these transformation matrices and the D7 symmetry of the GroEL 6 Å cryoEM map, a Cα backbone model corresponding to the map was assembled and is shown in Figure 10 (left bottom).
Fig. 10.
Model building. The open conformation GroEL cryoEM map and a closed conformation GroEL high-resolution model (top, left block) were compared using MOTIF-EM to yield three pairs of conserved domains (top, right block; images are magnified wrt left block ones). The conserved domains in the GroEL cryoEM map were replaced with corresponding conserved domains in the high-resolution model, to yield a high-resolution model for the GroEL cryoEM map (left, bottom).
The assembled model is in reasonable agreement with a model obtained by individually docking three pre-demarcated GroEL domains using SITUS (Wriggers and Birmanns, 2001) and Chimera's (Pettersen et al., 2004) model fitting tool (for the intermediate domain, initial guess was required).
The advantage of MOTIF-EM against any other docking-based model building software, such as SITUS (Wriggers and Birmanns, 2001), etc., is that one does not have to demarcate the input atomic structure, i.e. specify domain boundaries (or refer to curated SCOP domain bank). MOTIF-EM automatically crops out the domains from the input atomic structure that need to be fitted in the input map.
4.2.3 Structural comparsion of maps with little sequence similarity
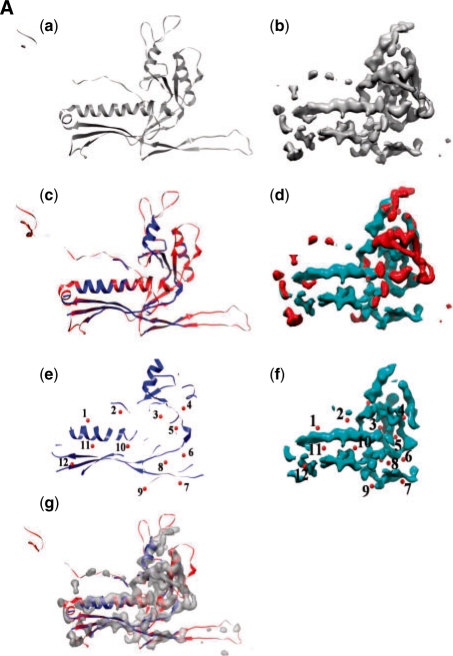
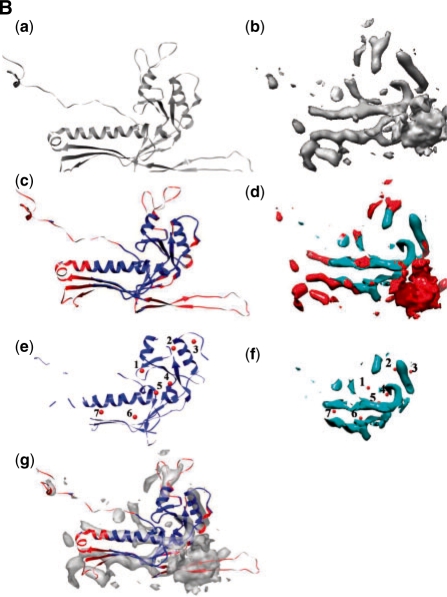
In this demonstration, we use MOTIF-EM to identify the conserved shared folds among dsDNA bacteriophages HK97, Epsilon 15 and Phi 29. The fold similarity between them is also evident by visual inspection [(a and b) of Fig. 11A and B]. Here, MOTIF-EM is used to confirm and precisely quantify it. For HK97 an atomic resolution structure is available (PDB id: hk97). For Epsilon 15 and Phi 29, cryoEM maps at 4.5 and 7.9 Å, respectively, are available. There is no evident sequence similarity among HK97, Epsilon 15 and Phi 29 (Jiang et al., 2008; Morais et al., 2005). In the first trial, a monomer each from HK97 and Epsilon 15 (Fig. 11Aa and b) were given as input to MOTIF-EM. MOTIF-EM extracted the conserved fold between the input monomer pair as shown in Figure 11Ae and f (also the non-red region in Figure 11Ac and d). Sixty percent of the HK97 backbone is conserved. In the second trial, a monomer each from HK97 and Phi29 (Fig. 11Ba and b) were given as input to MOTIF-EM. In this case also, MOTIF-EM extracted the conserved fold between the input monomer pair as shown in Figure 11Be and f (also the non-red region in Fig. 11Bc and d). Sixty-four percent of the HK97 backbone is conserved.
Fig. 11A.
(Aa and Ab) Monomers from bacteriophages HK97 and Epsilon 15, respectively. (Ac and Ad) The conserved region between the monomers [shown in (Aa and Ab)] is shown as blue, as determined by MOTIF-EM. The rest of the region is shown as red. (Ae and Af) Here only the conserved region [colored as blue in (Ac and Ad)] is shown. Correspondences (numbered red balls), determined by MOTIF-EM, are shown. (Ag) Alignment of the conserved (blue cartoon) and non-conserved (red cartoon) parts of HK97, as determined by MOTIF-EM, with the Epsilon 15 map.
Fig. 11B.
(Ba and Bb) Monomers from bacteriophages HK97 and Phi29, respectively, and (Bc and Bd) the conserved region between the monomers [shown in (Ba and Bb)] is shown as blue, as determined by MOTIF-EM. The rest of the region is shown as red. (Be and Bf) Here only the conserved region [colored as blue in (Bc and Bd)] is shown. Correspondences (numbered red balls), determined by MOTIF-EM, are shown. (Bg) Alignment of the conserved (blue cartoon) and non-conserved (red cartoon) parts of HK97, as determined by MOTIF-EM, with the Phi29 map.
These conserved folds extracted from bacteriophages HK97, Epsilon 15 and Phi 29 confirm the high structural similarity between the phages, even with no evident sequence similarity between them, suggesting the possibility of a common ancestor between them (Jiang et al., 2006; Morais et al., 2005).
We evaluate these results from MOTIF-EM in the following way. Since the resolution of the Epsilon 15 map is reasonably high, the evaluation is best done by visual inspection. As seen in Figure 11Ag, the conserved part (blue cartoon) of HK97, as determined by MOTIF-EM, is contained very well in the map density of Epsilon 15, while the non-conserved (red cartoon) part usually protrudes out of the density. This is further supported by fitting scores from Chimera (Pettersen et al., 2004): the conserved part has a fitting score of 43.1, much higher than 16.7: that of non-conserved part. We also use markers (numbered red balls in Fig. 11Ae and f) to show the visually convincing correspondences between the HK97 and Epsilon 15 structures, established by MOTIF-EM. Likewise, the correspondences between Phi29 and HK97, obtained by MOTIF-EM, are shown in Fig. 11Be and f. Figure 11Bg shows the alignment of the conserved (blue cartoon) and non-conserved (red cartoon) parts of HK97, as determined by MOTIF-EM, with the Phi29 map. As seen, the conserved part fits the map much better than the non-conserved parts of HK97. This is also supported by fitting scores from Chimera (Pettersen et al., 2004): the conserved part has a fitting score of 0.80, much higher than 0.49: that of non-conserved part.
5 CONCLUSION
We have described a new, first-of-its kind, computational tool MOTIF-EM that can identify structural motifs or domains that are conserved between a pair of cryoEM maps. As a by-product, regions that are not conserved are also revealed. Such a tool is useful as conserved structural entities can point to conserved active sites—indicating common function, evolutionary links and drug binding targets for therapies. The non-conserved regions, revealed as by-product, can point to local molecular flexibility related to biological activity. Apart from breaking an input map pair into conserved and non-conserved regions, MOTIF-EM can (i) dock existing atomic-resolution domains into cryo-EM maps, (ii) propose atomic resolution models for some cryoEM maps, and (iii) compare maps with conserved structures but little sequence similarity.
The distinct advantage of using MOTIF-EM is that it enables the users to directly and automatically compare and analyze two cryoEM structures. Otherwise, the conventional way has been indirect comparison, via docked structural homologs or backbone traced models (both not always available), which can introduce errors from imperfect docking and modeling into the structural analysis. Overall, this required significant manual intervention.
In the future we would like to do structure comparisons using MOTIF-EM on a much larger scale. Such as, comparing a given cryoEM map with all the available structures in various databanks (such as, EBI cryoEM and PDB databanks) and detecting previously unknown links between the cryoEM map and all other known structures.
ACKNOWLEDGEMENTS
This research has benefited from discussions with Gunnar Schröder, Marc Morais, Matthew Baker, Yao Cong, Steve Ludtke, Donghua Chen, Xiangan Liu, David Woolford and Junjie Zhang.
Funding: NIH Roadmap for Medical Research (U54 GM072970), Nanomedicine Development Center (PN1EY016525) and Biomedical Technology Center (P41RR02250).
Conflict of Interest: none declared.
REFERENCES
- Abu-Khzam FN, et al. Proceedings of International Conference on Research Trends in Science and Technology. Lebanon: Beirut; 2005. On the relative efficiency of maximal clique enumeration algorithms, with applications to high-throughput computational biology. [Google Scholar]
- Baker ML, et al. Identification of secondary structure elements in intermediate resolution density maps. Structure. 2007;15:7–19. doi: 10.1016/j.str.2006.11.008. [DOI] [PMC free article] [PubMed] [Google Scholar]
- Ceulemans H, Russell RB. Fast fitting of atomic structures to low-resolution electron density maps by surface overlap maximization. J. Mol. Biol. 2004;338:783–793. doi: 10.1016/j.jmb.2004.02.066. [DOI] [PubMed] [Google Scholar]
- Chiu W, et al. Structural biology of cellular machines. Trends Cell Biol. 2006;16:144–150. doi: 10.1016/j.tcb.2006.01.002. [DOI] [PubMed] [Google Scholar]
- Craig JJ. Introduction to Robotics. 3rd. Pearson Prentice Hall; 2005. [Google Scholar]
- Horn B.KP. Closed-form solution of absolute orientation using unit quaternions. J. Optical Soc. Amer. A. 1987;4:629–642. [Google Scholar]
- Jiang W, Ludtke SJ. Electron cryomicroscopy of single particles at subnanometer resolution. Curr. Opin. Struct. Biol. 2005;15:571–577. doi: 10.1016/j.sbi.2005.08.004. [DOI] [PubMed] [Google Scholar]
- Jiang W, et al. Bridging the information gap: computational tools for intermediate resolution structure interpretation. J. Mol. Biol. 2001;208:1033–1044. doi: 10.1006/jmbi.2001.4633. [DOI] [PubMed] [Google Scholar]
- Jiang W, et al. Structure of epsilon15 phage reveals organization of genome and DNA packaging/injection apparatus. Nature. 2006;439:612–616. doi: 10.1038/nature04487. [DOI] [PMC free article] [PubMed] [Google Scholar]
- Jiang W, et al. Backbone structure of the infectious ε 15 virus capsid revealed by electron cryomicroscopy. Nature. 2008;451:1029–1138. doi: 10.1038/nature06665. [DOI] [PubMed] [Google Scholar]
- Lasker K, et al. Discovery of protein substructures in EM maps. WABI. 2005:423–434. [Google Scholar]
- Lasker K, et al. EMatch: discovery of high resolution structural homologues of protein domains in intermediate resolution Cryo-EM maps. IEEE Trans. CBB. 2007;4:28–39. doi: 10.1109/TCBB.2007.1003. [DOI] [PubMed] [Google Scholar]
- Lowe DG. Distinctive image features from scale-invariant keypoints. IJCV. 2004;60:91–110. [Google Scholar]
- Ludtke S, et al. Seeing GroEL at 6 Å resolution by single particle electron cryomicroscopy. Structure. 2004;12:1129–1136. doi: 10.1016/j.str.2004.05.006. [DOI] [PubMed] [Google Scholar]
- Ludtke SJ, et al. EMAN: semiautomated software for high-resolution single-particle reconstructions. J. Struct. Biol. 1999;128:82–97. doi: 10.1006/jsbi.1999.4174. [DOI] [PubMed] [Google Scholar]
- Ludtke SJ, et al. De novo backbone trace of GroEL from single particle electron cryomicroscopy. Structure. 2008;6:441–448. doi: 10.1016/j.str.2008.02.007. [DOI] [PubMed] [Google Scholar]
- Morais MC, et al. Conservation of the capsid structure in tailed dsDNA bacteriophages: the psuedoatomic structure of ô29. Mol. Cell. 2005;18:149–159. doi: 10.1016/j.molcel.2005.03.013. [DOI] [PubMed] [Google Scholar]
- Pettersen EF, et al. UCSF Chimera—a visualization system for exploratory research and analysis. J. Comp. Chem. 2004;25:1605–1612. doi: 10.1002/jcc.20084. [DOI] [PubMed] [Google Scholar]
- Roseman AM. Docking structures of domains into maps from cryo-electron microscopy using local correlation. Acta Crystallogr. 2000;D56:1332–1340. doi: 10.1107/s0907444900010908. [DOI] [PubMed] [Google Scholar]
- Rossmann MG, et al. Combining electron microscopic with X-ray crystallographic structures. J. Struct. Biol. 2001;136:190–200. doi: 10.1006/jsbi.2002.4435. [DOI] [PubMed] [Google Scholar]
- Tama F, Miyashita O. Normal node based flexible fitting of high-resolution structure into low-resolution experimental data from Cryo-EM. J. Struct Biol. 2004;147:315–326. doi: 10.1016/j.jsb.2004.03.002. [DOI] [PubMed] [Google Scholar]
- Topf M, et al. Structural characterization of components of protein assemblies by comparative modeling and electron cryo-microscopy. J. Struct. Biol. 2005;149:191–203. doi: 10.1016/j.jsb.2004.11.004. [DOI] [PubMed] [Google Scholar]
- Valle M, et al. Locking and unlocking of ribosomal motions. Cell. 2003;114:123–134. doi: 10.1016/s0092-8674(03)00476-8. [DOI] [PubMed] [Google Scholar]
- Volkmann N, Hanein D. Docking of atomic models into reconstruction from electron microscopy. Methods Enzymol. 2003;374:204–225. doi: 10.1016/S0076-6879(03)74010-5. [DOI] [PubMed] [Google Scholar]
- Wriggers W, Birmanns S. Using situs for flexible and rigid-body fitting of multiresolution single-molecule data. J. Struct. Biol. 2001;133:193–202. doi: 10.1006/jsbi.2000.4350. [DOI] [PubMed] [Google Scholar]
- Yu Z, Bajaj C. Computational approaches for automatic structural analysis of large bio-molecular complexes. IEEE CBB. 2007;5:568–582. doi: 10.1109/TCBB.2007.70226. [DOI] [PubMed] [Google Scholar]
- Zhang J, et al. JADAS: a customizable automated data acquisition system and its application to ice-embedded single particles. J. Struct. Biol. 2009;165:1–9. doi: 10.1016/j.jsb.2008.09.006. [DOI] [PMC free article] [PubMed] [Google Scholar]


