

Abstract
Motivation: Genetic interactions between genes reflect functional relationships caused by a wide range of molecular mechanisms. Large-scale genetic interaction assays lead to a wealth of information about the functional relations between genes. However, the vast number of observed interactions, along with experimental noise, makes the interpretation of such assays a major challenge.
Results: Here, we introduce a computational approach to organize genetic interactions and show that the bulk of observed interactions can be organized in a hierarchy of modules. Revealing this organization enables insights into the function of cellular machineries and highlights global properties of interaction maps. To gain further insight into the nature of these interactions, we integrated data from genetic screens under a wide range of conditions to reveal that more than a third of observed aggravating (i.e. synthetic sick/lethal) interactions are unidirectional, where one gene can buffer the effects of perturbing another gene but not vice versa. Furthermore, most modules of genes that have multiple aggravating interactions were found to be involved in such unidirectional interactions. We demonstrate that the identification of external stimuli that mimic the effect of specific gene knockouts provides insights into the role of individual modules in maintaining cellular integrity.
Availability: We designed a freely accessible web tool that includes all our findings, and is specifically intended to allow effective browsing of our results (http://compbio.cs.huji.ac.il/GIAnalysis).
Contact: maya.schuldiner@weizmann.ac.il; hanahm@ekmd.huji.ac.il; nir@cs.huji.ac.il
Supplementary information: Supplementary data are available at Bioinformatics online.
1 INTRODUCTION
A major goal in biology is to understand how thousands of genes act together to create a functional cellular environment. An emerging powerful strategy for investigating functional relations between genes involves high-throughput genetic interaction maps (Butland et al., 2008; Byrne et al., 2007; Collins et al., 2007a; Fiedler et al., 2009; Makhnevych et al., 2009; Pan et al., 2006; Roguev et al., 2008; Schuldiner et al., 2005; Segrè et al., 2005; Tong et al., 2001; Wilmes et al., 2008), which measure the extent by which a mutation in one gene modifies the phenotype of a mutation in another. The interactions in these maps can be divided to alleviating interactions, where the defect of the double mutant is less than expected from two independent effects, and aggravating interactions, where the defect of the double mutant is greater than expected from the single-gene perturbations. Such systematic mapping typically uncovers a large number of observed genetic interactions, which confounds straightforward interpretation. Despite the large number of published maps, a systematic methodology for extracting biological insights remains a major challenge.
Previous analyses of genetic interaction data have primarily focused on hierarchical clustering, resulting in many new discoveries in key cellular processes (Collins et al., 2007a; Pan et al., 2006; Schuldiner et al., 2005). Nonetheless, hierarchical clustering has two major drawbacks: first, the similarity score between genes is based on their entire interaction profile (with all other genes) allowing large fraction of background interactions to dominate the similarity. Second, it does not directly extract meaningful groups of genes or interactions between such groups, preventing a system-level view of the interaction map. Both challenges were addressed by several methods. For example, the PRISM algorithm (Segrè et al., 2005) uses monochromatic interactions (i.e. solely aggravating or solely alleviating) within and between groups of genes to define pathways (Fig. 1A). However, this algorithm, which was evaluated on simulated interaction maps, fails on actual data from large-scale maps due to the added complexity in real cellular systems and assay noise (data not shown). Biclustering is another approach that was suggested as an alternative to hierarchical clustering, aiming to identify local signatures of functional modules in the genetic interaction maps (Pu et al., 2008). While this approach identifies many modules of genes, it does not eliminate their overlap, hampering the generation of one coherent network structure describing both the intra- and inter-modular interactions. One possible way to overcome these drawbacks is by adding different types of data or additional constraints. For example, methods that combine physical protein–protein interactions in the analysis of genetic interaction data identify functional modules with high precision (Bandyopadhyay et al., 2008; Kelley and Ideker, 2005; Ulitsky et al., 2008). However, the requirement for physical interaction data limits such approaches to protein sets and organisms where such data exist, and may miss many functional pathways that are not mediated by protein complexes (e.g. metabolic pathways).
Fig. 1.

Modularity of genetic interactions. (A) Pathway architecture (left) leads to expected patterns of genetic interactions between genes (right). Each row/column represents the genetic interactions of a specific gene with all other genes. Among these there are subsets of interactions that can be represented as monochromatic cliques and bicliques. (B) Monochromatic interactions can be captured by edges within and between modules (grey boxes) organized in a hierarchical structure.
Here, we introduce an automated approach that builds a concise representation of large-scale genetic interaction maps. Toward this goal, we relied on previous observations that complexes and pathways induce signatures in the form of monochromatic cliques and bi-cliques (Fig. 1A; Beyer et al., 2007; Boone et al., 2007; Segrè et al., 2005). Our method seeks to find an organization that is globally coherent, in the sense that genes are organized into a hierarchy of modules. Moreover, our method requires that the interactions between these modules will account for a large portion of the data. We show how the resulting representation facilitates better understanding of the underlying cellular phenomena. In turn, we use these insights to shed light on the function of concrete cellular pathways and also to provide information on the overall organization of the network. We demonstrate how integration of data from genetic screens for reduced fitness under various conditions results in automatic creation of biological insights into the functional role of gene modules.
2 HIERARCHY OF INTERACTING MODULES
Our basic premise is that a good hierarchical organization is defined by a trade-off between succinct description of the network on one hand, and capturing as much of the interactions in the map on the other hand. To capture this quality, we devised a score based on the minimum description length (MDL) principle (Rissanen, 1983) and devised an iterative procedure that optimizes this score.
2.1 Hierarchical representation
The hierarchical representation consists of two parts. The first is a hierarchy of modules. Briefly, a hierarchy is a set ℳ of modules, such that each module m is associated with a subset of genes Genes(m) and a parent module Parent(m)∈ℳ∪{ϵ}, where ϵ represents a null module (i.e. the module is a root). We say that a module m′ is an ancestor of m if m′ = Parentk(m) for some k≥1. The hierarchy is legal if for every m, m′∈ℳ such that m′ = Parent(m), we have that Genes(m)⊂Genes(m′), and moreover Genes(m)∩Genes(m′)≠∅ if and only if m is an ancestor of m′ or vice versa. In the hierarchy of Figure 1B, we have four modules, so that Genes(m1)={G1, G2, G3}, Genes(m2)={G5, G6}, Genes(m3)={G4, G5, G6}, and Genes(m4)={G7, G8}. In this example, Parent(m1) = Parent(m3) = Parent(m4) = ϵ, and Parent(m2) = m3.
The second component of the hierarchy describes a set ℰ of edges between modules. An edge can be of two types, alleviating (denoted in yellow in our figures) or aggravating (denoted in blue). Each edge represents a type of genetic interactions that is common for the members of the modules linked by the edge. Formally, an edge m1 ↔ m2, represent the set Int(m1 ↔ m2)=Genes(m1)×Genes(m2) of genetic interactions. Edges in the hierarchy can be self-edges, in which case they induce a clique of interactions, or between two different modules in which case they induce a bi-clique of interactions. In the example of Figure 1B, we have the alleviating edges m1 ↔ m1, m3 ↔ m3, m4 ↔ m4, and the aggravating edges m1 ↔ m3 and m2 ↔ m4. These edges represent the interactions described in the interaction matrix of Figure 1A.
2.2 Minimal description length score
We use the MDL principle (Rissanen, 1983) to score the quality of module hierarchy as a guide for lossless encoding of the genetic interaction map. Conceptually, imagine that we need to transmit the genetic interaction map over a channel and search for the encoding that would require the fewest bits. Under this principle, the length of the transmission is a proxy for the quality of the representation, with a shorter encoding denoting a better representation.
The application of this principle involves deciding how we encode the interactions in the map. When we do not have any organization of the map, we use the same codebook for each interaction. Since weak interactions are much more abundant than strong ones, their code words will be shorter (Cover and Thomas, 2001). Thus, we will incur a penalty for strong interactions. When we have a module hierarchy, we can use a different codebook for each edge in the hierarchy and an additional codebook for background interactions. This allows us to exploit a group of monochromatic interactions for efficient encoding by a codebook that assigns strong interactions of the appropriate short codewords. The benefit from covering a large portion of the map with coherent edges is offset by the cost of transmitting the codebooks themselves, which involves coding the hierarchical organization and the edges with their signs. Thus, when evaluating a possible organization of the genetic interaction map there is a trade-off between the coverage of interactions and the number of modules and edges.
Formally, if we denote the genetic interaction map by D and the hierarchical organization by (ℳ, ℰ) then the MDL score consists of two main terms:
where DL(ℳ, ℰ) is the description length of the hierarchical organization and DL(D|ℳ, ℰ) is the description length of the interactions, given that we already encoded the hierarchy. We start with the first term, DL(ℳ, ℰ). Here, we need to encode the module hierarchy (which module is the parent of each module), the assignment of genes to modules and the list of edges. This is a relatively straightforward encoding using standard MDL practices.
The second term represents how to describe the genetic interaction map once we know the modular organization. Standard results in information theory (Cover and Thomas, 2001) show that if the frequency of each word is p(w), then the optimal codebook is one where encoding a word w is of length −log2p(w). Thus, in each codebook we use the distribution of the strengths of interactions covered by an edge to build an efficient codebook. We assume that the different values are distributed according to a Gaussian distribution. Thus, the encoding length is the minus log-probability (or likelihood) of the data given the parameters of each Gaussian codebook (i.e. the closer the distribution is to its parametric description, the score is higher). To this length, we add the number of bits needed to encode the parameters of each distribution. To calculate the encoding length, for each edge e∈ℰ we estimate the maximum likelihood parameters, (μe, σe). In addition, we estimate the background distribution (μb, σb). We then define
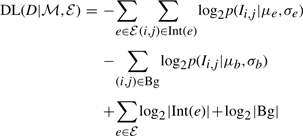 |
where p(Ii,j|μ, σ) is the likelihood of the genetic interaction score Ii,j according to the Gaussian N(μ, σ2), Bg is the set of interactions that do not belong to any edge in ℰ, and log2(|Int(e)|) is the encoding length of the parameters for the edge. Thus, we score interactions in their specific context (either inside an edge or in the background).
For practical concerns, we restrict the network to include only coherent edges. Thus, we require that an edge satisfies |μe| − σe > α, where α is a strictness parameter (which we set to 1 in the results below). If this is not the case, the network receives a large penalty which effectively excludes it from consideration.
2.3 Constructing module hierarchy
Given a genetic interaction map D, we want to find the module hierarchy that minimizes the MDL score. This problem is non-trivial as the search space is huge. To address this we combine two ideas. First, we use hierarchical clustering to get a good initial guess for our hierarchical organization. Second, once we have a reasonable initial candidate, a heuristic search procedure can perform ‘local’ improvements to find a much better one. Our procedure implements these ideas by performing the following steps.
Clustering: we cluster the genetic interaction map using hierarchical clustering with uncentered Pearson correlation (Eisen et al., 1998). This results in a dendrogram, which in our terminology is a detailed hierarchy, where each internal node defines a group of genes that correspond to the leaves in its sub-tree and each pair of such internal nodes defines a rectangle in the clustered matrix (Fig. 2a).
Fig. 2.

Outline of our iterative algorithm. After clustering the interactions (left) our procedure identifies modules of genes in the clustering hierarchy that define monochromatic on-diagonal squares (e1) and off-diagonal rectangles (e2), resulting in a hierarchical organization of genes into modules (middle). Next, the module graph is refined by a series of local changes (e.g. moving one gene from m2 to m1; right). At the end of each iteration (bottom arrow), we re-cluster the genetic interaction matrix while maintaining the identified modules. These steps are iterated until convergence.
Identifying edges: treating the dendogram as an initial hierarchy of modules, the procedure traverses overall pairs of internal nodes in the dendrogram and in a greedy fashion adds modules and edges as long as they increase the MDL score. At this stage, we have a very large number of modules and some number of edges. We then prune modules that do not participate in edges (while maintaining the ancestral relationships between the remaining modules). This results in a hierarchy that summarizes the initial clustering (Fig. 2b).
Greedy improvements: to re-evaluate and refine the modular structure, the procedure performs a heuristic search by evaluating local changes to the modular organization. These local changes include: addition/removal of a gene to/from an existing module, merging a module with its parent, transferring an edge from a module to its parent (or vice-versa) and addition/removal of an edge. Each of these local changes is evaluated and based on their score the procedure decide which one to apply. We use a best-first-search heuristic combined with a TABU list (Glover et al., 1993) to avoid revisiting explored networks and thus escape local maxima. This search leads to a refined model (Fig. 2c).
Reiterations: to find structures that might elude local search steps, the procedure iterates by returning to the first step. In each re-iteration, we re-cluster the genetic interaction map while conserving the module hierarchy from the previous step. That is, we allow only agglomerative steps that do not break existing modules into separate subunits. This constraint forces the resulting clustering to maintain the found structure, but it can identify new sub-modules as well as new modules of genes that are not assigned to a module. These iterations are repeated until convergence (in score) (Fig. 2d).
2.4 Application to genetic interaction maps in Saccharomyces cerevisiae
We applied our methodology to two large-scale genetic interaction maps in the budding yeast S. cerevisiae. The first contains genes localized to the Early Secretory Pathway (ESP; Schuldiner et al., 2005) and the other comprises genes involved in Chromosome Biology (CB; Collins et al., 2007b). This procedure automatically constructed a hierarchical organization of modules in both: in the ESP map it identified 113 modules covering 264 genes (out of 424) and in the CB map it identified 242 modules covering 487 genes (out of 743). Most of these modules represent functionally coherent groups of genes (ESP: 76/113, CB: 193/242; Appendix A in the Supplementary website), such as physical complexes (e.g. Mediator subunits, HIR complex, SAS complex) and functional pathways (e.g.N-linked glycosylation, chromatid cohesion). Inter- and intra-module interactions correspond to a large fraction of the interactions in the original maps, particularly the high confidence ones (Fig. 3A and B). In addition, the edges we capture are also coherent in the sense that most interactions covered by alleviating edges have positive interaction scores and most interactions covered by aggravating edges have negative scores (Fig. 3C and D). Thus, the modular organization of the genetic interactions faithfully captures a large portion of these maps.
Fig. 3.

with coherence and coverage Edges capture most interactions. (A) Coverage of aggravating interactions by our network (y-axis) as a function of threshold for EMAP score (x-axis). Magenta solid lines and green dashed lines show results for CB and ESP networks, respectively. (B) Coverage of alleviating interactions. (C) Coherence of aggravating and alleviating edges in the CB network. Shown is a histogram (y-axis) of EMAP scores (x-axis) for interactions covered by aggravating and alleviating edges in blue and yellow, respectively. Histogram for the entire data is show in grey. (D) Coherence of edges in our ESP network.
The hierarchical nature of the network allows the definition of large modules with more general functions that contain sub-modules with more specific functions, which are distinguished by sets of unique interactions. For example, module ESP-98 comprises eight genes that take part in the maturation of glycoproteins within the ER lumen (Fig. 4). Specifically, these genes encode the sequential enzymes adding on sugar moieties to a synthesized polysaccharide chain. Our analysis identified two sub-modules that correspond to two distinct stages in this process: one module (ESP-97) involves genes encoding proteins that transfer mannose residues to the nascent chain, and the second module (ESP-96) involves genes that subsequently transfer glucose residues to the nascent chain (Helenius and Aebi, 2004). This division was obtained automatically, based on interactions that are specific to each of these sub-modules (Fig. 4). Notably, the protein products of genes in these two modules do not form physical complexes, and thus could not be identified by methods that use protein–protein interactions to define the modules. In addition, this subdivision was not obtained by solely applying hierarchical clustering methods (Schuldiner et al., 2005).
Fig. 4.

Hierarchical organization of modules represents functional hierarchy. (A) Modules are denoted by grey boxes (red labels denote functional assignment based on annotations; black labels denote the name of each module and in parentheses the number of genes included in it). Blue edges between modules indicate that these modules create aggravating bicliques. Module ESP-98 contains eight genes related to N-linked glycosylation. It is further divided into two sub-modules (ESP-96 and ESP-97), each identified by different interactions, which have more specific functions. (B) Schematic view of the N-linked glycosylation pathway (adapted from Helenius and Aebi, 2004). Inside the ER lumen, four mannose residues (green circles) are added to Man5GlcNAc2 by Alg3, Alg9 and Alg12 (comprising module ESP-97). In turn, three glucose residues (red triangles) are added by Alg5, Alg6, Alg8 and Alg10 (comprising module ESP-96).
2.5 Comparison to other methods
Comparing our method to previous methods for analysing genetic interaction maps is difficult due to the different focus of the various methods. A common theme to most methods is the determination of gene modules. Although this is only one aspect of our analysis, we compared our module list to modules found by other studies of the CB map (Bandyopadhyay et al., 2008; Pu et al., 2008; Ulitsky et al., 2008). Comparing to the methods of Bandyopadhyay et al. (2008) and Ulitsky et al. (2008, Fig. 5A and B), we find many more modules (242 modules compared with 91 and 62, respectively), covering more genes (487 genes compared with 374 and 313, respectively).1 In addition, many of these modules are not enriched with physical protein–protein interactions, yet have a coherent function. Furthermore, our approach is also applicable to other systems, in which the protein–protein interaction data is very sparse (such as in the ESP dataset) or in organisms in which it does not exist. When comparing our results to those of Pu et al. (2008) who finds 298 overlapping modules covering 181 genes, we see that we find similar numbers of modules organized in a global hierarchy and covering more genes. However, these advantages come at the price of lower precision (Fig. 5C). Yet, as the larger modules at the top of the hierarchy might correspond to more global functions, their enrichment in more general GO terms is reasonable. We conclude that each of the methods strikes a different trade off between precision, sensitivity and global coherence.
Fig. 5.

Comparison to other methods: bar charts showing how many genes (A) and interactions (B) are covered by each method. (C) Bar chart showing how many of the protein pairs that are in the same module share a GO function annotation, or physically interact with each other. GO annotations are divided into categories according to the number of genes in the annotation.
3 UNCOVERING UNIDIRECTIONAL COMPENSATION
Strikingly, a relatively large number of the gene pairs exhibit genetic interactions, especially aggravating ones. We find that aggravating interactions play a major role in the definition of many modules (e.g. 150 of the 242 modules in the CB network are defined solely based on aggravating interactions). Aggravating interactions are commonly interpreted as an indication of bidirectional compensation, where each gene can compensate for the absence of the other by performing a similar function. However, in many cases this explanation cannot account for the observed patterns of aggravating interactions and the large number of such interactions between genes with distantly related functions.
An alternative explanation (Boone et al., 2007; Pan et al., 2006) is that one gene is crucial for functions that compensate for the abnormal cellular state resulting from the loss of the other gene. In this scenario, termed unidirectional compensation, the relationship between the genes is asymmetric in the sense that one gene can compensate for the loss of the other but not vice versa. We refer to the gene whose knockout causes the perturbation as the upstream gene and to the compensating gene as the downstream gene. While examples for this type of interpretation have been shown on existing data (Pan et al., 2006), no systematic test was carried out to identify the aggravating interactions that can be explained by such unidirectional interpretation and to assess their fraction within the observed aggravating interactions.
3.1 Identifying unidirectional compensation
Our premise is that we can identify unidirectional compensation by comparing the perturbation of a putative upstream gene with perturbations caused by external stimuli. We say that an external stimulus (e.g. a drug or an environmental insult) phenocopies a gene deletion if the genes required for coping with the stimulus are the same ones required to compensate for the perturbation of the upstream gene. Stated in terms of available data, this definition implies a significant overlap between the genes whose knockout lead to sensitivity to the stimulus and these that have aggravating interactions with the upstream gene. Moreover, genes in this overlap are downstream to the specific upstream gene. By establishing such phenocopy relations, we implicate unidirectional interactions from the upstream genes and their matching downstream genes.
For example, deletion of the CHL1 gene leads to abnormal chromosome segregation similar to the damage caused by external microtubule depolymerizing agents (e.g. benomyl). In turn, the deletion strain of bub3Δ shows growth retardation under benomyl. Thus, we interpret the aggravating interaction between CHL1 and BUB3 as resulting from unidirectional compensation, where CHL1 is the upstream gene and BUB3 is the downstream gene (Fig. 6). Indeed, this interpretation is conceivable, as Chl1 is involved in sister chromatid pairing during the S phase, and Bub3 is part of the spindle assembly checkpoint, in charge of delaying anaphase in cases of abnormal spindle assembly.
Fig. 6.

Identifying unidirectional interactions. (A) An example of aggravating interactions (middle) that might be due to different mechanisms. Both CHL1 and CTF19 genes (red ellipses) have functions related to sister chromatid pairing during the S-phase. Thus, their aggravating interaction (denoted by a blue line) might be a result of their overlapping functions (left). However, the aggravating interactions of CHL1 and BUB3, which is part of the spindle assembly checkpoint, is more likely the result of a different mechanistic reason (denoted by a directed red arrow; right), where the lack of a gene (i.e. chl1Δ) induces abnormal chromosome segregation, that requires the activation of the spindle assembly checkpoint including BUB3. (B) Yeast cells exposed to benomyl (denoted by a green diamond) show the same sensitivity to BUB3 perturbation as the chl1Δ strain, suggesting that chl1Δ background causes a stress similar to exposure to benomyl.
When elaborating this reasoning we have to be careful not to confuse unidirectional compensation with dosage effect: if a gene phenocopies a stimulus, we might expect to see that its deletion amplifies the effect of this stimulus, showing higher sensitivity to its application (loosely stated, higher dosage of the stimulus). In such cases, we might mistakenly implicate an upstream gene to be downstream to another gene that also phenocopies the same stimulus. However, in such situations we will, by definition, identify bidirectional interactions where one gene is both upstream and downstream to another gene. Thus, we can detect these situations, and distinguish them from a proper unidirectional compensations.2
The reasoning we outline here (and apply below) detects, up to usual concerns about experimental or statistical noise, asymmetries of aggravating interactions with respect to phenotypes of external stimuli. This is a well-defined and clear criterion. A more ambitious step is to deduce from this asymmetry directionality in the underlying biological mechanisms. In our example of CHL1 and BUB3, we have strong intuitions about the causal direction (as sister chromatid pairing precedes spindle assembly). In other cases, the underlying causality is much murkier. Moreover, we can imagine external perturbations that will lead to opposite asymmetry. For example, if a certain drug targets in a specific manner the spindle assembly checkpoint, we would detect asymmetric behavior of CHL1 and BUB3 to it, but in the opposite direction. This thought exercise implies that we need to be careful about deducing directionality in the underlying biology. However, we believe it is reasonable to assume that in most cases external perturbations are ones that causes cellular imbalances or stress conditions rather than disable mechanisms that cope with such situations.
3.2 Application to genetic interaction maps in S.cerevisiae
To systematically detect unidirectional compensation, we collected data from genetic screens that measured growth of yeast deletion strains under various external conditions and insults compared to YPD conditions (Bennett et al., 2001; Dudley et al., 2005; Giaever et al., 2002; Hillenmeyer et al., 2008; Parsons et al., 2004, 2006). We considered deletion strains from both homozygote diploid and haploid deletions. We converted all measurements into a binary score, by defining genes with growth defects as those that passed the threshold defined by the authors of each study (for a detailed description of how we handled each dataset see Appendix B in the Supplementary website).
This process resulted in listing for each external stimulus the repertoire of deletion strains that display a growth defect in its presence. In a similar manner, each gene deletion defines a list of genes that are sensitive to its deletion, i.e. display aggravating interactions with it using the same threshold, −2.5, as Collins et al. 2007a; Schuldiner et al., 2005). We then define a unidirectional compensation between genes X and Y (associated with external perturbation P) if (i) there exists an aggravating interaction between X and Y; (ii) the perturbation of Y leads to sensitivity to the external perturbation P; (iii) X has aggravating interactions with a significant number of genes whose perturbations cause sensitivity to the perturbation P (using hyper-geometric test with FDR of 0.1); and (iv) at least one of the conditions 2 or 3 do not hold on the opposite direction (when switching the roles of X and Y).3
We applied this procedure to the CB and ESP genetic interaction maps and found 348 gene deletions that are phenocopied by at least one external stimulus. These stimuli include a wide range of external perturbations that match the nature of the specific data set analyzed. For example, many external stimuli corresponding to gene deletions in the CB map include agents causing DNA damage and microtubule depolymerization, while the stimuli related to the ESP map mostly include agents causing protein synthesis and glycosylation inhibition (see Supplementary website). To our surprise, more than one-third of the aggravating genetic interactions (CB: 4659/11539; ESP: 1036/2718) could be explained by unidirectional compensation.
4 ELUCIDATING THE FUNCTION OF CELLULAR PATHWAYS
We next asked whether unidirectional compensation can also be assigned within the modular hierarchy in terms of upstream and downstream modules. Toward this end, we incorporated these unidirectional interactions into our hierarchical organization of interacting modules. We annotated an aggravating edge between two modules as caused by unidirectional compensation if the majority of interactions between these modules are unidirectional and share the same context (i.e. have the same directionality and are related to the same external stimulus; Fig. 7A; Supplementary website). By requiring consistent unidirectional interactions between modules, this incorporation also removes potential errors in the annotation of unidirectional interactions (Supplementary website). We find that this designation elucidates the cellular role of modules and their interactions. Coming back to our previous example, we find that perturbations of modules CB-119 and CB-187 lead to stress conditions similar to those caused by microtubule de-polymerizing agent benomyl (Fig. 7B). Our analysis identified module CB-183 as downstream to benomyl-like stress caused by mutations of genes in CB-119 and CB-187. Indeed, the protein products of the genes in CB-119 and CB-187 are components of the machinery responsible for the correct distribution of chromosomes during cell division (Hanna et al., 2001; Measday et al., 2002). By de-polymerizing microtubules that create the spindle fibres, benomyl attacks a crucial component of this process. Finally, the genes in module CB-183 participate in the spindle assembly checkpoint that delays the onset of anaphase in cells with defects in mitotic spindle assembly (Nasmyth, 2005). This example demonstrates the power of our approach in automatically providing biological insights into the function of the genes in various modules.
Fig. 7.

Inter-module unidirectional interactions. (A) Systematic identification of unidirectional interactions: a systematic search discovers cases of statistically significant overlap between patterns of gene sensitivities under specific external stimuli (green lines) and the aggravating partners of specific genes (blue lines). We annotate these aggravating interactions as unidirectional, and denote them by red arrows directed from the upstream gene (whose deletion causes the cell perturbation) to the downstream genes (which deal with the particular cell perturbation). (B) All inter-module aggravating edges were scanned and searched for potential unidirectional edges. If the majority of the interactions involved in an inter-module aggravating edge are marked as consistent unidirectional interactions (corresponding to the same external stimulus and in the same direction), this edge was annotated as a unidirectional edge with respect to the specific external stimulus (green diamond).
The concise representation of the observed genetic interactions as edges within and between modules, in combination with the specific interpretation of many aggravating edges as caused by unidirectional compensations, pinpoints novel functions of modules that are not readily apparent from clustering of genetic interactions alone. The results of our automatic search provide an elaborate network of such inter- and intra-module edges, thus, we constructed a web-tool providing a user-friendly interface to browse our results in an effective manner (Supplementary website).
For example, examining unidirectional edges related to DNA damage agents, such as hydroxyurea and camptothecin, we find multiple upstream and downstream modules (Fig. 8A). A notable downstream module (CB-137) comprises three sub-modules; of these, both CB-136, that contains the Holiday junction complex, and CB-134 that comprises genes of the Rad51 pathway and MRX complex are established mechanisms of DNA damage repair. The third sub-module (CB-132) comprises five genes whose protein products were recently characterized as involved in the acetylation of histone H3 lysine 56 (H3K56Ac) pathway (Collins et al., 2007a). In addition, we find an alleviating interaction between the H3K56Ac module and S-phase-related module (CB-194), suggesting that the function of H3K56Ac pathway is S-phase-related. This example illustrates the power of the combination between the hierarchical structure of modules and the annotation of unidirectional edges. Our method identifies one parent module with a general DNA repair annotation that contains three sub-modules with different interactions that imply different specific functions. For example, the alleviating interaction of CB-132 with CB-194 suggests that the H3K56Ac pathway is involved in relieving DNA damage in the S - phase. Indeed, loss of H3K56 acetylation results in higher sensitivity to exposure to DNA damaging agents during S -phase (Masumoto et al., 2005) and this pathway was proposed as a DNA integrity check point following replication (Collins et al., 2007a).
Fig. 8.

Unidirectional interactions enable inference of functional hypotheses. Unidirectional edges between modules (grey boxes) are annotated by red arrows. Aggravating and alleviating interactions between modules are annotated by blue and yellow lines, respectively. (A) Unidirectional edges involving stimuli similar to hydroxyurea and camptothecin, two DNA damage-inducing drugs. Some edges were omitted from the graphical view for clarity. (B) Unidirectional edges involving the deacetylation inhibitor Trichostatin-A (TSA). Some edges were omitted from the graphical view for clarity.
Another example regards the unidirectional edges related to TSA, a histone deacetylation inhibitor that affects class I and II histone deacetylases (Furumai et al., 2001; Fig. 8B). We find two modules whose perturbation is phenocopied by TSA: Set3 complex (CB-82) and Thp1–Sac3 complex (CB-92). Set3 complex is a histone deacetylation complex, and thus it is plausible that TSA phenocopies its perturbation. However, the relation of the Thp1–Sac3 complex, comprising mRNA export factors associated with the nuclear pore, to deacetylation is less obvious. Clues to this puzzle can be found when examining the downstream modules with respect to this external stimulus. Most of these downstream modules are related to chromosome segregation (CB-121 and CB-183) and the Swr1 complex (CB-218), a chromatin modifier with genome integrity phenotype (van Attikum et al., 2007). This suggests that TSA damages chromosome integrity, and that perturbations of Thp1–Sac3 complex and Set3 complex lead to similar damage. Indeed, previous studies showed that Thp1–Sac3 complex has a role in transcription elongation, and that its perturbation affects genome stability (González-Aguilera et al., 2008). Previous works suggested that histone deacetylation by Set3 is also associated with active transcription (Kim and Buratowski, 2009; Wang et al., 2002), leading us to hypothesize that perturbations of these complexes interfere with transcription elongation, resulting in chromosome instability. Interestingly, we observe a directed interaction from Set3 to the Rpd3 complex (CB-40), also a histone deacetylase. This asymmetry is consistent with the wider range of functions of Rpd3 (Suka et al., 2001) in contrast to the specificity of Set3 targets (Wang et al., 2002), explaining why Rpd3 can (partially) compensate for defects in Set3 and not vice versa.
5 DISCUSSION
From maps to networks: our methodology takes a step forward towards automating the extraction of biological knowledge from large-scale genetic interaction maps. A crucial step in dealing with the large quantities of interaction data is summarizing the observations in a representation that identifies patterns in the data. Previous works mainly used local signatures to capture interactions between pairs of modules (Bandyopadhyay et al., 2008; Pu et al., 2008) or learn a network of disjoint modules that are coherent in terms of physical and genetic interactions (Ulitsky et al., 2008). Here, we focus on finding a global representation that captures the bulk of the genetic interactions, without requiring additional information, and employ a module hierarchy to capture functional specialization of different sub-modules. Our representation facilitates inspection of the large-scale results, by presenting each module along with all its interacting partners as well as its hierarchical context. This representation defines the modules within their biological context, minimizing the requirements for expert knowledge for inference of testable biological hypotheses from genetic interaction data.
Our empirical results on two very different genetic interaction maps show that this representation captures much of the patterns of interactions in the data. Although our representation captures many interactions, it does not include all the interactions. Some of the missed interactions may be false positives, and thus at this front our analysis would serve to purge such data from the genetic interaction maps. There are, however, various reasons for missing true interactions. For example, some interactions are excluded since we restrict the module size to at least two genes, so that noisy measurements for a specific deletion will not dominate the results. This implies that our procedure may miss a consistent set of interactions between a single gene and a module. Also, the constraint of a strict hierarchy may lead to situations where a gene with multiple functions has to choose which module to belong to and thus to miss some of its interactions (Pu et al., 2008). A natural extension of our method, which can partially resolve this issue, is to allow an extended hierarchy, where a module can be the child of more than one parent. As demonstrated by the success of GO ontology in capturing functional annotations (Ashburner et al., 2000), such hierarchical graphs are natural in the context of functional gene organization.
Striving for mechanisms: one goal of the analysis of genetic interaction maps is to decipher the causal explanation underlying the observed interactions. Automating this aspect of the analysis provides a significant advance toward interpretation of genetic interaction maps. Earlier studies mostly focused on interpretations that involve complexes and pathways (alleviating interactions among members of the complex/pathway, and a similar spectrum of interactions with other genes) and redundant functions of such complexes/pathways (parallel pathways may have aggravating interactions between genes involved in these pathways). Although other explanations were acknowledged (Boone et al., 2007; Pan et al., 2006) and implicitly used in interpreting the results, these were not reflected in automated analyses. Here, we introduce a novel automated analysis to systematically detect unidirectional interactions where a downstream gene buffers or compensates for the effect of the perturbation of an upstream gene.
Using our automated analysis, we find that a large portion of the observed aggravating genetic interactions (at least a third) can be attributed to such unidirectional interactions. This finding partially accounts for the large number of aggravating interactions between genes of distantly related functions. Moreover, the analysis annotates interactions by the type of damage caused by the perturbation of the upstream genes, providing informative clues for interpreting the results. Finally, we combine this analysis with the modular hierarchy representation to understand the relations between modules. When looking at the types of external stimuli phenocopied by gene deletions in our analysis, we find that many of them can cause major stress conditions in the cell such as DNA damage (e.g. by UV, hydroxyurea, camptothecin and MMS) and translation inhibition (e.g. cycloheximide and hygromycin B). In this case, we can interpret unidirectional compensations as connecting between a module whose perturbation causes stress and a module that has a part in relieving this stress. Indeed, many of the downstream modules associated with such stress conditions are known to be central players in the cellular response to various stress conditions, for example the DNA damage repair module (CB-137) and spindle assembly checkpoint (CB-183).
Global examination of the resulting network shows that many highly connected modules have a high percentage of their aggravating partners related through unidirectional edges related with major stress conditions (Fig. 9). Moreover, highly connected modules tend to be either upstream (i.e. their removal causes stress conditions) or downstream (i.e. stress relieving), but not both (Supplementary website). These observations suggest that unidirectional compensation plays a pivotal role in forming interaction hubs in genetic interaction maps. Furthermore, they suggest that responses of cellular integrity mechanisms to genetic perturbations are a major factor in shaping genetic interaction maps.
Fig. 9.

Many hubs of genetic interactions are related to unidirectional compensation. A histogram of the fraction of unidirectional edges (y-axis) for modules with different degree of aggravating edges (x-axis). Each bar shows the portion of unidirectional edges out of all edges that are connected to modules with this degree.
Toward organizational principles of genetic interaction maps: the methodology we present here puts forward two major contributions toward understanding the organization of genetic interaction maps. First, the hierarchy of modules is automatically built independent of additional data sources, allowing its application to various existing genetic interaction maps and also to less studied organisms. Moreover, the creation of a visual platform to study these results should boost the usability of these datasets, many of which are currently only used to find single interactions between genes of interest. Second, we elucidate some of the mechanisms underlying the interactions between modules. By integrating an additional data source we enabled the distinction between uni- and bi-directional aggravating interactions, and provided more functionally coherent interpretations to the genetic interaction maps. Our results demonstrate that searching for a causal explanation for the genetic interactions highlights specific insights into the cellular roles of genes and pathways as well as elucidates global features of the genetic interaction map. With the increasing availability of genetic interaction maps in yeast and as they become available for a large number of organisms, many of them with sparser annotation (Butland et al., 2008; Byrne et al., 2007; Roguev et al., 2008), we believe that these methods can be generalized and will prove valuable in the automated highlighting of both the functional structure of the network as well as specific biological phenomena. This should allow us to make the first steps necessary to turn high-throughput maps into a true understanding of cellular complexity by interpreting how such maps relate to the underlying landscape of interacting cellular pathways.
ACKNOWLEDGEMENTS
We thank N. Barkai, S. Gasser, Z. Itzhaki, T. Kaplan, P.D. Kaufman, O.J. Rando, A. Regev, M. Yassour, E. Yeger-Lotem, I. Wapinski, and J.S. Weissman for discussions and useful comments on the article. We also thank S. Collins and N. Krogan for making data available prior to publication.
Funding: Eshkol fellowship from the Israeli Ministry of Science (to A.J.); Rudin Foundation (to R.R.); Human Frontiers Science Program Career Development Award (to M.S.); European Union grant 3D-Repertoire, contract number LSHG-CT-2005-512028 (to H.M.); National Institutes of Health grant 1R01CA119176-01 (to N.F.).
Conflict of Interest: none declared.
Footnotes
1When comparing to (Bandyopadhyay et al., 2008) we considered only modules with more than one gene.
2We estimate that up to five percent of unidirectional interactions are actually caused by dosage effect but were not identifed as such since not all the genes were tested in all the screens (data not shown).
3To measure the statistical significance of the interactions we found, we created a random permutation of the names of the genes in the genetic interaction screen, and repeated the procedure described above. In 10 repeats, no significant overlaps between genes and external stimuli were found, thus no unidirectional interactions were identified.
REFERENCES
- Ashburner M, et al. Gene ontology: tool for the unification of biology. The Gene Ontology Consortium. Nat. Gen. 2000;25:25–29. doi: 10.1038/75556. [DOI] [PMC free article] [PubMed] [Google Scholar]
- Bandyopadhyay S, et al. Functional maps of protein complexes from quantitative genetic interaction data. PLoS Comput. Biol. 2008;4:e1000065. doi: 10.1371/journal.pcbi.1000065. [DOI] [PMC free article] [PubMed] [Google Scholar]
- Bennett CB, et al. Genes required for ionizing radiation resistance in yeast. Nat. Gen. 2001;29:426–434. doi: 10.1038/ng778. [DOI] [PubMed] [Google Scholar]
- Beyer A, et al. Integrating physical and genetic maps: from genomes to interaction networks. Nat. Rev. Genet. 2007;8:699–710. doi: 10.1038/nrg2144. [DOI] [PMC free article] [PubMed] [Google Scholar]
- Boone C, et al. Exploring genetic interactions and networks with yeast. Nat. Rev. Genet. 2007;8:437–449. doi: 10.1038/nrg2085. [DOI] [PubMed] [Google Scholar]
- Butland G, et al. eSGA: E. coli synthetic genetic array analysis. Nat. Methods. 2008;5:789–795. doi: 10.1038/nmeth.1239. [DOI] [PubMed] [Google Scholar]
- Byrne AB, et al. A global analysis of genetic interactions in Caenorhabditis elegans. J. Biol. 2007;6:8. doi: 10.1186/jbiol58. [DOI] [PMC free article] [PubMed] [Google Scholar]
- Collins S, et al. Functional dissection of protein complexes involved in yeast chromosome biology using a genetic interaction map. Nature. 2007a;446:806–810. doi: 10.1038/nature05649. [DOI] [PubMed] [Google Scholar]
- Collins S, et al. Toward a comprehensive atlas of the physical interactome of Saccharomyces cerevisiae. Mol. Cell Proteomics. 2007b;6:439–450. doi: 10.1074/mcp.M600381-MCP200. [DOI] [PubMed] [Google Scholar]
- Cover T, Thomas J. City College of New York. New York: John Wiley; 2001. Elements of Information Theory. [Google Scholar]
- Dudley A, et al. A global view of pleiotropy and phenotypically derived gene function in yeast. Mol. Syst. Biol. 2005;1:2005.0001. doi: 10.1038/msb4100004. [DOI] [PMC free article] [PubMed] [Google Scholar]
- Eisen M, et al. Cluster analysis and display of genome-wide expression patterns. Proc. Natl Acad. Sci. 1998;95:14863–14868. doi: 10.1073/pnas.95.25.14863. [DOI] [PMC free article] [PubMed] [Google Scholar]
- Fiedler D, et al. Functional organization of the S. cerevisiae phosphorylation network. Cell. 2009;136:952–963. doi: 10.1016/j.cell.2008.12.039. [DOI] [PMC free article] [PubMed] [Google Scholar]
- Furumai R, et al. Potent histone deacetylase inhibitors built from trichostatin a and cyclic tetrapeptide antibiotics including trapoxin. Proc. Natl Acad. Sci. USA. 2001;98:87–92. doi: 10.1073/pnas.011405598. [DOI] [PMC free article] [PubMed] [Google Scholar]
- Giaever G, et al. Functional profiling of the Saccharomyces cerevisiae genome. Nature. 2002;418:387–391. doi: 10.1038/nature00935. [DOI] [PubMed] [Google Scholar]
- Glover F, et al. A user's guide to TABU search. Ann. Oper. Res. 1993;41:1–28. [Google Scholar]
- González-Aguilera C, et al. The THP1-SAC3-SUS1-CDC31 complex works in transcription elongation-mRNA export preventing RNA-mediated genome instability. Mol. Biol. Cell. 2008;19:4310–4318. doi: 10.1091/mbc.E08-04-0355. [DOI] [PMC free article] [PubMed] [Google Scholar]
- Hanna J, et al. Saccharomyces cerevisiae CTF18 and CTF4 are required for sister chromatid cohesion. Mol. Cell. Biol. 2001;21:3144–3158. doi: 10.1128/MCB.21.9.3144-3158.2001. [DOI] [PMC free article] [PubMed] [Google Scholar]
- Helenius A, Aebi M. Roles of N-linked glycans in the endoplasmic reticulum. Annu. Rev. Biochem. 2004;73:1019–1049. doi: 10.1146/annurev.biochem.73.011303.073752. [DOI] [PubMed] [Google Scholar]
- Hillenmeyer M, et al. The chemical genomic portrait of yeast: uncovering a phenotype for all genes. Science. 2008;320:362–365. doi: 10.1126/science.1150021. [DOI] [PMC free article] [PubMed] [Google Scholar]
- Kelley R, Ideker T. Systematic interpretations of genetic interactions using protein networks. Nat. Biotech. 2005;23:561–566. doi: 10.1038/nbt1096. [DOI] [PMC free article] [PubMed] [Google Scholar]
- Kim T, Buratowski S. Dimethylation of H3K4 by Set1 recruits the Set3 histone deacetylase complex to 5′ transcribed regions. Cell. 2009;137:259–272. doi: 10.1016/j.cell.2009.02.045. [DOI] [PMC free article] [PubMed] [Google Scholar]
- Makhnevych T, et al. Global map of SUMO function revealed by protein-protein interaction and genetic networks. Mol. Cell. 2009;33:124–135. doi: 10.1016/j.molcel.2008.12.025. [DOI] [PubMed] [Google Scholar]
- Masumoto H, et al. A role for cell-cycle-regulated histone H3 lysine 56 acetylation in the DNA damage response. Nature. 2005;436:294–298. doi: 10.1038/nature03714. [DOI] [PubMed] [Google Scholar]
- Measday V, et al. Ctf3p, the Mis6 budding yeast homolog, interacts with Mcm22p and Mm16p at the yeast outer kinetochore. Genes Dev. 2002;16:101–113. doi: 10.1101/gad.949302. [DOI] [PMC free article] [PubMed] [Google Scholar]
- Nasmyth K. How do so few control so many? Cell. 2005;120:739–746. doi: 10.1016/j.cell.2005.03.006. [DOI] [PubMed] [Google Scholar]
- Pan X, et al. A DNA integrity network in the yeast Saccharomyces cerevisiae. Cell. 2006;124:1069–1081. doi: 10.1016/j.cell.2005.12.036. [DOI] [PubMed] [Google Scholar]
- Parsons A, et al. Integration of chemical-genetic and genetic interaction data links bioactive compounds to cellular target pathways. Nat. Biotechnol. 2004;22:62–69. doi: 10.1038/nbt919. [DOI] [PubMed] [Google Scholar]
- Parsons A, et al. Exploring the mode-of-action of bioactive compounds by chemical-genetic profiling in yeast. Cell. 2006;126:611–625. doi: 10.1016/j.cell.2006.06.040. [DOI] [PubMed] [Google Scholar]
- Pu S, et al. Local coherence in genetic interaction patterns reveals prevalent functional versatility. Bioinformatics. 2008;24:2376–2383. doi: 10.1093/bioinformatics/btn440. [DOI] [PubMed] [Google Scholar]
- Rissanen J. A universal prior for integers and estimation by minimum description length. Ann. Stat. 1983;11:416–431. [Google Scholar]
- Roguev A, et al. Conservation and rewiring of functional modules revealed by an epistasis map in fission yeast. Science. 2008;332:405–410. doi: 10.1126/science.1162609. [DOI] [PMC free article] [PubMed] [Google Scholar]
- Schuldiner M, et al. Exploration of the function and organization of the yeast early secretory pathway through an epistatic miniarray profile. Cell. 2005;123:507–519. doi: 10.1016/j.cell.2005.08.031. [DOI] [PubMed] [Google Scholar]
- Segrè D, et al. Modular epistasis in yeast metabolism. Nat. Genet. 2005;37:77–83. doi: 10.1038/ng1489. [DOI] [PubMed] [Google Scholar]
- Suka N, et al. Highly specific antibodies determine histone acetylation site usage in yeast heterochromatin and euchromatin. Mol. Cell. 2001;8:473–479. doi: 10.1016/s1097-2765(01)00301-x. [DOI] [PubMed] [Google Scholar]
- Tong A, et al. Systematic genetic analysis with ordered arrays of yeast deletion mutants. Science. 2001;294:2364–2368. doi: 10.1126/science.1065810. [DOI] [PubMed] [Google Scholar]
- Ulitsky I, et al. From E-MAPs to module maps: dissecting quantitative genetic interactions using physical interactions. Mol. Syst. Biol. 2008;4:209. doi: 10.1038/msb.2008.42. [DOI] [PMC free article] [PubMed] [Google Scholar]
- van Attikum H, et al. Distinct roles for SWR1 and INO80 chromatin remodeling complexes at chromosomal double-strand breaks. EMBO J. 2007;26:4113–4125. doi: 10.1038/sj.emboj.7601835. [DOI] [PMC free article] [PubMed] [Google Scholar]
- Wang A, et al. Requirement of hos2 histone deacetylase for gene activity in yeast. Science. 2002;298:1412–1414. doi: 10.1126/science.1077790. [DOI] [PubMed] [Google Scholar]
- Wilmes GM, et al. A genetic interaction map of RNA-processing factors reveals links between sem1/dss1-containing complexes and mRNA export and splicing. Mol. Cell. 2008;32:735–746. doi: 10.1016/j.molcel.2008.11.012. [DOI] [PMC free article] [PubMed] [Google Scholar]