Abstract
Motivation: One of the most successful methods to date for recognizing protein sequences that are evolutionarily related, has been profile hidden Markov models. However, these models do not capture pairwise statistical preferences of residues that are hydrogen bonded in β-sheets. We thus explore methods for incorporating pairwise dependencies into these models.
Results: We consider the remote homology detection problem for β-structural motifs. In particular, we ask if a statistical model trained on members of only one family in a SCOP β-structural superfamily, can recognize members of other families in that superfamily. We show that HMMs trained with our pairwise model of simulated evolution achieve nearly a median 5% improvement in AUC for β-structural motif recognition as compared to ordinary HMMs.
Availability: All datasets and HMMs are available at: http://bcb.cs.tufts.edu/pairwise/
Contact: anoop.kumar@tufts.edu; lenore.cowen@tufts.edu
1 INTRODUCTION
Profile hidden Markov models (HMMs) have been one of the most successful methods to date for recognizing both close and distant homologs of given protein sequences. Popular HMM methods such as HMMER (Eddy et al., 1998a, b) and SAM (Hughey and Krogh, 1996) have been behind the design of databases such as Pfam (Finn et al., 2006), PROSITE (Hulo et al., 2006) and SUPERFAMIILY (Wilson et al., 2007). However, a limitation of these HMMs is, since there is only finite state information about the sequence that can be held in any particular position, HMMs cannot capture dependencies that are far, and variable distance apart, in sequence.
On the other hand, in β-structural motifs, as was noticed by Lifson, Sander and others (Hubbard and Park, 1995; Lifson and Sander, 1980; Olmea et al., 1999; Steward and Thornton, 2002; Zhu and Braun, 1995), amino acid residues that are hydrogen bonded in β-sheets exhibit strong pairwise statistical dependencies. These residues, however, can be far away and a variable distance apart in sequence, making them impossible to capture in an HMM. Early work of Bradley et al. (Bradley et al., 2001; Cowen et al., 2002) show that these pairwise correlations help to recognize protein sequences that fold into the right-handed parallel β-helix fold. More recent work has used a conditional random field or Markov random field framework, both of which generalize HMMs beyond linear dependencies, to identify the right-handed parallel β-helix fold (Liu et al., 2009), the leucine rich repeat fold (Liu et al., 2009) and the β-propeller folds (Menke et al., 2010).
While these conditional random field and Markov random field models are extremely powerful in theory, in practice, substantial computational barriers remain for template construction, training and computing the minimum energy threading of an unknown sequence onto a template. Thus, a general structure software tool designed for β-structural folds, in the same manner as HMMER and SAM packages recognize all protein structural folds, remains a challenging unsolved problem.
In this article, we find an unusual and different way to incorporate pairwise dependencies into profile HMM. In particular, we generalize our recent work (Kumar and Cowen, 2009) on augmenting HMM training data to include these very pairwise dependencies as a part of a larger training set (see below). While this method of incorporating pairwise dependencies is undoubtedly less powerful than MRF methods, it has the advantage of being simple to implement, computationally fast and allows the modular application of existing HMM software packages. We show that our augmented HMMs perform better than ordinary HMMs on the task of recognizing β-structural SCOP (Lo Conto et al., 2002) protein superfamilies. In particular, we consider the problem of how well an HMM trained on only one family β-structural SCOP superfamily can learn to recognize members of other SCOP families in that SCOP superfamily, as compared to decoys. We show a median AUC improvement of nearly 5% for our approach compared to ordinary HMMs on this task.
2 APPROACH
Our approach is based on the simulated evolution paradigm introduced in Kumar and Cowen (2009). The possibility that motif recognition methods could be improved with the addition of artificial training sequences had been previously suggested in the protein design community (Koehl and Levitt, 1999), though the methods of Koehl and Levitt (1999); Larson et al. (2003) and Am Busch et al. (2009) to generate these sequences are much more computationally intensive than the simple sequence-based mutation model of Kumar and Cowen. In particular, Kumar and Cowen created new training sequences by artificially adding point mutations to the original sequences in the training set, using the BLOSUM62 matrix (Eddy, 2004). The HMM training was then used on this larger, augmented training set unchanged.
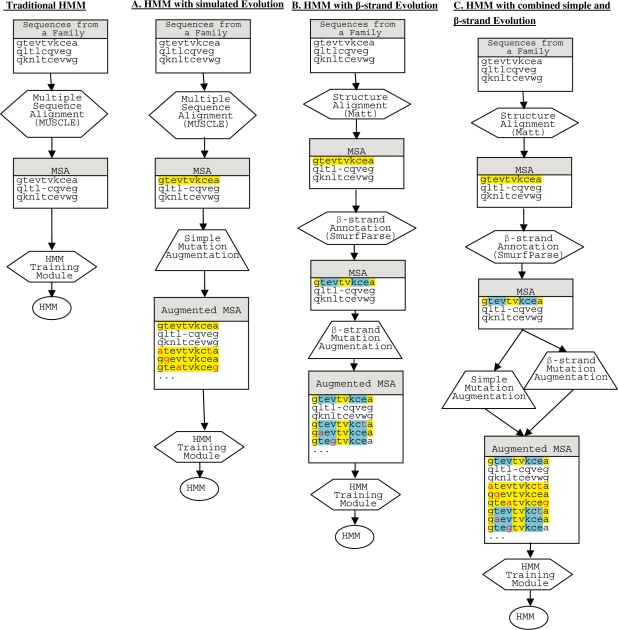
In this article, we compare ordinary HMMER Profile HMMs, HMMER Profile HMMs augmented with a point mutation model (similar to Kumar and Cowen, 2009), and HMMs augmented with training sequences based on pairwise dependencies of β-sheet hydrogen bonding (see Fig. 1). Thus we have generalized the single frequency approach of Kumar and Cowen (2009), to pairwise probabilities. More specifically, to create our new training sequence based on β-strand constrained evolution, the following pipeline is followed:
The input to HMM training is a set of PDB files for sequences that lie in the same SCOP family.
The sequences are aligned by way of multiple structure alignment program.
Positions corresponding to paired residues that hydrogen bond in adjacent β-strands are found using SmurfParse package.
For each sequence that lies in the original training set, additional sequences are added to the training set using random mutations according to a probability distribution based on the paired positions within β-strands, as described below.
The multiple sequence alignment, including sequences in the original training set as well as the new sequences generated by simulated evolution, is passed to the ordinary HMM training module.
This pipeline is illustrated in Figure 1B, along with HMM-C, an approach that combines both point mutations and pairwise mutations in the training set.
Fig. 1.
Training HMMs by (A) a pointwise mutation model, (B) a pairwise mutation model and (C) combining (A and B).
We use these augmented HMMs to solve the following task: trained only on the sequences from single SCOP family can our HMMs distinguish between the following two classes: (i) sequences from other SCOP families in the same SCOP superfamily as the training set and (ii) decoy sequences that lie outside the fold class of the family of the training set.
3 METHOD
3.1 Datasets
We employed an approach similar to that of Wistrand and Sonnhammer (2004) to pick SCOP families and superfamilies from among those that belong to the ‘mainly beta proteins’ class in SCOP and train HMMs. First, we chose sequences from SCOP that are <95% identical based on the ASTRAL database version 1.73 (Chandonia et al., 2004). The dataset was then filtered to include only the SCOP families that belonged to ‘mainly beta proteins’ class and had at least 10 sequences. Another constraint imposed in order to have test sets was to make sure that other SCOP families in the superfamily hierarchy had at least one sequence but not more than 50 sequences. Our test set consisted of all the sequences from the rest of the families in the superfamily and an equal number of decoy sequences chosen at random from different SCOP folds. The dataset is available at: http://bcb.cs.tufts.edu/pairwise/.
3.2 Multiple sequence alignment
This is the process of aligning the homologous residues in protein sequences into columns and thus generating a multiple sequence alignment (MSA).
3.2.1 Aligning sequences with MUSCLE
For the single frequency augmented training model, we used the popular program MUSCLE Version 4 (Edgar, 2004) to generate the MSA that was provided to the HMM training methods. It is one of the fastest programs available and produces global sequence alignments for the set of sequences from a family. We developed a script to transform the MUSCLE alignment output to .ssi (STOCKHOLM) format since other MUSCLE output formats are not supported by HMMER 3.0a2.
3.2.2 Aligning sequences with Matt
For the pairwise augmented training model, and the hybrid model, we used multiple alignment with translations and twists (Matt) (Menke et al., 2008) to align the sequences based on the structure. By allowing local flexibility and allowing small translations and rotations, Matt demonstrates an ability to better align the ends of α-helices and β-strands. We used Matt in default configuration for aligning the sequences in a family. Alignment based on structure is essential to determine the location of β-strands in the sequences and thus augment the dataset based on conserved residue pairs in β-strands.
3.3 Mutation models
3.3.1 Simple mutation model
We used the BLOSUM62 matrix as our simple model of evolutionary mutations (Eddy, 2004). Mutations in a sequence are added by randomly picking a position in the sequence and the replacing the amino acid in that position with a new amino acid based on the BLOSUM62 probability until a desired threshold of s% mutations is reached. For each training sequence, N new mutated sequences with s% mutations are created and added to the training set. Therefore a family with 100 sequences will have 100 + N × 100 (100 original + N × 100 mutated) sequences in the training set. In this study, we create training sets with 5, 10, 15, 20 and 25% mutations per the length of sequence and tested several values of N ranging from 10–1000. We picked a value of N at the 20% mutation rate for which the results were stable (see Section 3.5).
3.3.2 β-Strand mutation model
In this step we augment the MSA with a set of sequences that are produced by mutating the original sequences in such a way that the frequency of pairs of amino acids hydrogen bonded in β-sheets resembles the frequency observed in known protein fold space. We use the pairwise conditional probability frequency tables from the recent paper of Menke et al. (2010). There are two tables, representing the in–out residue positions, respectively, for β-sheets that have one side buried and one side exposed to solvent. The tables were learned from solved protein structures in the PDB.
β−Strands in the aligned set of structures are found by the program SmurfPreparse which is part of the Smurf Package (Menke, 2009; Menke et al., 2010). The program not only outputs the positions of the consensus β-strands in the alignment, it also declares a position buried or exposed based on which of the two tables is the best fit to the amino acids that appear in that position in the training data.
For each sequence in the training set, M mutated sequences with p% mutations are created and added to the training set. Here ‘p’ is set not to be proportional to the total length of the entire sequence, but instead to the total length of the β-strand positions in the alignment. New sequences are created as follows. Residue positions contained in β-strands are selected uniformly at random. If position ‘i’ is selected, its pair residue ‘j’ is found (note that j may appear before or after ‘i’ in sequence) and i is mutated according to the appropriate pairwise table, conditioned on it being hydrogen bonded to the residue of type in position ‘j’. This process is repeated p times and the resulting sequence is added to the augmented training set. At the end of this process, for example, a family with 100 original sequences in the training set will have 100 + M × 100 (100 original + M × 100 mutated) sequences in the augmented training set. In this study, we set values of p that would result in training sets with 10–100% mutations (note: we allow sites to mutate more than once, for example some of the positions even a sequence with a 100% mutation rate may not end up mutated) and tested multiple values of M ranging from 10–1000. We picked a value of M at which the results were stable at the 20% mutation rate (see Section 3.5).
3.4 Building the HMM
In our approach, the primary steps in building the HMM remain the same except the training set is augmented with mutated sequences based on the two evolutionary models. The process is shown in Figure 1.
Two packages are widely adopted to work width profile HMMs: SAM (Hughey and Krogh, 1996) and HMMER (Eddy, 1998a, b). SAM has been demonstrated to be more sensitive overall, while HMMER's model scoring is more accurate (Wistrand and Sonnhammer, 2004). In this study we use HMMER versions 3.0a2 to evaluate the models of protein families as it is freely available and can be easily downloaded from the website. We construct HMMs from the MSAs using the hmmbuild program which is part of the HMMER package.
In this approach, the model of the HMM is made up of a linear set of match (M) states, one per consensus column in the MSA. Each M state emits a single residue, with a probability score that is determined by the frequency that residues have been observed in the corresponding column of the MSA. Each match state therefore carries a vector of 20 probabilities, for scoring the 20 amino acids. The HMMs also model the gapped alignments by including insertion (I) and deletion (D) states in between the match states. The match, insertion and deletion states are connected by the transition probabilities. In our experiment, HMMER is used as a black box except the constraints on choosing match states are made tighter. Using default settings, HMMER creates a match state whenever a column in the MSA has <50% gaps. We found empirically in Kumar and Cowen (2009) that the default cutoff was not optimal for our datasets because homology was too remote, and creating a column whenever there are <20% gaps yielded the best HMMs on our datasets. Thus we duplicate this threshold in the current study.
By default, HMMER uses a maximum a posteriori (MAP) architecture algorithm to find the model architecture with the highest posterior probability for the alignment data. The algorithm is guaranteed to find a model and constructs the model by assuming that the MSA is correct and then marks columns that correspond to match states. An HMM is created for every MSA, thus there is a one to one correspondence between an MSA and an HMM, generating a library of HMMs. Therefore, for any sequence from the MSA, the HMM can be used to determine if it belongs to the MSA. In addition, the HMM can be used to check if a new sequence is similar to the sequences in the MSA and if it is then one can place the new protein in the same family. We used the default ‘glocal’ setting to construct the models which are global with respect to model and find multiple hit local with respect to sequence.
In order to reduce the skewness in the distribution of sequences used to construct an HMM, HMMER supports several options to weight the sequences in training data. The default option GSC assigns lower weights to sequences that are over-represented (Gerstein et al., 1994). In addition, HMMER supports external and internal sequence weighting strategies based on information theoretic principles. Based on our study of different sequence weighting options for HMMs with and without the point mutation augmented training for the task of learning SCOP superfamilies (Kumar and Cowen, 2009) we used SAM sequence entropy (Karplus et al., 1998) throughout the present study.
3.5 HMM scoring
Once an HMM is build from an MSA, a new sequence can be scored by the HMM. The score (S) is the log of the probability of observing the sequence from a HMM divided by the probability of observing the same sequence from the ‘null hypothesis’ model or HMM.
P(seq|HMM) is the probability of the target sequence according to a HMM and P(seq|null) is the probability of the target sequence given a ‘null hypothesis’ model of the statistics of random sequence. In HMMER, this null model is a simple one-state HMM that says that random sequences are independently and identically distributed sequences with a specific residue composition. In addition, HMMER also generates an E-value which is the expected number of false positives with a score as high as the hit sequence. While the log odd scores (S) provides information on the quality of a hit, the E-value gives a measure relative to other sequences. Therefore a lower E-value implies that the sequence matches more closely to the HMM.
After constructing an HMM, a cutoff for the score (S), or E-value, is set. A new sequence that lies within the cutoff is said to belong to the family that is associated with the HMM. Thus by varying the cutoff, the true positive and false positive rates of the classifier can be tuned. We run experiments over a range of cutoffs to generate receiver operating characteristics (ROC) plots that graph the tradeoffs of the true and false positives, as the cutoffs are tuned. We also compute the area under the ROC curve (AUC) to summarize the classifier statistic in a single number (Sonego et al., 2008).
We also use average errors at minimum error point (MEP) statistics to assess the performance of HMMs. An MEP is the score threshold at which the classifier makes fewest errors of both kinds, i.e. false positives and false negatives (Karchin et al, 2002). The percentage of both types of errors provides a comparison of both sensitivity and specificity.
3.6 HMM stability
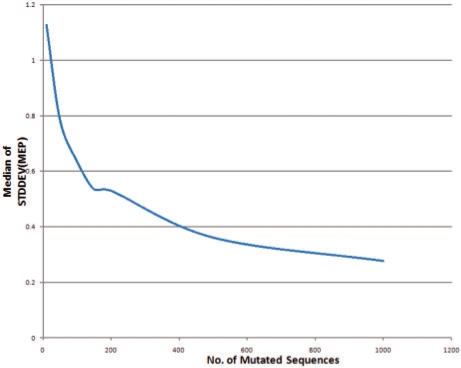
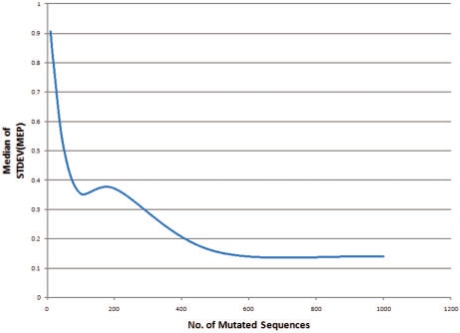
Because our method for augmenting the training data is randomized there is a legitimate concern that any reported result might vary each time the algorithm is run. While results will in fact vary, in fact the variation decreases as N and M grow larger. We refer to the variation between different runs of the algorithm as the stability of the procedure and we empirically experimented with different values of N and M in order to ensure sufficiently consistent results. We augmented the training set with 10, 50, 100, 200, 500 and 1000 mutated sequences for each original sequence in the training set, for both pointwise and pairwise mutation models. We generated the augmented training set 40 times at 20% mutation rate for each protein family in our training set with a different random seed and constructed the HMMs as described above. For each HMM, we computed the MEP for each iteration. Figure 2 shows the variation in the SD of the MEP for the single mutation model, and Figure 3 shows the variation in the SD of the MEP for the pairwise mutation model. Based on these results we set N and M to each be 150 in this artilcle.
Fig. 2.
Variation in SD of MEP for HMM training augmented with 10–100 sequences based on the point mutation model.
Fig. 3.
Variation in SD of MEP for HMM training augmented with 10–1000 sequences based on pairwise β-sheet mutation model.
4 RESULTS
As described in Section 3.1, our dataset consisted of the 41 SCOP families from the ‘mainly beta’ section of SCOP hierarchy, each of which had at least 10 structures, after filtering at the 95% sequence identity level and for which between 1 and 50 sequences in their associated SCOP superfamily but outside the SCOP family existed. In each of the 41 cases, the training set was derived from the training sequences from the SCOP family, and the test set consisted of the sequences outside the SCOP family from the same SCOP superfamily (the positive examples) as well as an equal number of decoy sequences chosen randomly from outside the associated SCOP fold (the negative examples).
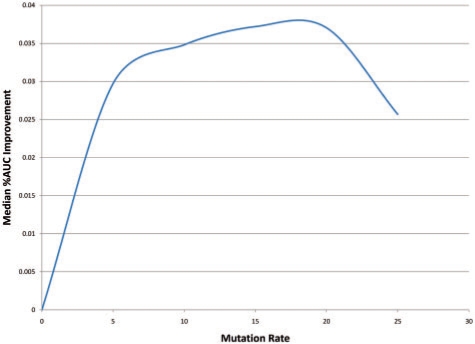
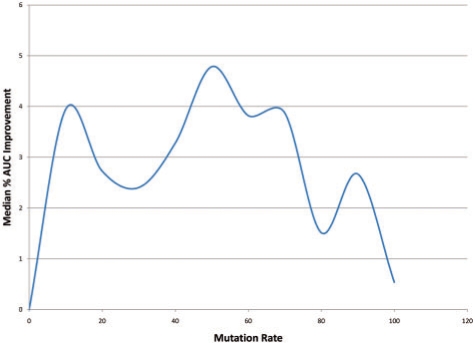
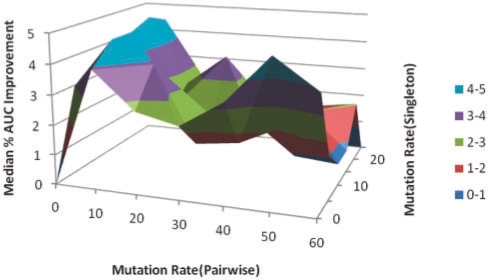
For each SCOP family in the training set, we trained an ordinary HMM model and plotted the ROC curve and calculated the AUC for this task. Over all 41 families, the median AUC was 69%. We then augmented the training set with the point mutation model (Fig. 4), our new pairwise β-sheet model (Fig. 5) and using training sequences generated from both models simultaneously (Fig. 6). Figure 4 displays how the median AUC varies with the pointwise mutation rate. Similar to Kumar and Cowen, 2009, the median AUC improves by training set augmented with simulated evolution all the way up to just above a 15% mutation rate, which gives a median AUC improvement of 3.72%. When we look at the same statistics for the pairwise mutation model in Figure 5, the results are less linear with a peak 3.94% improvement at the 10% mutation rate and maximum median AUC improvement of 4.79%. Combining both types of augmented data it is the first peak of pairwise mutations combined with pointwise mutation rate of 15% that give the maximum median AUC for our experiment, an AUC improvement of 4.95%. However, the variance in different runs of this randomized procedure might mean that the best setting is sometimes here and sometimes closer to the second highest peak in Figure 6 (around 50% pairwise mutations).
Fig. 4.
Median percent AUC improvement with mutation rate for HMMs trained with pointwise mutations. The maximum median improvement is 3.72% at 15% mutation rate.
Fig. 5.
Median percent AUC improvement with mutation rate for HMMs trained SAM with pairwise mutations. The maximum median improvement is 4.79% at 50% mutation rate.
Fig. 6.
Median percent AUC improvement with mutation rate for HMMs trained with and dataset augmented with combined pointwise and pairwise mutations. The maximum median improvement is 4.95% at pairwise mutation rate of 10% and pointwise mutation rate of 15%.
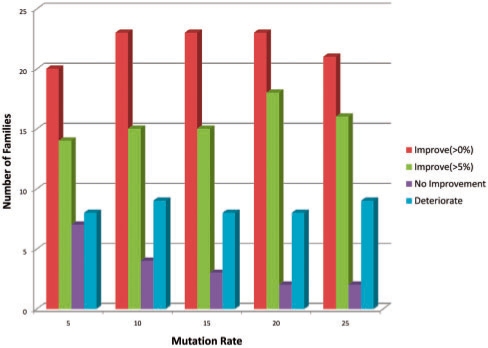
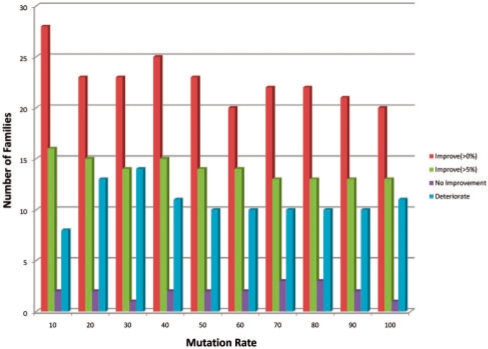
Finally in Figures 7 (pointwise) and 8 (pairwise), we break down the increase and decrease in AUC as a function of mutation rate family by family. Most families show some positive increase in AUC in all augmented training models, but for around a fifth of the families performance degrades for the pointwise mutation model. The non-linearity in the median AUC as a function of mutation rate in the pairwise mutation model is partially explained by examining the proportion of families where performance improves versus degrades in Figure 8. In particular, performance degrades for <25% of the families at the 10% pairwise mutation rate, but this jumps up to 25% or more thereafter. Meanwhile the families where AUC improves with pairwise mutations shows a peak improvement level between 40 and 50% mutation rate.
Fig. 7.
Distribution of families with improved performance for pointwise mutation model.
Fig. 8.
Distribution of families with improved performance for pairwise mutation model.
It would be nice if there was a biological characterization of what families will have improved versus degraded AUC with pairwise mutated augmented training data. However, in this study, the biological variation is almost certainly swamped by the variation we see due to the different extent varying families within the same superfamily are represented among solved structures in the PDB and hence the size and diversity of our test sets, as well as the difficulty of the different random decoy structures that were chosen when we constructed our datasets. Although the present study cannot therefore address exactly how to tune mutation rate parameters on a per family level, it is clear from our results that out pairwise mutation model is successful in improving the detection of remote homologs of β-structural motifs. While we cannot make any strong conclusions, we did find, as a general rule, that the pairwise mutations helped the most when there was the smallest diversity in the training sequences at a family level, that is, when there were the fewest number of known families for a given superfamily.
5 DISCUSSION
We have shown how pairwise dependencies in β-sheets can be incorporated into an augmented HMM training set using simulated evolution, resulting in improved recognition of β-structural motifs. Our datasets, augmented training sets, and our HMMs are all available online at http://bcb.cs.tufts.edu/pairwise/.
In the present work, it was assumed that the structural information was available for sequences in the training set; thus structural information was used to construct the multiple sequence alignment, to locate β-strands, and to determine how the β-strands were hydrogen bonded into β-sheets. However, ordinary HMMs and our earlier, simpler, point mutation model of simulated evolution require only sequence information, not structure. Extending our work to the case where no solved protein strcuture is known is an interesting open question. Secondary-structure prediction programs (Rost, 2001) could be used to find β-strands, but determining how they are paired and hydrogen bonded is a much more difficult issue. Computationally predicting how β-strands are paired in the absence of structural information is a well-studied problem since 1995 (Cheng and Baldi, 2006; Hubbard and Park, 1995; Jeong et al., 2007; Steward and Thornton, 2002; Zhu and Braun, 1999). Recent work that has tried to computationally model transmembrane β-barels (Waldispuhl et al., 2008) and β-amyloids (Bryan et al., 2009) without a structural template may also be relevant.
ACKNOWLEDGEMENTS
The authors thank Matt Menke for help with SmurfParse. They thank Michael Baym, Noah Daniels and Charlie O′Donnell for helpful discussions.
Funding: National Institutes of Health grant 1R01GM080330-01A1 (to L.C.).
Conflict of Interest: none declared.
REFERENCES
- Am Busch MS, et al. Computational protein design as a tool for fold recognition. Proteins: Struct. Funct. Bioinformatics. 2009;77:139–158. doi: 10.1002/prot.22426. [DOI] [PubMed] [Google Scholar]
- Bradley P, et al. Betawrap: successful prediction of parallel β-helices from primary sequence reveals an association with many microbial pathogens. Proc. Natl. Acad. Sci. USA. 2001;98:14819–14824. doi: 10.1073/pnas.251267298. [DOI] [PMC free article] [PubMed] [Google Scholar]
- Bryan AW, et al. BETASCAN: probable β-amyloids identified by pairwise probabilistic analysis. PLoS Comput. Biol. 2009;5:e1000333. doi: 10.1371/journal.pcbi.1000333. [DOI] [PMC free article] [PubMed] [Google Scholar]
- Chandonia JM, et al. The ASTRAL compendium in 2004. Nucleic Acids Res. 2004;32:D189–D192. doi: 10.1093/nar/gkh034. [DOI] [PMC free article] [PubMed] [Google Scholar]
- Cheng J, Baldi P. A machine learning information retrieval approach to protein fold recognition. Bioinformatics. 2006;22:1456–1463. doi: 10.1093/bioinformatics/btl102. [DOI] [PubMed] [Google Scholar]
- Cowen L, et al. Predicting the beta-helix fold from protein sequence data. J. Comput. Biol. 2002;9:261–276. doi: 10.1089/10665270252935458. [DOI] [PubMed] [Google Scholar]
- Eddy S. Profile hidden Markov models. Bioinformatics. 1998a;14:755–763. doi: 10.1093/bioinformatics/14.9.755. [DOI] [PubMed] [Google Scholar]
- Eddy S. 1998b. [last accessed date January 7, 2010]. http://hmmer.janelia.org/ [Google Scholar]
- Eddy S. Where did the BLOSUM62 alignment score matrix come from? Nature Biotechnol. 2004;22:1035. doi: 10.1038/nbt0804-1035. [DOI] [PubMed] [Google Scholar]
- Eddy S. A probabilistic model of local sequence alignment that simplifies statistical significance estimation. PLoS Comput. Biol. 2008;4:e1000069. doi: 10.1371/journal.pcbi.1000069. [DOI] [PMC free article] [PubMed] [Google Scholar]
- Edgar RC. MUSCLE: multiple sequence alignment with high accuracy and high throughput. Nucleic Acids Res. 2004;32:1792–1797. doi: 10.1093/nar/gkh340. [DOI] [PMC free article] [PubMed] [Google Scholar]
- Finn RD, et al. Pfam: clans, web tools and services. Nucleic Acids Res. 2006;34:D247–D251. doi: 10.1093/nar/gkj149. [DOI] [PMC free article] [PubMed] [Google Scholar]
- Gerstein M, et al. Volume changes in protein evolution. J. Mol. Biol. 1994;236:1067–1078. doi: 10.1016/0022-2836(94)90012-4. [DOI] [PubMed] [Google Scholar]
- Hubbard T, Park J. Fold recognition and ab initio structure predictions using hidden Markov models and beta-strand pair potentials. Proteins. 1995;3:398–402. doi: 10.1002/prot.340230313. [DOI] [PubMed] [Google Scholar]
- Hughey R, Krogh A. Hidden Markov models for sequence analysis: extension and analysis of the basic method. Comput. Appl. Biosci. 1996;12:95–107. doi: 10.1093/bioinformatics/12.2.95. [DOI] [PubMed] [Google Scholar]
- Hulo N, et al. The PROSITE database. Nucleic Acids Res. 2006;34:D227–D230. doi: 10.1093/nar/gkj063. [DOI] [PMC free article] [PubMed] [Google Scholar]
- Jeong JK, et al. Workshop on Algorithms for Bioinformatics. Vol. 4645. WABI 2007, Lecture Notes in Bioinformatics 4645; 2007. Bringing folding pathways into strand pairing prediction; pp. 38–49. [Google Scholar]
- Karchin R, et al. Classifying G-protein coupled receptors with support vector machines. Bioinformatics. 2002;18:147–159. doi: 10.1093/bioinformatics/18.1.147. [DOI] [PubMed] [Google Scholar]
- Karplus K, et al. Hidden Markov models for detecting remote protein homologies. Bioinformatics. 1998;14:846–856. doi: 10.1093/bioinformatics/14.10.846. [DOI] [PubMed] [Google Scholar]
- Koehl P, Levitt M. De novo protein design. II. plasticity in sequence space. J. Mol. Biol. 1999;293:1183–1193. doi: 10.1006/jmbi.1999.3212. [DOI] [PubMed] [Google Scholar]
- Kumar A, Cowen L. Augmented training of hidden Markov models to recognize remote homologs via simulated evolution. Bioinformatics. 2009;25:1602–1608. doi: 10.1093/bioinformatics/btp265. [DOI] [PMC free article] [PubMed] [Google Scholar]
- Larson S, et al. Increased detection of structural templates using alignments of designed sequences. Proteins: Struct. Funct. Genetics. 2003;51:390–396. doi: 10.1002/prot.10346. [DOI] [PubMed] [Google Scholar]
- Lifson S, Sander C. Specific recognition in the tertiary structure of β-sheets of proteins. J. Mol. Boil. 1980;139:627–629. doi: 10.1016/0022-2836(80)90052-2. [DOI] [PubMed] [Google Scholar]
- Liu Y, et al. Conditional graphical models for protein structural motif recognition. J. Comput. Biol. 2009;16:639–657. doi: 10.1089/cmb.2008.0176. [DOI] [PubMed] [Google Scholar]
- Lo Conte L, et al. SCOP database in 2002: refinements accommodate structural genomics. Nucleic Acid Res. 2002;30:264–267. doi: 10.1093/nar/30.1.264. [DOI] [PMC free article] [PubMed] [Google Scholar]
- Menke M. Computational approaches to modeling the conserved structural core among distantly homolgous proteins. Massachusetts: PhD Thesis, MIT; 2009. [Google Scholar]
- Menke M, et al. Matt: local flexibility aids protein multiple structure alignment. PLoS Comput. Biol. 2008;4:88–99. doi: 10.1371/journal.pcbi.0040010. [DOI] [PMC free article] [PubMed] [Google Scholar]
- Menke M, et al. Markov random fields reveal an N-terminal double beta-propeller motif as part of a bacterial hybrid two-component sensor system. Proc. Natl. Acad. Sci. USA. 2010;107:4069–4074. doi: 10.1073/pnas.0909950107. [DOI] [PMC free article] [PubMed] [Google Scholar]
- Olmea O, et al. Effective use of sequence correlation and conservation in fold recognition. J. Mol. Biol. 1999;293:1221–1239. doi: 10.1006/jmbi.1999.3208. [DOI] [PubMed] [Google Scholar]
- Rost B. Review: protein secondary structure prediction continues to rise. J. Struct. Biol. 2001;134:204–218. doi: 10.1006/jsbi.2001.4336. [DOI] [PubMed] [Google Scholar]
- Sonego P, et al. ROC analysis: applications to the classification of biological sequences and 3D structures. Briefings in Bioinformatics. 2008;9:199–209. doi: 10.1093/bib/bbm064. [DOI] [PubMed] [Google Scholar]
- Steward RE, Thornton JM. Prediction of strand pairing in antiparallel and parallel β-sheets using information theory. Proteins: Struct. Funct. Bioinformatics. 2002;48:178–191. doi: 10.1002/prot.10152. [DOI] [PubMed] [Google Scholar]
- Waldispuhl J, et al. Modeling ensembles of transmembrane beta-barrels proteins. Proteins: Struct. Funct. Bioinformatics. 2008;71:1097–1112. doi: 10.1002/prot.21788. [DOI] [PubMed] [Google Scholar]
- Wilson D, et al. The SUPERFAMILY database in 2007: families and functions. Nucleic Acids Res. 2007 doi: 10.1093/nar/gkl910. D308-D313. [DOI] [PMC free article] [PubMed] [Google Scholar]
- Wistrand M, Sonnhammer E.LL. Improving profile HMM discrimination by adapting transition probabilities. J. Mol. Biol. 2004;338:847–854. doi: 10.1016/j.jmb.2004.03.023. [DOI] [PubMed] [Google Scholar]
- Zhu H, Braun W. Sequence specificity, statistical potentials and 3D structure prediction with self-correcting distance geometry calculations of beta-sheet formation in proteins. Protein Sci. 1999;8:326–342. doi: 10.1110/ps.8.2.326. [DOI] [PMC free article] [PubMed] [Google Scholar]


