

Abstract
STUDY DESIGN
Secondary analysis.
OBJECTIVE
To investigate the Fear-Avoidance Beliefs Questionnaire (FABQ) for its ability to predict 6-month outcomes in patients with low back pain (LBP) participating in physical therapy clinical trials.
BACKGROUND
Consistent evidence suggests that fear-avoidance beliefs are predictive of short-term outcomes for patients with LBP. However, proposed cut-off scores have not been widely investigated for longer-term outcomes in samples of patients receiving physical therapy.
METHODS AND MEASURES
Subjects (n = 160) were participants in 2 separate randomized trials that used standard methodology and investigated the efficacy of physical therapy interventions for LBP. Subjects completed baseline measures of pain, disability, fear-avoidance beliefs, and physical impairment. They completed 4 weeks of randomly assigned physical therapy and were reassessed at 6 months with standard examination techniques. The accuracy of previously proposed cut-offs for elevated FABQ scores were determined by independent t tests and chi-square analysis on raw 6-month Oswestry Disability Questionnaire (ODQ) scores, 6-month ODQ change scores, and minimally clinical important difference (MCID) in ODQ scores (6 points). Next, a hierarchical regression model determined which FABQ scale better predicted 6-month ODQ scores after controlling for previously reported prognostic factors and relevant treatment parameters. Last, receiver operating characteristic curve analyses were planned to generate a range of FABQ cut-off scores that predicted 6-month MCID in the ODQ.
RESULTS
The previously reported cut-off score for the FABQ physical activity scale (>14) resulted in 111 (69.4%) of 160 patients being classified as having elevated baseline scores, while the previously reported cut-off score for the FABQ work scale (>29) resulted in 19 (11.9%) of 160 patients being classified as having elevated baseline scores. Patients with elevated FABQ physical activity scale scores (>14) had no significant differences in 6-month ODQ outcomes. Patients with elevated FABQ work scale scores (>29) reported higher 6-month ODQ scores, but were not more likely to have differences in improvement in ODQ outcomes. The final regression model explained 24.4% of the variance in 6-month ODQ scores, with only manipulation and exercise and the FABQ work scale as unique predictors. Fifteen of the subjects (12.7%) had a 6-month change in ODQ that indicated no improvement. The area under the receiver operating characteristic curve for the FABQ physical activity scale predicting this outcome was 0.562 (95% CI: 0.415-0.710) and for the FABQ work scale was 0.694 (95% CI: 0.542-0.846). Cut-off scores were explored for the FABQ work scale only, with positive likelihood ratios that ranged from 1.19 to 5.15 and negative likelihood ratios that ranged from 0.30 to 0.83.
CONCLUSIONS
The FABQ work scale was the better predictor of self-report of disability in this sample of patients participating in physical therapy clinical trials. Future studies are necessary to further test and refine the FABQ work scale as a screening tool alone, and in combination with other examination findings.
LEVEL OF EVIDENCE
Prognosis, Level 2b.
Keywords: disability, FABQ, Oswestry, prognosis
Psychosocial and psychological factors appear to play an important role in the maintenance and development of chronic disability from low back pain (LBP).29,32,33 As a result, LBP disability prevention strategies have stressed the early identification of certain psychosocial and psychological factors (ie, secondary prevention).11,21,30 The Fear-Avoidance Model of Musculoskeletal Pain describes a specific psychosocial factor relevant to the development of chronic LBP.27
The fear-avoidance model of musculoskeletal pain was originally proposed by Lethem et al28 and later modified by Vlaeyen et al.40,41 With this model it is proposed that an individual’s response to an episode of LBP falls along a continuum ranging from avoidance (maladaptive) to confrontation (adaptive). In this model, fear-avoidance beliefs are a primary factor determining whether an individual utilizes an avoidance or confrontation strategy. Fear-avoidance beliefs are measured by a validated self-report questionnaire developed by Waddell et al,42 the Fear-Avoidance Beliefs Questionnaire (FABQ). The FABQ contains 2 scales, a 7-item scale assessing fear-avoidance beliefs about work (FABQ work scale; score range, 0-42) and a 4-item scale assessing fear-avoidance beliefs about physical activity (FABQ physical activity scale; score range, 0-24). Higher scores on the FABQ work scale and FABQ physical activity scale indicate that the individual has elevated fear-avoidance beliefs.
In cross-sectional studies of patients with chronic LBP, the FABQ has demonstrated a positive association with disability and work loss.5,17,42 For example, Crombez et al5 reported statistically significant correlations between disability and the FABQ physical activity scale (r = 0.51) and FABQ work scale (r = 0.61) for patients with chronic LBP. In longitudinal studies of patients with acute LBP, elevated FABQ scores have also been predictive of future disability and work loss.13,36 For example, Fritz et al,13 after controlling for initial pain, disability, and treatment, reported that the baseline FABQ work scale score accounted for additional variance in predicting 4-week disability and work status outcomes for patients with acute occupational LBP.
Despite consistent empirical support for the validity of the FABQ, the determination of what score represents “elevated” fear-avoidance beliefs has largely been unexplored. An early investigation by Burton et al3 involving patients with LBP seeking treatment from primary care or osteopathic physicians determined elevated scores (FABQ physical activity scale, >14) based on a median split of the FABQ. In that study, elevated FABQ scores were determined solely on the distribution of FABQ data. This means that while elevated FABQ physical activity scale scores were defined as being greater than the median, such scores do not necessarily represent an increased probability of developing chronic LBP.
Elevated FABQ scores have been investigated in a cohort of patients with acute, work-related LBP injury seeking physical therapy treatment.12 This study used return to work as the external criterion to determine elevated FABQ scores. Fritz and George12 reported that the FABQ work scale was the strongest individual predictor of return to work, when compared to other relevant factors like FABQ physical activity scale or validated measures of depression, pain intensity, and physical impairment. Receiver operating characteristic (ROC) curve analysis was used to generate a proposed cut-off score for elevated fear-avoidance beliefs that minimized the negative likelihood ratio (FABQ work scale, >29; negative likelihood ratio, 0.08).12 This approach offered a cut-off for elevated FABQ work scale scores; however, its use may be most appropriate only for patients with occupational LBP.
Al-Obaidi et al1 investigated elevated FABQ scores for a cohort of patients with more than 2 months of LBP who were not receiving worker’s compensation benefits. This study used clinically meaningful improvements in a validated self-report questionnaire as the external criterion to determine elevated FABQ scores. Al-Obaidi et al1 reported that baseline FABQ physical activity scale scores were predictive of patients not experiencing a clinically meaningful improvement after a 10-week exercise program for lumbar extensor strengthening. However, interpretation of elevated scores (FABQ physical activity scale, ≥29; positive likelihood ratio, 3.78) from this study is difficult because the authors used all 5 items to score the FABQ physical activity scale instead of only 4 as recommended by Waddell et al.42
The previously cited studies provide general support for the FABQ to predict 4- and 10-week outcomes for patients with LBP. However, there are still important, unresolved issues that limit the use of the FABQ in physical therapy settings. First, the previously reported cut-off scores have not been investigated in independent samples of patients receiving physical therapy. Second, which FABQ scale is appropriate for screening in general physical therapy settings (ie, those without occupational or workrelated LBP) has not been established. Third, although the literature supporting the predictive validity of the FABQ is robust for shorter-term outcomes, there is conflicting evidence that the FABQ is predictive of longer-term outcomes. For example, Turner et al39 reported that the averaged response from 2 FABQ items was predictive of 6-month work disability in a multivariate model that included pain, disability, demographic factors, and other psychosocial factors. In contrast, Werneke and Hart44 have reported that, while the FABQ work scale alone was predictive of work status at 1 year, it did not remain a significant predictor of 1-year work status in a multivariate model that included pain pattern classification.
Therefore, we believe additional studies investigating FABQ cut-off scores specific to physical therapy settings are warranted and this secondary analysis of data investigated the FABQ as a predictor of future disability. Our primary hypothesis was that the FABQ would be a unique predictor of longer-term self-report of disability in this cohort of patients with LBP enrolled in physical therapy clinical trials. Our first purpose was to investigate whether previously reported FABQ cut-off scores were associated with differences in 6-month outcomes. Our second purpose was to determine which FABQ scale was the better predictor of 6-month outcomes after excluding patients with occupational LBP and controlling for relevant prognostic factors and treatment parameters. Our third purpose was to investigate the sample-specific performance of the FABQ in predicting clinically meaningful outcomes at 6 months.
METHODS
Subjects
This secondary analysis includes data from 2 randomized trials involving common methodologies. Both trials included patients that were (1) recruited from outpatient physical therapy clinics and (2) received physical therapy for 4 weeks. One of the trials recruited patients from outpatient physical therapy clinics in a large urban area,16 while patients in the second trial were recruited mostly from within outpatient military healthcare clinics.4 Both trials used the same standard methods to collect demographic and clinical information. Patients enrolled in the trials received randomly assigned physical therapy interventions including various forms of active exercise and/or manipulation. Patients were reassessed on LBP disability 4 weeks and 6 months later. Both trials received approval from The University of Pittsburgh Institutional Review Board, and all subjects provided informed consent before enrolling in the respective studies.
Patients were recruited into the clinical trials if they were between the ages of 18 and 55 years, reported LBP and/or leg pain, and were English speaking. Patients were excluded from the clinical trials if they had clinical examination signs consistent with nerve root compression, had undergone low back surgery in the previous 6 months, were diagnosed with spinal tumor, fracture, or osteoporosis, or were pregnant. A total of 198 patients participated in the clinical trials and 38 patients were excluded from this secondary analysis for either having occupational LBP defined as report of injury occurring at or a result of work (n = 4) or having received a physical therapy supplement specifically designed to reduce fear-avoidance beliefs (n = 34).
Of the 160 subjects included in this analysis, 131 (81.9%) patients were from the study by Childs et al,4 and 29 (18.1%) were from the study by George et al.16 Patients excluded did not significantly (P>.05) differ from patients included in this analysis on sex distribution, pain disability, and FABQ scores. Patients excluded from this analysis were significantly (P<.05) older (38.8 versus 34.8 years of age), had lower pain intensity ratings (4.5 versus 5.4), and higher total lumbar flexion (83.3° versus 72.7°) than patients included in this analysis.
Measures
All patients received a standard baseline examination for collection of demographic (age, sex, duration and location of symptoms, and prior history of LBP) and clinical characteristics (physical impairment, pain intensity, pain disability, and fear-avoidance beliefs). The baseline values for all of these measures are summarized in TABLE 1.
TABLE 1.
Descriptive Data for Pooled Clinical Trials
| Variable | Total Sample (n = 160) |
|---|---|
| Age, mean y (SD) | 34.6 (10.5) |
| Sex, n female (%) | 71 (44.4%) |
| Symptom duration, median d (interquartile range) | 26.5 (11.0-55.0) |
| Leg pain with LBP, n (%) | 74 (46.3%) |
| Total lumbar flexion range of motion, mean deg (SD) | 83.1 (28.1) |
| FABQ work scale score (range, 0-42), mean (SD) | 16.2 (10.5) |
| FABQ physical activity scale (range, 0-24), mean (SD) | 16.6 (4.6) |
| Pain intensity (range, 0-10), mean (SD) | 5.4 (2.1) |
| Disability (range, 0-100%), mean (SD) | 40.2 (11.2) |
| Treatment received, n (%)* | |
| Manipulation and exercise | 79 (49.4%) |
| Stabilization exercise | 68 (42.5%) |
| Direction-specific exercise | 10 (6.3%) |
| Number of therapy appointments (4 weeks), mean (SD) | 6.6 (2.8) |
| Time until 6-month follow-up examination, mean d (SD) | 194.0 (29.5) |
Abbreviation: FABQ, Fear-Avoidance Beliefs Questionnaire.
This information was missing for 3 subjects.c
All demographic information was obtained through a standard questionnaire. The clinical information was collected through a standard physical examination or by validated self-report questionnaires. Specifically, physical impairment was assessed through measurement of total flexion range of motion using a single inclinometer technique with high reliability.43 Current pain intensity was assessed using a numeric rating scale ranging from 0 (no pain) to 10 (extremely intense). This method of pain assessment has previously demonstrated acceptable reliability and validity in the literature.24,34 Pain disability was assessed with the modified Oswestry Disability Questionnaire (ODQ).9 The ODQ was modified from the original by substituting a section regarding employment/homemaking ability for the section related to sex life. The ODQ has been found to have high levels of test-retest reliability, validity, and responsiveness,9,14,35 and is recommended as a primary outcome measure of self-report of disability for patients with LBP.6
The FABQ was used to assess fear-avoidance beliefs (APPENDIX).42 The FABQ contains 2 scales, a 7-item FABQ work scale (score range, 0-42) and a 4-item FABQ physical activity scale (score range, 0-24). These FABQ scales have been found to have acceptable reliability.23,31,36,42 Specifically, the FABQ has demonstrated a Cronbach alpha of .93 for the questionnaire as a whole, .71 to .88 for the FABQ work scale, and .70 to .83 for the FABQ physical activity scale.26,36-38,42 Forty-eight-hour test-retest reliability for the FABQ has been reported with a Pearson r of 0.91 to 0.95 for the FABQ work scale and 0.84 to 0.88 for FABQ physical activity scale.36,42 The FABQ has demonstrated validity by being predictive of disability and work loss in patients with LBP.12,13,36
This manuscript represents the first time the data from the clinical trials have been pooled to investigate specific cut-off scores associated with the FABQ. Data from the George et al16 clinical trial have been used in 2 previously reported secondary analyses related to the FABQ. In one secondary analysis, baseline FABQ scores and the presence of the centralization phenomenon were used to predict 6-month pain and disability outcomes for a subgroup of patients (n = 28) classified for specific exercise intervention.15 Eleven of the 28 patients previously reported are used in the current secondary analysis. In the other secondary analysis, change in FABQ physical activity scale scores was used to predict 4-week changes in pain and disability after controlling for changes in lumbar flexion and pain intensity, respectively (n = 63).18 Twenty-nine of the 63 patients previously reported are used in the current secondary analysis. Neither of these previously reported analyses involved calculation of FABQ cut-off scores. Data from the Childs et al4 clinical trial have not been previously used for secondary analyses related to calculation of FABQ cut-off scores.
Procedure
Patients completed 4 weeks of randomly assigned physical therapy intervention after the baseline assessment. All patients received physical therapy interventions that consisted of some form of active exercise, although the specific content of each intervention differed. Subjects (n = 34) were excluded from this analysis if they received behavioral interventions designed to specifically reduce fear-avoidance beliefs. Therefore, the 3 categories of physical therapy intervention were manipulation with exercise, lumbar strengthening and stabilization exercise, and direction-specific exercise biased towards lumbar extension or flexion. The ODQ was readministered 4 weeks and 6 months following random assignment of physical therapy. Treatment related parameters are summarized in TABLE 1.
Data Analysis
All data analyses were performed on SPSS, Version 13.0 at an alpha level of .05. Whether the physical therapy interventions were associated with differences in 6-month ODQ outcomes was determined by analysis of variance (ANOVA). If appropriate, any observed 6-month ODQ outcome differences that were attributed to intervention category were accounted for in the subsequent regression analysis. Baseline FABQ scores were dichotomized from previously reported cut-off scores for the FABQ physical activity (>14) and work (>29) scales. The cut-off score from the Al-Obaidi et al1 study was not included in this analysis because of aforementioned scoring difference in the FABQ. Six-month ODQ change scores were also associated with minimally clinical important difference (MCID) status that was previously reported for the ODQ (6-point change).2,14 Subjects were dichotomized into groups of (a) “improved” (a change of 6 points or greater in ODQ) or (b) “not improved” (a change of less than 6 points in ODQ).
Assessment of Previously Reported Eevated FABQ Scores (Purpose 1)
Mean differences for groups defined by previously reported FABQ physical activity and work scale cut-off scores were investigated by independent t tests for raw 6-month ODQ scores and 6-month ODQ change scores. Further, the association between baseline FABQ cut-off scores and 6-month improvement status was explored with chi-square analysis.
Prediction of 6-Month ODQ Scores (Purpose 2)
A hierarchical regression model with 6-month ODQ scores as the dependent variable was created and the first block included baseline ODQ scores, pain intensity scores, and total lumbar flexion (degrees). The second block included prognostic factors that have been previously highlighted in the literature and included duration of LBP, presence of LBP and leg pain, and previous episodes of LBP. The third block included any treatment parameters that significantly influenced 6-month ODQ scores. Finally, the fourth block of the regression model included only FABQ physical activity and work scale scores.
Sample-Specific Performance of FABQ in Predicting 6-Month ODQ Scores (Purpose 3)
ROC curve analysis was used to determine if the FABQ significantly predicted 6-month ODQ scores.7,8 Area under the ROC curve was calculated with a nonparametric method that did not require normal distribution of clinical outcome.19 The area under the ROC curve is interpreted as the probability of correctly identifying subjects that had 1 MCID improvement at 4 weeks. The range of area under the ROC curve scores are from 0.5 (no better than chance identification) to 1.0 (perfect identification).20
Cut-off scores were then calculated for an individual FABQ scale for predicting 6-month outcome, but only if the individual FABQ scale was associated with diagnostic accuracy of more than 50% area under the ROC curve when the lower bound of the 95% confidence interval was considered. This criterion was selected because it indicated the FABQ likely predicted 6-month outcome status at better than chance rates. Cut-off scores were determined by calculating sensitivity, specificity, and likelihood ratios for each potential cut-off score. This analytical technique to determine cut off scores for the FABQ has been previously reported in the rehabilitation literature.12 The specific goal of the generated cut-off score was to maximize the positive likelihood ratio, or the ratio of true positives to false positives. We selected this screening criterion, instead of one that only maximized the true positive rate, because patients with elevated fear-avoidance beliefs benefited from an intervention specifically designed to reduce fear-avoidance beliefs, while patients with lower fear-avoidance beliefs fared worse from the same intervention.16 Therefore, we selected a criterion for the proposed cut-off score that took this relationship into consideration.
RESULTS
Descriptive statistics for the sample are reported in TABLE 1. The 6-month assessment was completed by 118 of the 160 (73.8%) patients, and there were no significant differences (P>.05) in sex distribution, baseline pain disability, or fear-avoidance beliefs for patients completing or not completing the 6-month assessment. However, patients that did not complete the 6-month assessment were significantly (P>.05) younger (31.0 versus 35.8 years old) and had higher baseline pain intensity ratings (6.0 versus 5.2). Patients receiving manipulation and exercise had lower 6-month ODQ scores (mean difference, 8.9; P>.05) and greater 6-month ODQ changes (mean difference, 10.1; P>.01) in comparison to patients receiving stabilization exercise. There were no differences in 6-month ODQ outcomes in patients receiving manipulation and specific exercise, or patients receiving stabilization and specific exercise (P>.15). Therefore, only manipulation and exercise was accounted for in the subsequent regression analysis.
At baseline, the previously reported cut-off score for the FABQ physical activity scale (>14) would have resulted in 111 (69.4%) of the 160 patients having elevated scores, while the previously reported cut-off score for the FABQ work scale (>29) would have resulted in 19 (11.9%) of the 160 patients having elevated scores. The evaluation of the previously reported FABQ cut-off scores and 6-month ODQ outcomes are reported in TABLE 2. Patients with elevated FABQ physical activity scores had no significant difference in the raw or change in 6-month ODQ scores, as well as the likelihood of experiencing 6-month improvement as defined by MCID. Patients with elevated FABQ work scale scores reported higher 6-month ODQ scores. However, there were no significant differences in 6-month ODQ change scores or likelihood of experiencing 6-month improvement, as defined by MCID based on the FABQ work scale cut-off score.
TABLE 2.
Six-Month Outcomes for Previously Reported FABQ Cut-off Scores
| 6-Month Variable | FABQPA >14 | FABQPA ≤14 | P Value* |
|---|---|---|---|
| ODQ score | 17.1 (16.3) | 12.1 (15.8) | .112 |
| ODQ change | 25.1 (15.5) | 24.6 (18.6) | .895 |
| Not improved | n = 11 | n = 4 | .623 |
| Improved | n = 69 | n = 34 |
| 6-Month Variable | FABQW >29 | FABQW ≤29 | P Value* |
|---|---|---|---|
| ODQ score | 26.9 (21.5) | 13.9 (14.8) | .003 |
| ODQ change | 20.1 (22.0) | 25.5 (16.9) | .270 |
| Not improved | n = 4 | n = 11 | .082 |
| Improved | n = 11 | n = 92 |
Abbreviations: FABQPA, Fear-Avoidance Beliefs Questionnaire physical activity scale; FABQW, Fear-Avoidance Beliefs Questionnaire work scale; improved, indicates equal to or greater than 1 MCID change in ODQ scores; not improved, indicates less than 1 MCID change in ODQ scores; ODQ, Oswestry Disability Questionnaire.
Reported P values are from independent t tests for ODQ raw and change scores and chi-square for the MCID analysis.
The first block of the regression model, containing baseline ODQ scores, pain intensity ratings, and total lumbar flexion, explained 7.6% of variance (P<.05) of 6-month ODQ scores. The second block, containing duration of LBP, presence of leg pain with LBP, and previous episodes of LBP, explained an additional 5.6% of variance (P = .08) of 6-month ODQ scores. The third block, containing manipulation and exercise, explained an additional 3.5% of variance (P<.05). The fourth block containing the FABQ scales explained an additional 7.7% of variance (P<.01) of 6-month ODQ scores. In the final model a total of 24.4% variance was explained with only manipulation and exercise and the FABQ work scale as unique predictors of 6-month ODQ scores (TABLE 3).
TABLE 3.
Baseline FABQW Score and Receiving Manipulation and Exercise Uniquely Predict 6-Month ODQ Scores
| Variables | R2 | B† | Beta† | P Value† |
|---|---|---|---|---|
| Final model (F9, 106 = 3.25) | 0.24 | <.001 | ||
| Baseline total lumbar flexion | −0.08 | −0.14 | .130 | |
| Baseline pain disability | 0.14 | 0.09 | .328 | |
| Baseline pain intensity | 0.60 | 0.08 | .396 | |
| Symptom duration | 0.01 | 0.08 | .347 | |
| Prior episodes of LBP | 5.45 | 0.16 | .068 | |
| Leg pain with LBP | 2.70 | 0.08 | .340 | |
| Received manipulation and exercise* | −6.16 | −0.19 | .030 | |
| FABQW* | 0.44 | 0.29 | .003 | |
| FABQPA | −0.03 | −0.01 | .934 |
Abbreviations: FABQPA, Fear-Avoidance Beliefs Questionnaire physical activity scale; FABQW, Fear-Avoidance Beliefs Questionnaire work scale; LBP, low back pain; ODQ, Oswestry Disability Questionnaire.
Indicates variable was unique predictor in final model.
Reported values are from the final model.
Fifteen (12.7%) of the 118 subjects had a 6-month change in ODQ score that was indicative of no improvement. The area under the ROC curve for the FABQ physical activity scale predicting this outcome was 0.562 (95% CI: 0.415-0.710) and for the FABQ work scale was 0.694 (95% CI: 0.542-0.846). The individual points on the ROC curve were then analyzed for the FABQ work scale only (FIGURE), because the 95% CI of the FABQ physical activity scale included 0.50. Likelihood ratios were then calculated for increment ranges of the FABQ work scale, along with cumulative percentage of subjects with those baseline scores. Positive likelihood ratios ranged from 1.19 to 5.15 and negative likelihood ratios ranged from 0.30 to 0.83 for the FABQ work scale (TABLE 4).
FIGURE.
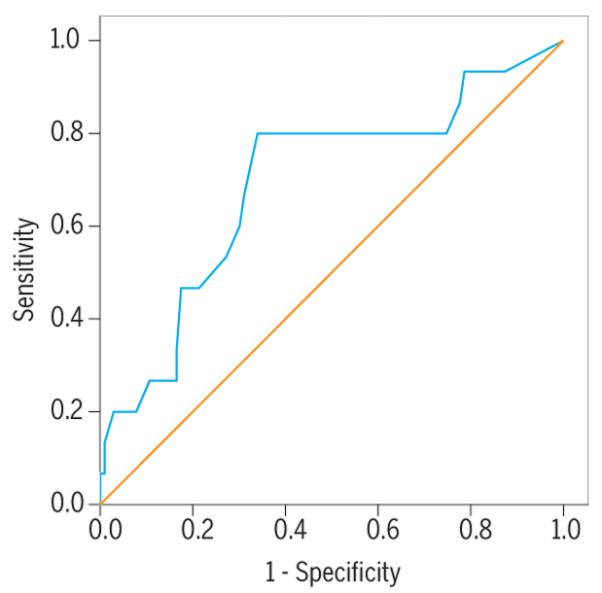
Receiver operating characteristic curve for baseline Fear-Avoidance Beliefs Questionnaire work scale score predicting minimally clinical important difference in 6-month Oswestry Disability Questionnaire scores.
TABLE 4.
Association of FABQW Scores and 6-Month Minimally Clinical Important Difference ODQ Scores for Patients Participating in These Clinical Trials
| Cut-off Threshold | Cumulative Percentage | +LR (95% CI) | −LR (95% CI) |
|---|---|---|---|
| FABQW >5 | 20.6% | 1.19 (1.04-1.34) | 0.31 (0.16-0.46) |
| FABQW >10 | 30.6% | 1.16 (1.01-1.31) | 0.64 (0.49-0.79) |
| FABQW >15 | 45.0% | 1.42 (1.27-1.57) | 0.46 (0.31-0.61) |
| FABQW >20 | 65.6% | 2.35 (2.20 -2.50) | 0.30 (0.15-0.45) |
| FABQW >25 | 83.1% | 2.67 (2.52-2.82) | 0.65 (0.50-0.80) |
| FABQW >30 | 90.6% | 2.50 (2.35-2.65) | 0.82 (0.67-0.97) |
| FABQW >35 | 95.6% | 5.15 (5.00-5.30) | 0.83 (0.68-0.98) |
| FABQW >40 | 99.4% | Insufficient data | Insufficient data |
Abbreviations: CI, confidence interval; FABQW, Fear-Avoidance Beliefs Questionnaire work scale; +LR, positive likelihood ratio; −LR, negative likelihood ratio; ODQ, Oswestry Disability Questionnaire.
DISCUSSION
This study investigated the FABQ as a predictor of 6-month ODQ scores in patients participating in physical therapy clinical trials. First, we demonstrated that a previously reported cut-off score for elevated FABQ physical activity scores did not result in significant differences in 6-month ODQ scores, while a previously reported cut-off score for elevated FABQ work scale scores did result in significant differences for raw 6-month ODQ scores. Second, our results suggested that the FABQ work scale was a unique predictor of 6-month ODQ scores, even when other prognostic factors, treatment parameters, and the FABQ physical activity scale were considered. These findings replicated previous longitudinal studies by demonstrating the FABQ work scale as a significant predictor of 4-week12,13 and 6-month outcomes.36 Third, we described the sample-specific performance of the FABQ work scale in distinguishing 6-month ODQ scores. The FABQ work scale as a better predictor is not an isolated finding, as it is in agreement with other studies investigating the predictive ability of FABQ scales. For example, the FABQ work scale was a better predictor of disability in a cross-sectional study of patients with chronic LBP,42 and was also included in the development of clinical prediction rules for manipulation10 and stabilization.22
The FABQ work scale as a better predictor of disability was an interesting finding because, unlike the previously cited studies, we specifically excluded patients with work-related LBP. Both FABQ scales measure the same theoretical construct (pain-related fear) and the results from this study could be explained by solely a statistical phenomenon if the FABQ work and physical activity scales were highly correlated. In this sample, however, the correlation between the 2 scales was statistically significant (P<.05), but the magnitude (r = 0.36) was too low for multicollinearity to be a serious concern.25 The FABQ work scale as a better predictor of future disability seems to be a particularly robust finding, especially when the results from previous studies10,12,22,39,42 are considered.
It was beyond the purposes of this secondary analysis to explore specific reasons for why the FABQ work scale was a better predictor of disability. However, the authors speculate that a potential reason may be that the FABQ scales have differing associations with factors that indirectly influence disability. Although each FABQ scale measures fear-avoidance beliefs, specific beliefs about work may have broad implications. It is conceivable that work beliefs would have a stronger influence on perceived social role factors that also have a potentially meaningful impact on disability. In contrast, specific beliefs about physical activity may have relatively narrow implications. If this were true, physical activity beliefs would have a weaker influence on social role factors, and less of an impact on disability. We believe this putative link between fear-avoidance beliefs and social roles may partially explain the stronger association of the FABQ work scale to ODQ scores. However, this explanation is speculative in nature and requires verification in future studies.
This secondary analysis also investigated the accuracy of several potential FABQ work scale cut-off scores specific to patients participating in these clinical trials. Our external criterion was the MCID for the ODQ,2,14 because the natural history of LBP is for improvement. We believe this to be a valid external criterion because it would be of clinical value for physical therapists to have early examination findings that accurately identify patients not likely to have at least minimal improvement over time. The reported cut-off scores indicated that FABQ work scale scores of greater than 20 have the potential to identify elevated scores, as they were associated with positive likelihood ratios ranging from 2.3 to 5.1. This means that patients with FABQ work scale scores of greater than 20 would be between 2 and 5 times as likely to experience no improvement at 6 months, when compared to those scoring below selected cut-off scores. The reported cut-off scores also indicated that the FABQ work scale might have utility for identifying patients likely to have improvement at 6 months. In this case, FABQ work scale scores of less than 5 were associated with negative likelihood ratio of 0.31, indicating that patients with those scores would be 3 times as likely to have experienced improvement at 6 months.
The only other FABQ work scale cut-off score that we are aware of involves patients with occupational LBP. This previously reported cut-off score was for a single value (FABQ work scale, >29) and associated with similar likelihood ratio values.12 That there are differences in the previously reported score and the scores reported in this study is not surprising when the studies are compared. First, the previous study included only patients with acute, occupational LBP, and our previous work suggests patients with acute, occupational spine pain have higher fear-avoidance beliefs.17 Second, the previously reported FABQ work scale cut-off score was based on an external criterion of return to work, not on the MCID of the ODQ. Therefore, the discrepancy in FABQ work scale cut-off scores is expected and suggests that physical therapists will have to implement practice that sets specific thresholds when using the FABQW for screening purposes.
Future Study
This report provides specific direction for future study in the accuracy of the FABQW as a screening tool. The data presented in this secondary analysis and in the literature suggest the FABQ work scale may be more appropriate for screening than the FABQ physical activity scale for a variety of clinical settings. However, the data to date do not indicate the FABQ work scale alone is a definitive screening tool in predicting future outcome for a majority of patients. We expect the FABQ work scale to be tested and modified in other settings, alone, and in combination with different examination findings. Furthermore, there is some evidence suggesting that males have a stronger association between the FABQ work scale and disability.42 Future studies should consider if sex-specific FABQ cut-off scores improve outcome prediction.
Study Limitations
This study has several limitations that should be considered when interpreting the results. This was a secondary analysis of patients participating in physical therapy clinical trials, resulting in a relatively homogenous group of patients with LBP. One specific area of concern for this study could be the variation in symptom duration. Approximately 25% of the subjects included in this analysis had symptom duration of less than 11 days, while another 25% had symptom duration of greater than 55 days. Ideally, a predictive study would recruit an inception cohort of patients with less variability in symptom duration of LBP. In the current analysis, the effect of symptom duration was accounted for in a regression analysis and it was not a unique predictor of 6-month outcome when other factors were considered (TABLE 3). However, it should be noted that the more rigorous study design to address this particular research question involves recruitment of an inception cohort of patients with LBP. Another area of concern could be that patients not completing the 6-month assessment were younger and, more importantly, had higher baseline pain intensity ratings. Not having these data available for follow-up could have impacted this study’s findings. The authors do not wish to speculate on what this impact might be, but we expect it to be minimal as the regression analysis suggested that baseline pain intensity was not a unique predictor of 6-month outcome (TABLE 3).
Most patients were recruited from military settings and approximately 20% were active duty military with the remainder being family members. Patients had median symptom duration of about 1 month and received either manipulation with exercise, lumbar strengthening and stabilization exercise, or direction-specific exercise biased towards lumbar extension or flexion. All of these sample-specific factors can affect how these results are generalized to other practice settings. Patient self-report of functional limitation is often conceptualized in a continuous fashion, and the strategy of dichotomizing scores based on previously reported MCID scores can be questioned. Furthermore, the MCID was determined by change scores, which have the potential to be affected by regression to the mean. That is, the amount of change may be related to the baseline score with higher baseline scores having the potential to experience larger changes, and more likely to experience an MCID. Last, we did not have detailed information on job tasks for these patients, so it was not possible to stratify FABQ work scale scores based on job demands.
KEY POINTS.
FINDINGS
In a cohort of patients without work-related low back pain, the FABQ work scale was a better predictor of 6-month outcomes, in comparison to the FABQ physical activity scale. FABQ work scale scores of greater than 20 indicated an increased risk of reporting no improvement in 6-month ODQ scores.
IMPLICATIONS
The FABQ work scale was able to predict 6-month disability outcomes; however, it was not a definitive predictive tool and it should be used with other examination findings in clinical settings.
CAUTION
This was a secondary analysis of pooled clinical trials, so the inclusion and exclusion criteria of the individual studies should be considered before clinical application. Furthermore, this study did not involve an inception cohort, as there was a wide range of symptom duration for patients participating in these trials.
Acknowledgments
The protocol for this research was approved by the University of Pittsburgh and participating institutions’ Institutional Review Boards. The project described was supported by grant number R-03 AR051128-01 from the National Institutes of Health-National Institute of Arthritis and Musculoskeletal and Skin Diseases. The Foundation for Physical Therapy provided support for the original randomized trials used in this secondary analysis. The opinions or assertions contained herein are the private views of the authors and are not to be construed as official or as reflecting the views of the US Air Force or Department of Defense.
Appendix
APPENDIX.
THE FEAR-AVOIDANCE BELIEFS QUESTIONNAIRE. ADAPTED FROM WADDELL ET AL.42 SCORING INSTRUCTIONS: FABQ PHYSICAL ACTIVITY SCALE IS CALCULATED BY SUMMING ITEMS 2, 3, 4, AND 5; FABQ WORK SCALE IS CALCULATED BY SUMMING ITEMS 6, 7, 9, 10, 11, 12, AND 15.
![]()
| Here are some of the things other patients have told us about their pain. For each statement please circle the number from 0 to 6 to indicate how much physical activities such as bending, lifting, walking or driving affect or would affect your back pain. | ||||||||
| Completely Disagree |
Unsure | Completely Agree |
||||||
| 1. | My pain was caused by physical activity. | 0 | 1 | 2 | 3 | 4 | 5 | 6 |
| 2. | Physical activity makes my pain worse. | 0 | 1 | 2 | 3 | 4 | 5 | 6 |
| 3. | Physical activity might harm my back. | 0 | 1 | 2 | 3 | 4 | 5 | 6 |
| 4. | I should not do physical activities which (might) make my pain worse. |
0 | 1 | 2 | 3 | 4 | 5 | 6 |
| 5. | I cannot do physical activities which (might) make my pain worse. |
0 | 1 | 2 | 3 | 4 | 5 | 6 |
| The following statements are about how your normal work affects or would affect your back pain. | ||||||||
| Completely Disagree |
Unsure | Completely Agree |
||||||
| 6. | My pain was caused by my work or by an accident at work. |
0 | 1 | 2 | 3 | 4 | 5 | 6 |
| 7. | My work aggravated my pain. | 0 | 1 | 2 | 3 | 4 | 5 | 6 |
| 8. | I have a claim for compensation for my pain. |
0 | 1 | 2 | 3 | 4 | 5 | 6 |
| 9. | My work is too heavy for me. | 0 | 1 | 2 | 3 | 4 | 5 | 6 |
| 10. | My work makes or would make my pain worse. |
0 | 1 | 2 | 3 | 4 | 5 | 6 |
| 11. | My work might harm my back. | 0 | 1 | 2 | 3 | 4 | 5 | 6 |
| 12. | I should not do my regular work with my present pain. |
0 | 1 | 2 | 3 | 4 | 5 | 6 |
| 13. | I cannot do my normal work with my present pain. |
0 | 1 | 2 | 3 | 4 | 5 | 6 |
| 14. | I cannot do my normal work until my pain is treated. |
0 | 1 | 2 | 3 | 4 | 5 | 6 |
| 15. | I do not think that I will be back to my normal work within 3 months. |
0 | 1 | 2 | 3 | 4 | 5 | 6 |
| 16. | I do not think that I will ever be able to go back to that work. |
0 | 1 | 2 | 3 | 4 | 5 | 6 |
REFERENCES
- 1.Al-Obaidi SM, Beattie P, Al-Zoabi B, Al-Wekeel S. The relationship of anticipated pain and fear avoidance beliefs to outcome in patients with chronic low back pain who are not receiving workers’ compensation. Spine. 2005;30:1051–1057. doi: 10.1097/01.brs.0000160848.94706.83. [DOI] [PubMed] [Google Scholar]
- 2.Beurskens AJ, de Vet HC, Koke AJ. Responsiveness of functional status in low back pain: a comparison of different instruments. Pain. 1996;65:71–76. doi: 10.1016/0304-3959(95)00149-2. [DOI] [PubMed] [Google Scholar]
- 3.Burton AK, Waddell G, Tillotson KM, Summerton N. Information and advice to patients with back pain can have a positive effect. A randomized controlled trial of a novel educational booklet in primary care. Spine. 1999;24:2484–2491. doi: 10.1097/00007632-199912010-00010. [DOI] [PubMed] [Google Scholar]
- 4.Childs JD, Fritz JM, Flynn TW, et al. A clinical prediction rule to identify patients with low back pain most likely to benefit from spinal manipulation: a validation study. Ann Intern Med. 2004;141:920–928. doi: 10.7326/0003-4819-141-12-200412210-00008. [DOI] [PubMed] [Google Scholar]
- 5.Crombez G, Vlaeyen JW, Heuts PH, Lysens R. Pain-related fear is more disabling than pain itself: evidence on the role of pain-related fear in chronic back pain disability. Pain. 1999;80:329–339. doi: 10.1016/s0304-3959(98)00229-2. [DOI] [PubMed] [Google Scholar]
- 6.Deyo RA, Battie M, Beurskens AJ, et al. Outcome measures for low back pain research. A proposal for standardized use. Spine. 1998;23:2003–2013. doi: 10.1097/00007632-199809150-00018. [DOI] [PubMed] [Google Scholar]
- 7.Deyo RA, Centor RM. Assessing the responsiveness of functional scales to clinical change: an analogy to diagnostic test performance. J Chronic Dis. 1986;39:897–906. doi: 10.1016/0021-9681(86)90038-x. [DOI] [PubMed] [Google Scholar]
- 8.Deyo RA, Diehr P, Patrick DL. Reproducibility and responsiveness of health status measures. Statistics and strategies for evaluation. Control Clin Trials. 1991;12:142S–158S. doi: 10.1016/s0197-2456(05)80019-4. [DOI] [PubMed] [Google Scholar]
- 9.Fairbank JC, Pynsent PB. The Oswestry Disability Index. Spine. 2000;25:2940–2952. doi: 10.1097/00007632-200011150-00017. discussion 2952. [DOI] [PubMed] [Google Scholar]
- 10.Flynn T, Fritz J, Whitman J, et al. A clinical prediction rule for classifying patients with low back pain who demonstrate short-term improvement with spinal manipulation. Spine. 2002;27:2835–2843. doi: 10.1097/00007632-200212150-00021. [DOI] [PubMed] [Google Scholar]
- 11.Frank JW, Brooker AS, DeMaio SE, et al. Disability resulting from occupational low back pain. Part II: What do we know about secondary prevention? A review of the scientific evidence on prevention after disability begins. Spine. 1996;21:2918–2929. doi: 10.1097/00007632-199612150-00025. [DOI] [PubMed] [Google Scholar]
- 12.Fritz JM, George SZ. Identifying psychosocial variables in patients with acute work-related low back pain: the importance of fear-avoidance beliefs. Phys Ther. 2002;82:973–983. [PubMed] [Google Scholar]
- 13.Fritz JM, George SZ, Delitto A. The role of fear-avoidance beliefs in acute low back pain: relationships with current and future disability and work status. Pain. 2001;94:7–15. doi: 10.1016/S0304-3959(01)00333-5. [DOI] [PubMed] [Google Scholar]
- 14.Fritz JM, Irrgang JJ. A comparison of a modified Oswestry Low Back Pain Disability Questionnaire and the Quebec Back Pain Disability Scale. Phys Ther. 2001;81:776–788. doi: 10.1093/ptj/81.2.776. [DOI] [PubMed] [Google Scholar]
- 15.George SZ, Bialosky JE, Donald DA. The centralization phenomenon and fear-avoidance beliefs as prognostic factors for acute low back pain: a preliminary investigation involving patients classified for specific exercise. J Orthop Sports Phys Ther. 2005;35:580–588. doi: 10.2519/jospt.2005.35.9.580. [DOI] [PubMed] [Google Scholar]
- 16.George SZ, Fritz JM, Bialosky JE, Donald DA. The effect of a fear-avoidance-based physical therapy intervention for patients with acute low back pain: results of a randomized clinical trial. Spine. 2003;28:2551–2560. doi: 10.1097/01.BRS.0000096677.84605.A2. [DOI] [PubMed] [Google Scholar]
- 17.George SZ, Fritz JM, Erhard RE. A comparison of fear-avoidance beliefs in patients with lumbar spine pain and cervical spine pain. Spine. 2001;26:2139–2145. doi: 10.1097/00007632-200110010-00019. [DOI] [PubMed] [Google Scholar]
- 18.George SZ, Fritz JM, McNeil DW. Fear-avoidance beliefs as measured by the fear-avoidance beliefs questionnaire: change in fear-avoidance beliefs questionnaire is predictive of change in self-report of disability and pain intensity for patients with acute low back pain. Clin J Pain. 2006;22:197–203. doi: 10.1097/01.ajp.0000148627.92498.54. [DOI] [PubMed] [Google Scholar]
- 19.Hanley JA, McNeil BJ. The meaning and use of the area under a receiver operating characteristic (ROC) curve. Radiology. 1982;143:29–36. doi: 10.1148/radiology.143.1.7063747. [DOI] [PubMed] [Google Scholar]
- 20.Hanley JA, McNeil BJ. A method of comparing the areas under receiver operating characteristic curves derived from the same cases. Radiology. 1983;148:839–843. doi: 10.1148/radiology.148.3.6878708. [DOI] [PubMed] [Google Scholar]
- 21.Hazard RG, Haugh LD, Reid S, Preble JB, MacDonald L. Early prediction of chronic disability after occupational low back injury. Spine. 1996;21:945–951. doi: 10.1097/00007632-199604150-00008. [DOI] [PubMed] [Google Scholar]
- 22.Hicks GE, Fritz JM, Delitto A, McGill SM. Preliminary development of a clinical prediction rule for determining which patients with low back pain will respond to a stabilization exercise program. Arch Phys Med Rehabil. 2005;86:1753–1762. doi: 10.1016/j.apmr.2005.03.033. [DOI] [PubMed] [Google Scholar]
- 23.Jacob T, Baras M, Zeev A, Epstein L. Low back pain: reliability of a set of pain measurement tools. Arch Phys Med Rehabil. 2001;82:735–742. doi: 10.1053/apmr.2001.22623. [DOI] [PubMed] [Google Scholar]
- 24.Jensen MP, Turner JA, Romano JM. What is the maximum number of levels needed in pain intensity measurement? Pain. 1994;58:387–392. doi: 10.1016/0304-3959(94)90133-3. [DOI] [PubMed] [Google Scholar]
- 25.Kleinbaum DG, Kupper LL, Muller KE, Nizam A. Applied Regression Analysis and Other Multivariable Methods. 3rd ed Brooks/Cole Publishing Company; Pacific Grove, CA: 1998. [Google Scholar]
- 26.Kovacs FM, Muriel A, Medina JM, Abraira V, Sanchez MD, Jauregui JO. Psychometric characteristics of the Spanish version of the FAB questionnaire. Spine. 2006;31:104–110. doi: 10.1097/01.brs.0000193912.36742.4f. [DOI] [PubMed] [Google Scholar]
- 27.Leeuw M, Goossens ME, Linton SJ, Crombez G, Boersma K, Vlaeyen JW. The fear-avoidance model of musculoskeletal pain: current state of scientific evidence. J Behav Med. 2007;30:77–94. doi: 10.1007/s10865-006-9085-0. [DOI] [PubMed] [Google Scholar]
- 28.Lethem J, Slade PD, Troup JD, Bentley G. Outline of a Fear-Avoidance Model of exaggerated pain perception--I. Behav Res Ther. 1983;21:401–408. doi: 10.1016/0005-7967(83)90009-8. [DOI] [PubMed] [Google Scholar]
- 29.Linton SJ. A review of psychological risk factors in back and neck pain. Spine. 2000;25:1148–1156. doi: 10.1097/00007632-200005010-00017. [DOI] [PubMed] [Google Scholar]
- 30.Linton SJ, Hallden K. Can we screen for problematic back pain? A screening questionnaire for predicting outcome in acute and subacute back pain. Clin J Pain. 1998;14:209–215. doi: 10.1097/00002508-199809000-00007. [DOI] [PubMed] [Google Scholar]
- 31.Pfingsten M, Kroner-Herwig B, Leibing E, Kronshage U, Hildebrandt J. Validation of the German version of the Fear-Avoidance Beliefs Questionnaire (FABQ) Eur J Pain. 2000;4:259–266. doi: 10.1053/eujp.2000.0178. [DOI] [PubMed] [Google Scholar]
- 32.Pincus T, Burton AK, Vogel S, Field AP. A systematic review of psychological factors as predictors of chronicity/disability in prospective cohorts of low back pain. Spine. 2002;27:E109–120. doi: 10.1097/00007632-200203010-00017. [DOI] [PubMed] [Google Scholar]
- 33.Pincus T, Vlaeyen JW, Kendall NA, Von Korff MR, Kalauokalani DA, Reis S. Cognitive-behavioral therapy and psychosocial factors in low back pain: directions for the future. Spine. 2002;27:E133–138. doi: 10.1097/00007632-200203010-00020. [DOI] [PubMed] [Google Scholar]
- 34.Roach KE, Brown MD, Dunigan KM, Kusek CL, Walas M. Test-retest reliability of patient reports of low back pain. J Orthop Sports Phys Ther. 1997;26:253–259. doi: 10.2519/jospt.1997.26.5.253. [DOI] [PubMed] [Google Scholar]
- 35.Roland M, Fairbank J. The Roland-Morris Disability Questionnaire and the Oswestry Disability Questionnaire. Spine. 2000;25:3115–3124. doi: 10.1097/00007632-200012150-00006. [DOI] [PubMed] [Google Scholar]
- 36.Staerkle R, Mannion AF, Elfering A, et al. Longitudinal validation of the fear-avoidance beliefs questionnaire (FABQ) in a Swiss-German sample of low back pain patients. Eur Spine J. 2004;13:332–340. doi: 10.1007/s00586-003-0663-3. [DOI] [PMC free article] [PubMed] [Google Scholar]
- 37.Swinkels-Meewisse IE, Roelofs J, Verbeek AL, Oostendorp RA, Vlaeyen JW. Fear of movement/(re)injury, disability and participation in acute low back pain. Pain. 2003;105:371–379. doi: 10.1016/s0304-3959(03)00255-0. [DOI] [PubMed] [Google Scholar]
- 38.Swinkels-Meewisse IE, Roelofs J, Verbeek AL, Oostendorp RA, Vlaeyen JW. Fear-avoidance beliefs, disability, and participation in workers and non-workers with acute low back pain. Clin J Pain. 2006;22:45–54. doi: 10.1097/01.ajp.0000148626.84874.93. [DOI] [PubMed] [Google Scholar]
- 39.Turner JA, Franklin G, Fulton-Kehoe D, et al. Worker recovery expectations and fear-avoidance predict work disability in a population-based workers’ compensation back pain sample. Spine. 2006;31:682–689. doi: 10.1097/01.brs.0000202762.88787.af. [DOI] [PubMed] [Google Scholar]
- 40.Vlaeyen JW, Kole-Snijders AM, Boeren RG, van Eek H. Fear of movement/(re)injury in chronic low back pain and its relation to behavioral performance. Pain. 1995;62:363–372. doi: 10.1016/0304-3959(94)00279-N. [DOI] [PubMed] [Google Scholar]
- 41.Vlaeyen JWS, Kole-Snijders AMJ, Rotteveel AM, Ruesink R, Heuts PHTG. The role of fear of movement/(re)injury in pain disability. J Occup Rehab. 1995;5:235–252. doi: 10.1007/BF02109988. [DOI] [PubMed] [Google Scholar]
- 42.Waddell G, Newton M, Henderson I, Somerville D, Main CJ. A Fear-Avoidance Beliefs Questionnaire (FABQ) and the role of fear-avoidance beliefs in chronic low back pain and disability. Pain. 1993;52:157–168. doi: 10.1016/0304-3959(93)90127-B. [DOI] [PubMed] [Google Scholar]
- 43.Waddell G, Somerville D, Henderson I, Newton M. Objective clinical evaluation of physical impairment in chronic low back pain. Spine. 1992;17:617–628. doi: 10.1097/00007632-199206000-00001. [DOI] [PubMed] [Google Scholar]
- 44.Werneke MW, Hart DL. Categorizing patients with occupational low back pain by use of the Quebec Task Force Classification system versus pain pattern classification procedures: discriminant and predictive validity. Phys Ther. 2004;84:243–254. [PubMed] [Google Scholar]